Estimated zip code population in 2022: 4,851 Zip code population in 2010: 5,564 Zip code population in 2000: 5,614
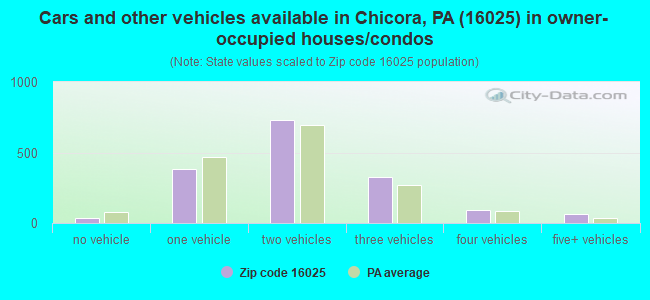
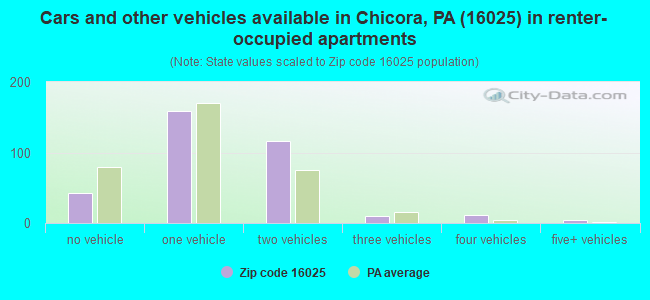
Houses and condos: 2,186 Renter-occupied apartments: 343
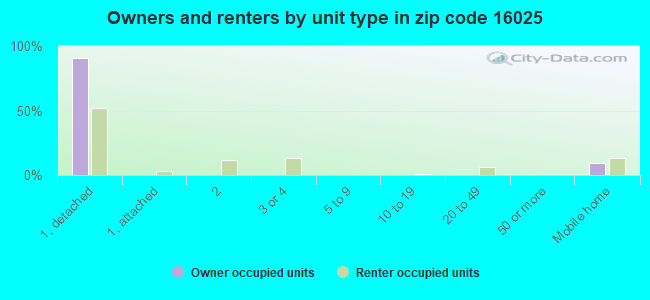
% of renters here:
17%
State:
31%
March 2022 cost of living index in zip code 16025: 88.1 (less than average, U.S. average is 100)
Land area: 53.2 sq. mi. Water area: 0.1 sq. mi.
Population density: 91 people per square mile
(very low).
OSM Map
General Map
Google Map
MSN Map
OSM Map
General Map
Google Map
MSN Map
OSM Map
General Map
Google Map
MSN Map
OSM Map
General Map
Google Map
MSN Map
Please wait while loading the map...
Real estate property taxes paid for housing units in 2022:
This zip code:
0.9% ($1,863)
Pennsylvania:
1.3% ($3,094)
Median real estate property taxes paid for housing units with mortgages in 2022: $1,998 (0.9%) Median real estate property taxes paid for housing units with no mortgage in 2022: $1,724 (0.8%)
Business Search- 14 Million verified businesses
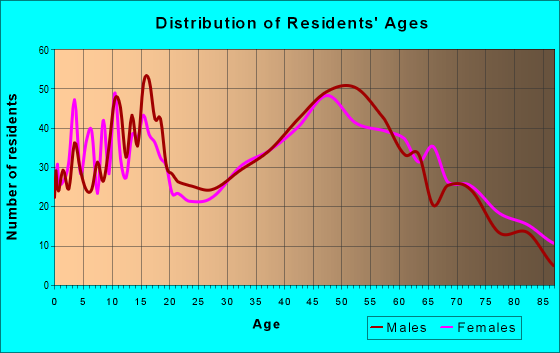
Males: 2,528
(52.1%)
Females: 2,322
(47.9%)
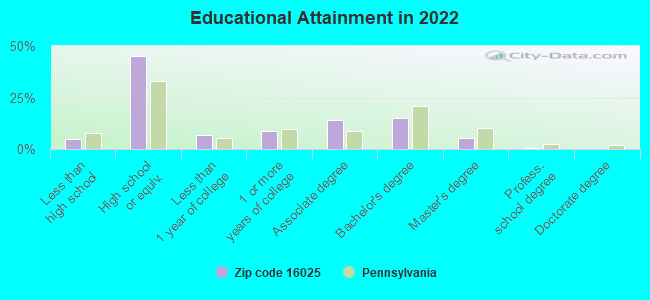
For population 25 years and over in 16025:
High school or higher: 94.7%
Bachelor's degree or higher: 20.6%
Graduate or professional degree: 5.8%
Unemployed: 3.4%
Mean travel time to work (commute): 26.0 minutes
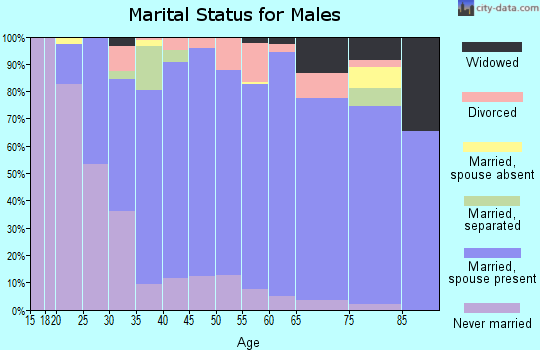
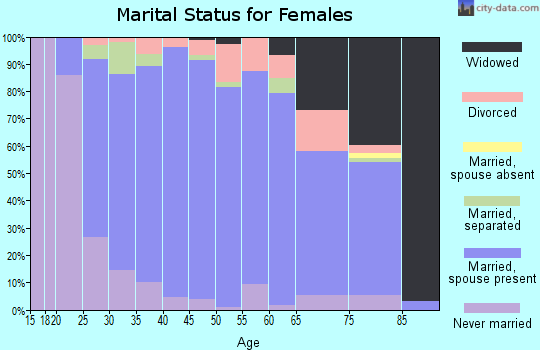
For population 15 years and over in 16025:
Never married: 23.8%
Now married: 56.9%
Separated: 0.8%
Widowed: 5.6%
Divorced: 12.8%
Zip code 16025 compared to state average:
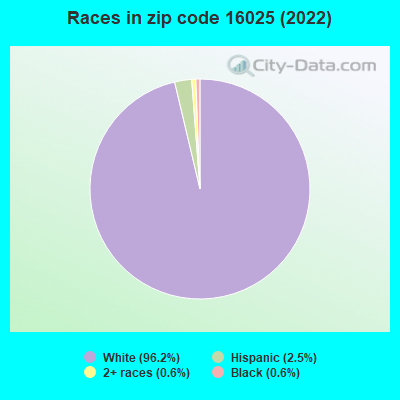
Black race population percentage significantly below state average.
Hispanic race population percentage significantly below state average.
Median age above state average.
Foreign-born population percentage significantly below state average.
Renting percentage below state average.
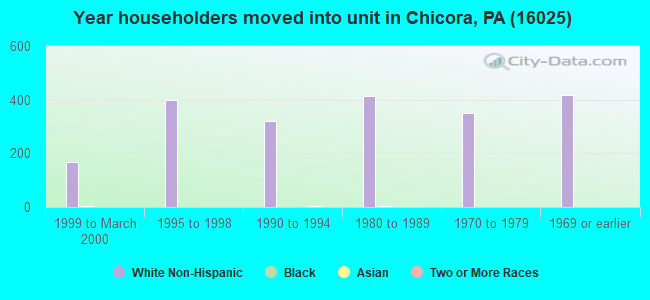
Length of stay since moving in significantly above state average.
Number of college students below state average.
Percentage of population with a bachelor's degree or higher below state average.
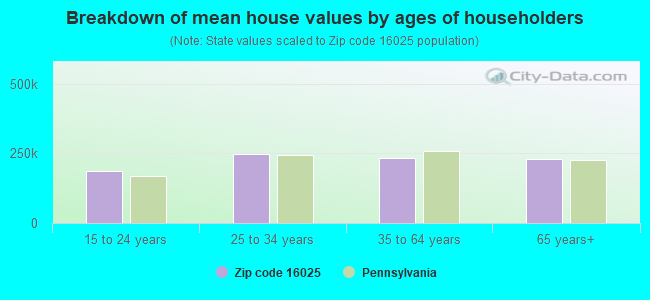
Estimated median house/condo value in 2022: $215,111
16025:
$215,111
Pennsylvania:
$245,500
According to our research of Pennsylvania and other state lists, there were 7 registered sex offenders living in 16025 zip code as of May 23, 2024. The ratio of all residents to sex offenders in zip code 16025 is 795 to 1. The ratio of registered sex offenders to all residents in this zip code is lower than the state average.
Median resident age:
This zip code:
47.2 years
Pennsylvania median age:
40.9 years
Average household size:
This zip code:
2.4 people
Pennsylvania:
2.4 people
Averages for the 2020 tax year for zip code 16025, filed in 2021:
Average Adjusted Gross Income (AGI) in 2020: $60,990 (Individual Income Tax Returns)
Here:
$60,990
State:
$75,707
Salary/wage: $54,743 (reported on 78.1% of returns)
Here:
$54,743
State:
$62,806
(% of AGI for various income ranges: 1018.4% for AGIs below $25k, 3033.5% for AGIs $25k-50k, 5684.8% for AGIs $50k-75k, 8228.8% for AGIs $75k-100k, 13775.5% for AGIs $100k-200k)
Taxable interest for individuals: $787 (reported on 39.4% of returns)
This zip code:
$787
Pennsylvania:
$1,633
(% of AGI for various income ranges: 28.2% for AGIs below $25k, 23.8% for AGIs $25k-50k, 48.5% for AGIs $50k-75k, 52.4% for AGIs $75k-100k, 64.8% for AGIs $100k-200k)
Ordinary dividends: $2,838 (reported on 19.3% of returns)
Here:
$2,838
State:
$7,382
(% of AGI for various income ranges: 26.4% for AGIs below $25k, 25.6% for AGIs $25k-50k, 79.4% for AGIs $50k-75k, 61.6% for AGIs $75k-100k, 155.5% for AGIs $100k-200k)
Net capital gain/loss in AGI: +$6,532 (reported on 17.5% of returns)
Here:
+$6,532
State:
+$23,522
(% of AGI for various income ranges: 2.8% for AGIs below $25k, 26.2% for AGIs $25k-50k, 103.9% for AGIs $50k-75k, 172.4% for AGIs $75k-100k, 285.2% for AGIs $100k-200k)
Profit/loss from business: +$8,113 (reported on 11.2% of returns)
Here:
+$8,113
State:
+$16,274
(% of AGI for various income ranges: 86.8% for AGIs below $25k, 62.5% for AGIs $25k-50k, 60.9% for AGIs $50k-75k, 32.8% for AGIs $75k-100k, 416.1% for AGIs $100k-200k)
Taxable individual retirement arrangement distribution: $14,446 (reported on 15.2% of returns)
16025:
$14,446
Pennsylvania:
$18,583
(% of AGI for various income ranges: 98.0% for AGIs below $25k, 156.0% for AGIs $25k-50k, 334.8% for AGIs $50k-75k, 385.2% for AGIs $75k-100k, 759.7% for AGIs $100k-200k)
Total itemized deductions: $31,620 (reported on 1.9% of returns)
Here:
$31,620
State:
$34,850
(% of AGI for various income ranges: 259.7% for AGIs $50k-75k, 219.4% for AGIs $100k-200k)
Charity contributions: $9,967 (reported on 1.1% of returns)
Here:
$9,967
State:
$12,392
(% of AGI for various income ranges: 90.6% for AGIs $50k-75k)
Taxes paid: $7,100 (reported on 1.9% of returns)
16025:
$7,100
State:
$8,200
(% of AGI for various income ranges: 45.5% for AGIs $50k-75k, 62.1% for AGIs $100k-200k)
Earned income credit: $2,064 (reported on 9.3% of returns)
Here:
$2,064
State:
$2,100
(% of AGI for various income ranges: 56.6% for AGIs below $25k, 42.4% for AGIs $25k-50k)
Percentage of individuals using paid preparers for their 2020 taxes: 94.4%
Here:
94%
State:
92%
(% for various income ranges: 92.0% for AGIs below $25k, 97.0% for AGIs $25k-50k, 93.2% for AGIs $50k-75k, 93.9% for AGIs $75k-100k, 95.6% for AGIs $100k-200k, 100.0% for AGIs over 200k)
Averages for the 2012 tax year for zip code 16025, filed in 2013:
Average Adjusted Gross Income (AGI) in 2012: $55,660 (Individual Income Tax Returns)
Here:
$55,660
State:
$61,346
Salary/wage: $45,734 (reported on 79.9% of returns)
Here:
$45,734
State:
$51,902
(% of AGI for various income ranges: 64.6% for AGIs below $25k, 73.2% for AGIs $25k-50k, 76.0% for AGIs $50k-75k, 78.4% for AGIs $75k-100k, 70.0% for AGIs $100k-200k, 20.4% for AGIs over 200k)
Taxable interest for individuals: $815 (reported on 40.9% of returns)
This zip code:
$815
Pennsylvania:
$1,588
(% of AGI for various income ranges: 1.9% for AGIs below $25k, 0.8% for AGIs $25k-50k, 0.7% for AGIs $50k-75k, 0.4% for AGIs $75k-100k, 0.3% for AGIs $100k-200k, 0.6% for AGIs over 200k)
Ordinary dividends: $2,151 (reported on 21.2% of returns)
Here:
$2,151
State:
$5,827
(% of AGI for various income ranges: 1.5% for AGIs below $25k, 0.7% for AGIs $25k-50k, 0.6% for AGIs $50k-75k, 0.6% for AGIs $75k-100k, 0.9% for AGIs $100k-200k, 0.9% for AGIs over 200k)
Net capital gain/loss in AGI: +$3,477 (reported on 13.0% of returns)
Here:
+$3,477
State:
+$14,495
(% of AGI for various income ranges: 0.6% for AGIs $25k-50k, 0.2% for AGIs $75k-100k, 0.9% for AGIs $100k-200k, 3.2% for AGIs over 200k)
Profit/loss from business: +$10,317 (reported on 13.4% of returns)
Here:
+$10,317
State:
+$16,268
(% of AGI for various income ranges: 5.0% for AGIs below $25k, 2.5% for AGIs $25k-50k, 1.6% for AGIs $50k-75k, 1.6% for AGIs $75k-100k, 4.2% for AGIs $100k-200k)
Taxable individual retirement arrangement distribution: $10,250 (reported on 13.4% of returns)
16025:
$10,250
Pennsylvania:
$14,550
(% of AGI for various income ranges: 5.7% for AGIs below $25k, 3.0% for AGIs $25k-50k, 2.7% for AGIs $50k-75k, 2.8% for AGIs $75k-100k, 2.3% for AGIs $100k-200k)
Total itemized deductions: $17,584 (16% of AGI, reported on 21.2% of returns)
Here:
$17,584
State:
$23,538
Here:
16.5% of AGI
State:
18.4% of AGI
(% of AGI for various income ranges: 5.2% for AGIs below $25k, 4.9% for AGIs $25k-50k, 6.8% for AGIs $50k-75k, 6.9% for AGIs $75k-100k, 8.8% for AGIs $100k-200k, 4.9% for AGIs over 200k)
Charity contributions: $3,358 (reported on 14.9% of returns)
Here:
$3,358
State:
$4,025
(% of AGI for various income ranges: 0.7% for AGIs $25k-50k, 0.5% for AGIs $50k-75k, 0.8% for AGIs $75k-100k, 1.3% for AGIs $100k-200k, 1.4% for AGIs over 200k)
Taxes paid: $6,671 (reported on 20.8% of returns)
16025:
$6,671
State:
$9,982
(% of AGI for various income ranges: 0.8% for AGIs below $25k, 1.3% for AGIs $25k-50k, 2.2% for AGIs $50k-75k, 2.5% for AGIs $75k-100k, 3.6% for AGIs $100k-200k, 2.9% for AGIs over 200k)
Earned income credit: $1,867 (reported on 11.2% of returns)
Here:
$1,867
State:
$2,106
(% of AGI for various income ranges: 3.7% for AGIs below $25k, 0.7% for AGIs $25k-50k)
Percentage of individuals using paid preparers for their 2012 taxes: 56.5%
Here:
57%
State:
53%
(% for various income ranges: 46.9% for AGIs below $25k, 55.7% for AGIs $25k-50k, 66.7% for AGIs $50k-75k, 62.5% for AGIs $75k-100k, 62.5% for AGIs $100k-200k, 83.3% for AGIs over 200k)
Averages for the 2004 tax year for zip code 16025, filed in 2005:
Average Adjusted Gross Income (AGI) in 2004: $38,246 (Individual Income Tax Returns)
Here:
$38,246
State:
$48,049
Salary/wage: $37,031 (reported on 82.1% of returns)
Here:
$37,031
State:
$42,646
(% of AGI for various income ranges: 106.4% for AGIs below $10k, 61.8% for AGIs $10k-25k, 79.3% for AGIs $25k-50k, 84.9% for AGIs $50k-75k, 89.4% for AGIs $75k-100k, 68.6% for AGIs over 100k)
Taxable interest for individuals: $1,101 (reported on 52.2% of returns)
This zip code:
$1,101
Pennsylvania:
$1,657
(% of AGI for various income ranges: 8.1% for AGIs below $10k, 3.5% for AGIs $10k-25k, 1.4% for AGIs $25k-50k, 1.0% for AGIs $50k-75k, 0.8% for AGIs $75k-100k, 1.2% for AGIs over 100k)
Taxable dividends: $1,298 (reported on 23.6% of returns)
Here:
$1,298
State:
$3,566
(% of AGI for various income ranges: 4.5% for AGIs below $10k, 1.2% for AGIs $10k-25k, 0.7% for AGIs $25k-50k, 0.8% for AGIs $50k-75k, 0.4% for AGIs $75k-100k, 0.7% for AGIs over 100k)
Net capital gain/loss: +$2,486 (reported on 16.7% of returns)
Here:
+$2,486
State:
+$9,716
(% of AGI for various income ranges: -1.3% for AGIs below $10k, 0.3% for AGIs $10k-25k, 0.4% for AGIs $25k-50k, 0.7% for AGIs $50k-75k, 0.6% for AGIs $75k-100k, 4.0% for AGIs over 100k)
Profit/loss from business: +$9,085 (reported on 13.9% of returns)
Here:
+$9,085
State:
+$14,267
(% of AGI for various income ranges: 11.0% for AGIs below $10k, 5.9% for AGIs $10k-25k, 2.5% for AGIs $25k-50k, 2.5% for AGIs $50k-75k, 0.5% for AGIs $75k-100k, 6.4% for AGIs over 100k)
IRA payment deduction: $2,531 (reported on 1.9% of returns)
16025:
$2,531
Pennsylvania:
$2,903
Total itemized deductions: $13,826 (20% of AGI, reported on 20.8% of returns)
Here:
$13,826
State:
$18,804
Here:
19.7% of AGI
State:
19.5% of AGI
(% of AGI for various income ranges: 5.6% for AGIs $10k-25k, 5.8% for AGIs $25k-50k, 7.9% for AGIs $50k-75k, 9.8% for AGIs $75k-100k, 9.2% for AGIs over 100k)
Charity contributions deductions: $2,158 (3% of AGI, reported on 17.2% of returns)
Here:
$2,158
State:
$3,337
Here:
2.9% of AGI
State:
3.3% of AGI
(% of AGI for various income ranges: 0.6% for AGIs $10k-25k, 0.5% for AGIs $25k-50k, 0.8% for AGIs $50k-75k, 1.4% for AGIs $75k-100k, 1.8% for AGIs over 100k)
Total tax: $4,544 (reported on 76.5% of returns)
16025:
$4,544
State:
$8,008
(% of AGI for various income ranges: 3.0% for AGIs below $10k, 4.3% for AGIs $10k-25k, 6.6% for AGIs $25k-50k, 8.3% for AGIs $50k-75k, 10.0% for AGIs $75k-100k, 16.8% for AGIs over 100k)
Earned income credit: $1,544 (reported on 11.3% of returns)
Here:
$1,544
State:
$1,643
Percentage of individuals using paid preparers for their 2004 taxes: 58.6%
Here:
59%
State:
56%
(% for various income ranges: 49.2% for AGIs below $10k, 59.9% for AGIs $10k-25k, 61.1% for AGIs $25k-50k, 60.1% for AGIs $50k-75k, 63.6% for AGIs $75k-100k, 66.7% for AGIs over 100k)
Likely homosexual households (counted as self-reported same-sex unmarried-partner households)
Lesbian couples: 0.1% of all households
Gay men: 0.0% of all households
Household received Food Stamps/SNAP in the past 12 months: 253 Household did not receive Food Stamps/SNAP in the past 12 months: 1,722
Women who had a birth in the past 12 months: 41 (36 now married, 6 unmarried) Women who did not have a birth in the past 12 months: 874 (457 now married, 413 unmarried)
Housing units in zip code 16025 with a mortgage: 803 (107 second mortgage, 92 both second mortgage and home equity loan) Houses without a mortgage: 122
Median monthly owner costs for units with a mortgage: $1,272 Median monthly owner costs for units without a mortgage: $443
Residents with income below the poverty level in 2022:
This zip code:
8.3%
Whole state:
11.8%
Residents with income below 50% of the poverty level in 2022:
This zip code:
4.9%
Whole state:
6.1%
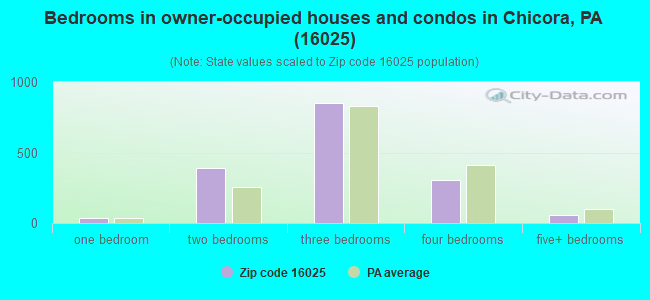
Median number of rooms in houses and condos:
Here:
6.4
State:
6.8
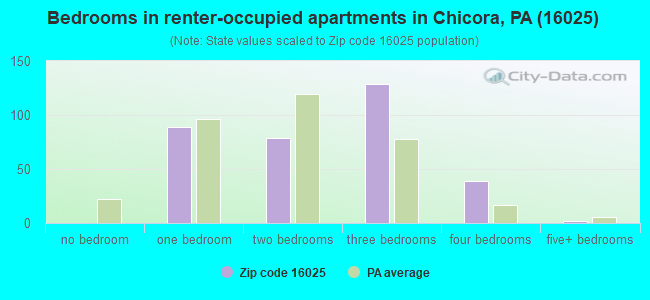
Median number of rooms in apartments:
Here:
5.2
State:
4.3
Notable locations in this zip code not listed on our city pages
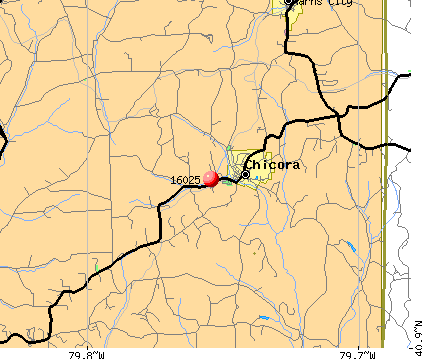
Notable locations in zip code 16025: Starr Crossing (A), Utley (B), Liggett Station (C), Ridgeview Country Club (D), Chicora Community Independent Hose Company Station 26 and Ambulance Station 57 (E). Display/hide their locations on the map
Churches in zip code 16025 include: Mount Pleasant Church (A), Saint Pauls Church (B), North Butler Church (C), Zion Church (D). Display/hide their locations on the map
In group quarters: 126 (-1 institutionalized population)
Size of family households: 663 2-persons, 229 3-persons, 305 4-persons, 73 5-persons, 50 6-persons, 2 7-or-more-persons
Size of nonfamily households: 510 1-person, 125 2-persons, 13 3-persons
702 married couples with children.
149 single-parent households (50 men, 99 women).
98.0% of residents of 16025 zip code speak English at home.
1.3% of residents speak Spanish at home (16% very well, 62% well, 21% not well).
0.5% of residents speak other Indo-European language at home (100% very well).
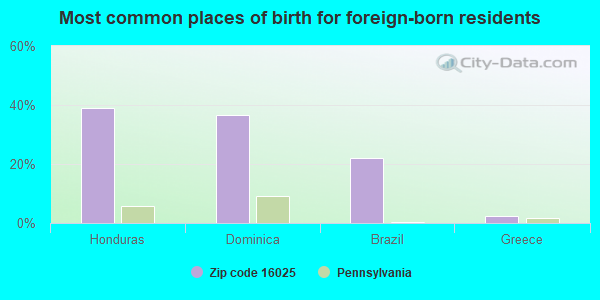
Foreign born population: 41 (0.8%) (30.9% of them are naturalized citizens)
This zip code:
0.8%
Whole state:
7.5%
39%Honduras
37%Dominica
22%Brazil
2%Greece
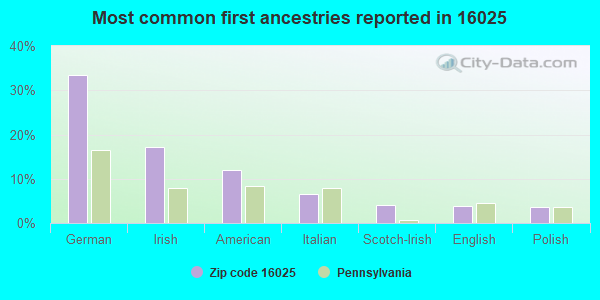
33%German
17%Irish
12%American
7%Italian
4%Scotch-Irish
4%English
4%Polish
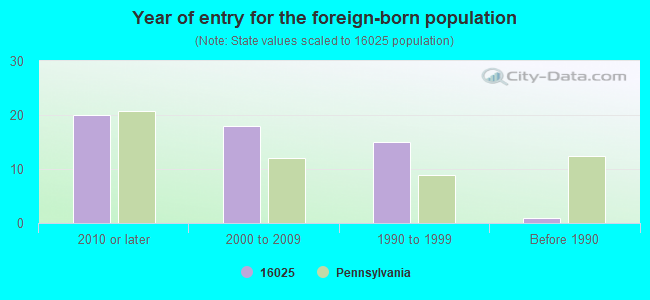
Year of entry for the foreign-born population
202010 or later
182000 to 2009
151990 to 1999
1Before 1990
Facilities with environmental interests located in this zip code:
ALLEGHENY HEAT TREATING MFG (1024 KITTANING PIKE in CHICORA, PA)
STATE MASTER (Pennsylvania database) - AFS-23-2870775-1, AIR PROGRAM TRI REPORTER (Tracking of toxic chemicals releasing facilities) Business SIC classification: METAL HEAT TREATING Alternative names: CMC IMPACT METALS
Housing units lacking complete plumbing facilities: 1.0% Housing units lacking complete kitchen facilities: 0.5%
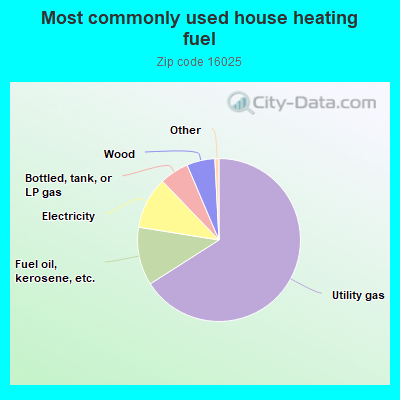
66.1%Utility gas
11.6%Fuel oil, kerosene, etc.
10.3%Electricity
5.8%Bottled, tank, or LP gas
5.6%Wood
Population in 1990: 4,673. Population change in the 1990s: +941 (+20.1%).
Place of birth for U.S.-born residents:
This state: 4,472
Northeast: 74
Midwest: 64
South: 102
West: 39
75% of the 16025 zip code residents lived in the same house 5 years ago. Out of people who lived in different houses, 69% lived in this county. Out of people who lived in different counties, 50% lived in Pennsylvania.
94% of the 16025 zip code residents lived in the same house 1 year ago. Out of people who lived in different houses, 80% moved from this county. Out of people who lived in different houses, 19% moved from different county within same state. Out of people who lived in different houses, 0% moved from different state.
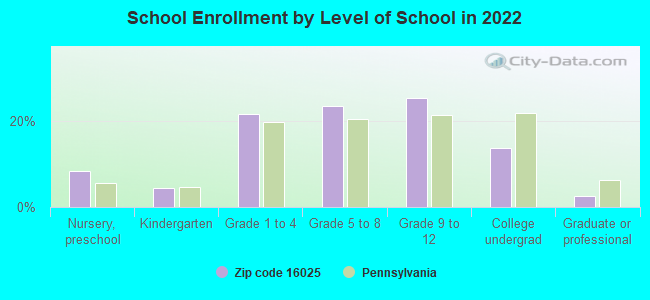
Private vs. public school enrollment:
Students in private schools in grades 1 to 8 (elementary and middle school): 32
Here:
8.7%
Pennsylvania:
15.7%
Students in private schools in grades 9 to 12 (high school): 21
Here:
9.9%
Pennsylvania:
13.4%
Students in private undergraduate colleges: 25
Here:
21.7%
Pennsylvania:
39.8%
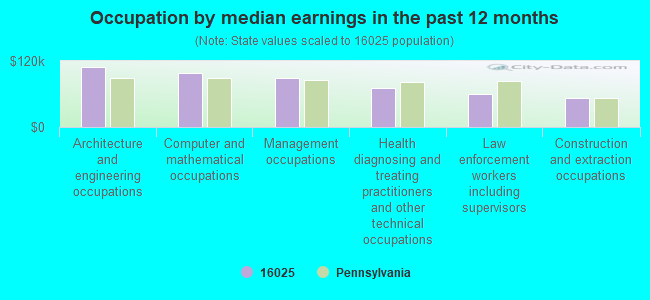
Occupation by median earnings in the past 12 months ($)
108,866Architecture and engineering occupations
97,437Computer and mathematical occupations
89,610Management occupations
71,638Health diagnosing and treating practitioners and other technical occupations
60,440Law enforcement workers including supervisors
53,255Construction and extraction occupations
Top industries in this zip code by the number of employees in 2005:
Health Care and Social Assistance: Nursing Care Facilities (50-99 employees: 1 establishment)
Other Services (except Public Administration): Religious Organizations (10-19: 1, 5-9: 1, 1-4: 3)
Accommodation and Food Services: Limited-Service Restaurants (10-19: 1, 5-9: 1)
Other Services (except Public Administration): Automotive Body, Paint, and Interior Repair and Maintenance (10-19: 1, 1-4: 1)
Other Services (except Public Administration): Civic and Social Organizations (10-19: 1)
People in group quarters in 2010:
120 people in nursing facilities/skilled-nursing facilities
People in group quarters in 2000:
102 people in nursing homes
8 people in other noninstitutional group quarters
7 people in other group homes
2 people in religious group quarters
Fatal accident statistics in 2014:
Fatal accident count: 1
Vehicles involved in fatal accidents: 3
Fatal accidents caused by drunken drivers: 1
Fatalities: 1
Persons involved in fatal accidents: 3
Pedestrians involved in fatal accidents: 0
Fatal accident statistics in 2012:
Fatal accident count: 1
Vehicles involved in fatal accidents: 2
Fatal accidents caused by drunken drivers: 0
Fatalities: 1
Persons involved in fatal accidents: 4
Pedestrians involved in fatal accidents: 0
Home Mortgage Disclosure Act Aggregated Statistics For Year 2009 (Based on 10 partial tracts)
A) FHA, FSA/RHS & VA Home Purchase Loans
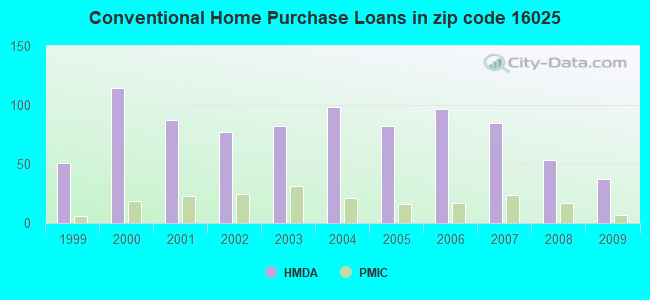
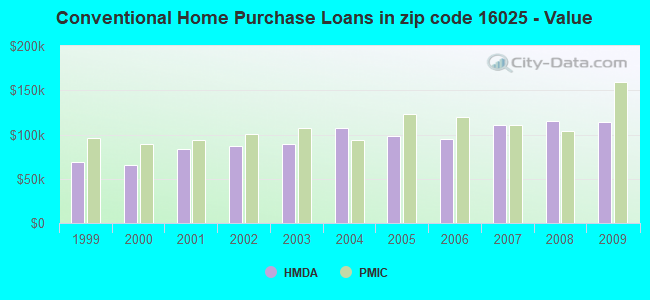
B) Conventional Home Purchase Loans
C) Refinancings
D) Home Improvement Loans
F) Non-occupant Loans on < 5 Family Dwellings (A B C & D)
G) Loans On Manufactured Home Dwelling (A B C & D)
Number
Average Value
Number
Average Value
Number
Average Value
Number
Average Value
Number
Average Value
Number
Average Value
LOANS ORIGINATED
20
$107,951
37
$114,187
185
$116,819
43
$34,991
5
$104,514
12
$62,340
APPLICATIONS APPROVED, NOT ACCEPTED
2
$71,500
3
$105,747
8
$92,372
7
$36,154
1
$4,860
3
$46,327
APPLICATIONS DENIED
4
$107,068
10
$74,111
90
$105,713
18
$40,793
3
$45,470
15
$59,957
APPLICATIONS WITHDRAWN
4
$98,710
3
$147,753
50
$123,561
4
$27,938
1
$35,340
3
$60,580
FILES CLOSED FOR INCOMPLETENESS
0
$0
1
$134,860
7
$117,900
1
$26,230
0
$0
1
$83,990
Aggregated Statistics For Year 2008 (Based on 10 partial tracts)
A) FHA, FSA/RHS & VA Home Purchase Loans
B) Conventional Home Purchase Loans
C) Refinancings
D) Home Improvement Loans
E) Loans on Dwellings For 5+ Families
F) Non-occupant Loans on < 5 Family Dwellings (A B C & D)
G) Loans On Manufactured Home Dwelling (A B C & D)
Number
Average Value
Number
Average Value
Number
Average Value
Number
Average Value
Number
Average Value
Number
Average Value
Number
Average Value
LOANS ORIGINATED
18
$99,329
53
$115,013
106
$102,589
53
$45,373
1
$316,210
6
$101,152
20
$69,729
APPLICATIONS APPROVED, NOT ACCEPTED
1
$85,860
10
$82,618
11
$90,000
7
$53,320
0
$0
3
$73,193
6
$69,267
APPLICATIONS DENIED
4
$109,242
9
$77,470
101
$114,623
26
$42,172
0
$0
4
$51,078
20
$72,230
APPLICATIONS WITHDRAWN
2
$108,825
5
$83,038
43
$130,489
5
$66,538
0
$0
0
$0
5
$73,610
FILES CLOSED FOR INCOMPLETENESS
0
$0
2
$78,870
9
$130,534
1
$47,470
0
$0
0
$0
1
$48,650
Aggregated Statistics For Year 2007 (Based on 10 partial tracts)
A) FHA, FSA/RHS & VA Home Purchase Loans
B) Conventional Home Purchase Loans
C) Refinancings
D) Home Improvement Loans
E) Loans on Dwellings For 5+ Families
F) Non-occupant Loans on < 5 Family Dwellings (A B C & D)
G) Loans On Manufactured Home Dwelling (A B C & D)
Number
Average Value
Number
Average Value
Number
Average Value
Number
Average Value
Number
Average Value
Number
Average Value
Number
Average Value
LOANS ORIGINATED
8
$109,261
85
$110,932
140
$92,743
80
$37,031
1
$393,240
12
$86,733
24
$67,047
APPLICATIONS APPROVED, NOT ACCEPTED
0
$0
12
$84,406
29
$97,107
8
$26,204
0
$0
0
$0
7
$75,830
APPLICATIONS DENIED
1
$97,660
20
$104,890
171
$122,625
35
$46,343
0
$0
6
$97,113
19
$69,962
APPLICATIONS WITHDRAWN
1
$230,440
10
$95,668
45
$110,346
3
$30,200
0
$0
1
$134,370
3
$60,127
FILES CLOSED FOR INCOMPLETENESS
0
$0
3
$94,323
12
$141,987
1
$52,310
0
$0
0
$0
1
$113,880
Aggregated Statistics For Year 2006 (Based on 10 partial tracts)
A) FHA, FSA/RHS & VA Home Purchase Loans
B) Conventional Home Purchase Loans
C) Refinancings
D) Home Improvement Loans
F) Non-occupant Loans on < 5 Family Dwellings (A B C & D)
G) Loans On Manufactured Home Dwelling (A B C & D)
Number
Average Value
Number
Average Value
Number
Average Value
Number
Average Value
Number
Average Value
Number
Average Value
LOANS ORIGINATED
12
$100,944
97
$95,361
166
$88,058
69
$32,091
9
$131,726
29
$69,616
APPLICATIONS APPROVED, NOT ACCEPTED
0
$0
11
$71,205
29
$92,257
10
$31,266
1
$46,850
3
$41,383
APPLICATIONS DENIED
0
$0
20
$83,476
189
$99,733
53
$43,254
7
$71,219
21
$55,282
APPLICATIONS WITHDRAWN
0
$0
12
$107,274
78
$110,890
9
$73,596
2
$85,485
3
$103,510
FILES CLOSED FOR INCOMPLETENESS
0
$0
1
$97,230
18
$127,977
0
$0
0
$0
0
$0
Aggregated Statistics For Year 2005 (Based on 10 partial tracts)
A) FHA, FSA/RHS & VA Home Purchase Loans
B) Conventional Home Purchase Loans
C) Refinancings
D) Home Improvement Loans
F) Non-occupant Loans on < 5 Family Dwellings (A B C & D)
G) Loans On Manufactured Home Dwelling (A B C & D)
Number
Average Value
Number
Average Value
Number
Average Value
Number
Average Value
Number
Average Value
Number
Average Value
LOANS ORIGINATED
5
$90,718
82
$98,438
196
$90,628
83
$32,821
13
$80,576
29
$60,606
APPLICATIONS APPROVED, NOT ACCEPTED
0
$0
22
$89,190
40
$90,554
6
$55,668
3
$45,807
6
$48,778
APPLICATIONS DENIED
1
$68,110
30
$75,620
200
$95,443
42
$33,773
10
$55,580
40
$69,089
APPLICATIONS WITHDRAWN
1
$78,260
9
$68,870
114
$115,973
16
$94,268
2
$57,350
4
$80,060
FILES CLOSED FOR INCOMPLETENESS
0
$0
3
$109,693
13
$109,867
2
$26,255
0
$0
0
$0
Aggregated Statistics For Year 2004 (Based on 10 partial tracts)
A) FHA, FSA/RHS & VA Home Purchase Loans
B) Conventional Home Purchase Loans
C) Refinancings
D) Home Improvement Loans
E) Loans on Dwellings For 5+ Families
F) Non-occupant Loans on < 5 Family Dwellings (A B C & D)
G) Loans On Manufactured Home Dwelling (A B C & D)
Number
Average Value
Number
Average Value
Number
Average Value
Number
Average Value
Number
Average Value
Number
Average Value
Number
Average Value
LOANS ORIGINATED
7
$98,914
98
$107,077
220
$86,125
65
$37,464
3
$99,827
10
$78,359
29
$72,449
APPLICATIONS APPROVED, NOT ACCEPTED
1
$42,790
10
$86,610
45
$83,955
8
$57,386
0
$0
1
$42,750
4
$59,912
APPLICATIONS DENIED
1
$101,460
23
$87,787
156
$91,356
44
$24,083
0
$0
9
$24,797
22
$79,359
APPLICATIONS WITHDRAWN
1
$125,020
15
$98,282
105
$101,945
14
$50,005
0
$0
3
$74,803
10
$67,081
FILES CLOSED FOR INCOMPLETENESS
1
$41,350
6
$89,572
38
$102,024
3
$109,347
0
$0
2
$52,700
0
$0
Aggregated Statistics For Year 2003 (Based on 8 partial tracts)
A) FHA, FSA/RHS & VA Home Purchase Loans
B) Conventional Home Purchase Loans
C) Refinancings
D) Home Improvement Loans
F) Non-occupant Loans on < 5 Family Dwellings (A B C & D)
Number
Average Value
Number
Average Value
Number
Average Value
Number
Average Value
Number
Average Value
LOANS ORIGINATED
7
$105,846
82
$89,131
434
$86,225
58
$31,420
12
$56,957
APPLICATIONS APPROVED, NOT ACCEPTED
1
$134,870
20
$76,002
93
$86,239
12
$39,082
5
$28,950
APPLICATIONS DENIED
0
$0
36
$67,659
223
$95,749
30
$29,164
10
$42,790
APPLICATIONS WITHDRAWN
2
$148,820
18
$94,783
102
$95,588
7
$27,870
4
$54,925
FILES CLOSED FOR INCOMPLETENESS
0
$0
3
$131,047
14
$104,526
2
$30,275
1
$49,460
Aggregated Statistics For Year 2002 (Based on 8 partial tracts)
A) FHA, FSA/RHS & VA Home Purchase Loans
B) Conventional Home Purchase Loans
C) Refinancings
D) Home Improvement Loans
F) Non-occupant Loans on < 5 Family Dwellings (A B C & D)
Number
Average Value
Number
Average Value
Number
Average Value
Number
Average Value
Number
Average Value
LOANS ORIGINATED
11
$94,718
77
$86,824
268
$80,562
49
$31,455
7
$120,126
APPLICATIONS APPROVED, NOT ACCEPTED
0
$0
16
$75,479
85
$79,527
13
$38,218
0
$0
APPLICATIONS DENIED
0
$0
30
$48,123
169
$80,520
23
$31,154
2
$42,715
APPLICATIONS WITHDRAWN
1
$75,280
10
$96,686
110
$98,735
5
$50,742
0
$0
FILES CLOSED FOR INCOMPLETENESS
0
$0
2
$40,295
29
$97,470
2
$41,355
0
$0
Aggregated Statistics For Year 2001 (Based on 8 partial tracts)
A) FHA, FSA/RHS & VA Home Purchase Loans
B) Conventional Home Purchase Loans
C) Refinancings
D) Home Improvement Loans
F) Non-occupant Loans on < 5 Family Dwellings (A B C & D)
Number
Average Value
Number
Average Value
Number
Average Value
Number
Average Value
Number
Average Value
LOANS ORIGINATED
10
$87,914
87
$83,744
235
$74,575
68
$24,189
10
$78,444
APPLICATIONS APPROVED, NOT ACCEPTED
1
$111,890
25
$48,981
78
$67,137
22
$29,209
1
$28,060
APPLICATIONS DENIED
0
$0
57
$50,764
180
$74,894
24
$24,732
0
$0
APPLICATIONS WITHDRAWN
1
$35,100
11
$73,368
106
$87,427
15
$32,819
1
$35,000
FILES CLOSED FOR INCOMPLETENESS
0
$0
2
$43,510
18
$77,218
2
$39,810
0
$0
Aggregated Statistics For Year 2000 (Based on 8 partial tracts)
A) FHA, FSA/RHS & VA Home Purchase Loans
B) Conventional Home Purchase Loans
C) Refinancings
D) Home Improvement Loans
F) Non-occupant Loans on < 5 Family Dwellings (A B C & D)
Number
Average Value
Number
Average Value
Number
Average Value
Number
Average Value
Number
Average Value
LOANS ORIGINATED
11
$89,692
114
$65,794
119
$61,571
56
$18,226
6
$28,433
APPLICATIONS APPROVED, NOT ACCEPTED
1
$87,940
35
$58,717
62
$68,854
17
$23,179
0
$0
APPLICATIONS DENIED
2
$54,975
66
$56,065
100
$62,346
39
$16,912
2
$41,550
APPLICATIONS WITHDRAWN
2
$73,800
9
$46,499
51
$67,765
5
$53,596
1
$41,500
FILES CLOSED FOR INCOMPLETENESS
0
$0
2
$55,855
10
$70,342
0
$0
1
$38,780
Aggregated Statistics For Year 1999 (Based on 4 partial tracts)
A) FHA, FSA/RHS & VA Home Purchase Loans
B) Conventional Home Purchase Loans
C) Refinancings
D) Home Improvement Loans
F) Non-occupant Loans on < 5 Family Dwellings (A B C & D)
2003 - 2018 National Fire Incident Reporting System (NFIRS) incidents
Based on the data from the years 2003 - 2018 the average number of fire incidents per year is 11. The highest number of fires - 48 took place in 2016, and the least - 0 in 2004. The data has an increasing trend.
When looking into fire subcategories, the most reports belonged to: Structure Fires (56.4%), and Outside Fires (27.9%).
Fire incident types reported to NFIRS in Zip Code 16025


 Nearest zip codes: 16041, 16034, 16029, 16050, 16022, 16028.
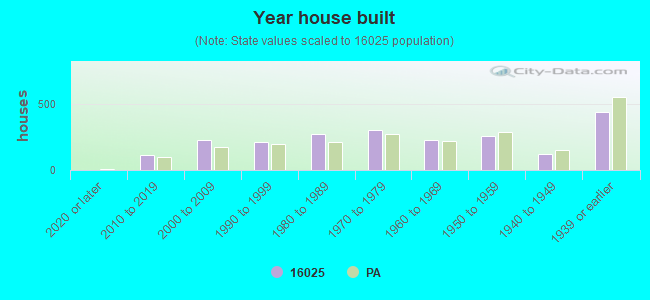


 Based on the data from the years 2003 - 2018 the average number of fire incidents per year is 11. The highest number of fires - 48 took place in 2016, and the least - 0 in 2004. The data has an increasing trend.
 When looking into fire subcategories, the most reports belonged to: Structure Fires (56.4%), and Outside Fires (27.9%).