Estimated zip code population in 2022: 2,273 Zip code population in 2010: 2,301 Zip code population in 2000: 2,376
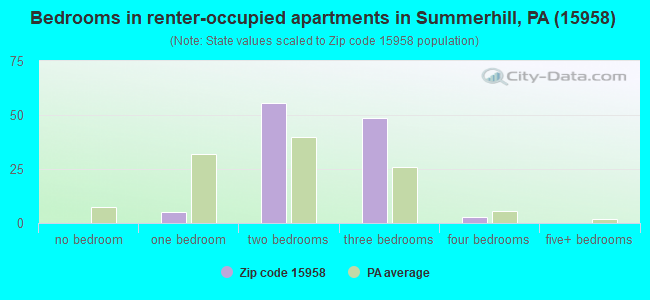
Houses and condos: 998 Renter-occupied apartments: 114
% of renters here:
12%
State:
31%
March 2022 cost of living index in zip code 15958: 91.1 (less than average, U.S. average is 100)
Land area: 19.1 sq. mi. Water area: 0.0 sq. mi.
Population density: 119 people per square mile
(very low).
OSM Map
General Map
Google Map
MSN Map
OSM Map
General Map
Google Map
MSN Map
OSM Map
General Map
Google Map
MSN Map
OSM Map
General Map
Google Map
MSN Map
Please wait while loading the map...
Real estate property taxes paid for housing units in 2022:
This zip code:
1.0% ($1,397)
Pennsylvania:
1.3% ($3,094)
Median real estate property taxes paid for housing units with mortgages in 2022: $1,628 (1.1%) Median real estate property taxes paid for housing units with no mortgage in 2022: $1,233 (0.9%)
Business Search- 14 Million verified businesses
Males: 1,155
(50.8%)
Females: 1,118
(49.2%)
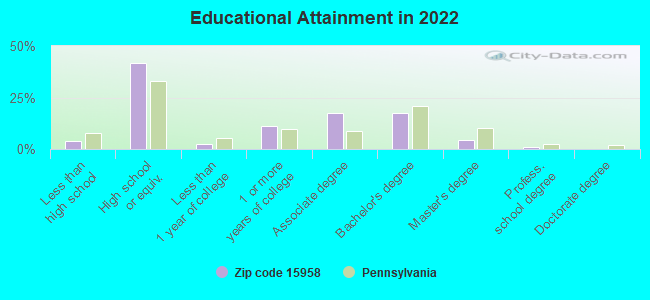
For population 25 years and over in 15958:
High school or higher: 95.3%
Bachelor's degree or higher: 22.9%
Graduate or professional degree: 5.6%
Unemployed: 1.8%
Mean travel time to work (commute): 22.8 minutes
For population 15 years and over in 15958:
Never married: 27.9%
Now married: 50.6%
Separated: 0.8%
Widowed: 7.8%
Divorced: 12.9%
Zip code 15958 compared to state average:
Median house value below state average.
Unemployed percentage below state average.
Black race population percentage significantly below state average.
Hispanic race population percentage significantly below state average.
Foreign-born population percentage significantly below state average.
Renting percentage significantly below state average.
Length of stay since moving in significantly above state average.
Percentage of population with a bachelor's degree or higher below state average.
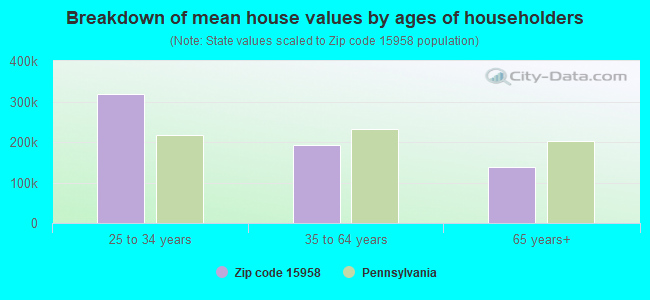
Estimated median house/condo value in 2022: $145,433
15958:
$145,433
Pennsylvania:
$245,500
According to our research of Pennsylvania and other state lists, there was 1 registered sex offender living in 15958 zip code as of May 23, 2024. The ratio of all residents to sex offenders in zip code 15958 is 2,118 to 1. The ratio of registered sex offenders to all residents in this zip code is much lower than the state average.
Median resident age:
This zip code:
43.8 years
Pennsylvania median age:
40.9 years
Average household size:
This zip code:
2.4 people
Pennsylvania:
2.4 people
Averages for the 2020 tax year for zip code 15958, filed in 2021:
Average Adjusted Gross Income (AGI) in 2020: $62,390 (Individual Income Tax Returns)
Here:
$62,390
State:
$75,707
Salary/wage: $56,404 (reported on 78.6% of returns)
Here:
$56,404
State:
$62,806
(% of AGI for various income ranges: 1199.4% for AGIs below $25k, 3368.4% for AGIs $25k-50k, 5715.4% for AGIs $50k-75k, 8996.2% for AGIs $75k-100k, 14530.8% for AGIs $100k-200k)
Taxable interest for individuals: $761 (reported on 49.5% of returns)
This zip code:
$761
Pennsylvania:
$1,633
(% of AGI for various income ranges: 23.3% for AGIs below $25k, 27.9% for AGIs $25k-50k, 80.0% for AGIs $50k-75k, 47.5% for AGIs $75k-100k, 78.3% for AGIs $100k-200k)
Ordinary dividends: $2,858 (reported on 23.3% of returns)
Here:
$2,858
State:
$7,382
(% of AGI for various income ranges: 31.1% for AGIs below $25k, 36.8% for AGIs $25k-50k, 109.2% for AGIs $50k-75k, 77.5% for AGIs $75k-100k, 296.7% for AGIs $100k-200k)
Net capital gain/loss in AGI: +$4,688 (reported on 16.5% of returns)
Here:
+$4,688
State:
+$23,522
(% of AGI for various income ranges: 28.3% for AGIs below $25k, 29.5% for AGIs $25k-50k, 63.1% for AGIs $50k-75k, 506.7% for AGIs $100k-200k)
Profit/loss from business: +$10,644 (reported on 8.7% of returns)
Here:
+$10,644
State:
+$16,274
(% of AGI for various income ranges: 148.9% for AGIs below $25k, 147.7% for AGIs $50k-75k, 415.0% for AGIs $100k-200k)
Taxable individual retirement arrangement distribution: $16,147 (reported on 14.6% of returns)
15958:
$16,147
Pennsylvania:
$18,583
(% of AGI for various income ranges: 130.6% for AGIs below $25k, 212.1% for AGIs $25k-50k, 710.0% for AGIs $50k-75k, 717.5% for AGIs $100k-200k)
Earned income credit: $2,244 (reported on 8.7% of returns)
Here:
$2,244
State:
$2,100
(% of AGI for various income ranges: 60.0% for AGIs below $25k, 49.5% for AGIs $25k-50k)
Percentage of individuals using paid preparers for their 2020 taxes: 90.3%
Here:
90%
State:
92%
(% for various income ranges: 86.7% for AGIs below $25k, 92.0% for AGIs $25k-50k, 88.9% for AGIs $50k-75k, 100.0% for AGIs $75k-100k, 87.5% for AGIs $100k-200k, 100.0% for AGIs over 200k)
Averages for the 2012 tax year for zip code 15958, filed in 2013:
Average Adjusted Gross Income (AGI) in 2012: $48,515 (Individual Income Tax Returns)
Here:
$48,515
State:
$61,346
Salary/wage: $46,026 (reported on 81.3% of returns)
Here:
$46,026
State:
$51,902
(% of AGI for various income ranges: 62.3% for AGIs below $25k, 77.7% for AGIs $25k-50k, 80.3% for AGIs $50k-75k, 78.7% for AGIs $75k-100k, 77.8% for AGIs $100k-200k)
Taxable interest for individuals: $683 (reported on 49.5% of returns)
This zip code:
$683
Pennsylvania:
$1,588
(% of AGI for various income ranges: 3.2% for AGIs below $25k, 0.9% for AGIs $25k-50k, 0.5% for AGIs $50k-75k, 0.2% for AGIs $75k-100k, 0.4% for AGIs $100k-200k)
Ordinary dividends: $1,742 (reported on 22.4% of returns)
Here:
$1,742
State:
$5,827
(% of AGI for various income ranges: 2.7% for AGIs below $25k, 0.6% for AGIs $25k-50k, 0.8% for AGIs $50k-75k, 0.4% for AGIs $75k-100k, 0.7% for AGIs $100k-200k)
Net capital gain/loss in AGI: +$2,333 (reported on 11.2% of returns)
Here:
+$2,333
State:
+$14,495
(% of AGI for various income ranges: 1.9% for AGIs $50k-75k, 0.5% for AGIs $100k-200k)
Profit/loss from business: +$10,244 (reported on 8.4% of returns)
Here:
+$10,244
State:
+$16,268
(% of AGI for various income ranges: 5.1% for AGIs below $25k, 3.9% for AGIs $25k-50k, 4.0% for AGIs $75k-100k)
Taxable individual retirement arrangement distribution: $13,375 (reported on 11.2% of returns)
15958:
$13,375
Pennsylvania:
$14,550
(% of AGI for various income ranges: 4.7% for AGIs below $25k, 4.1% for AGIs $25k-50k, 2.7% for AGIs $50k-75k, 8.5% for AGIs $75k-100k)
Total itemized deductions: $19,144 (18% of AGI, reported on 15.0% of returns)
Here:
$19,144
State:
$23,538
Here:
18.3% of AGI
State:
18.4% of AGI
(% of AGI for various income ranges: 8.5% for AGIs below $25k, 4.8% for AGIs $50k-75k, 6.4% for AGIs $75k-100k, 8.5% for AGIs $100k-200k)
Charity contributions: $2,858 (reported on 11.2% of returns)
Here:
$2,858
State:
$4,025
(% of AGI for various income ranges: 0.9% for AGIs $50k-75k, 0.7% for AGIs $75k-100k, 1.0% for AGIs $100k-200k)
Taxes paid: $7,694 (reported on 15.0% of returns)
15958:
$7,694
State:
$9,982
(% of AGI for various income ranges: 2.2% for AGIs below $25k, 1.3% for AGIs $50k-75k, 1.8% for AGIs $75k-100k, 4.4% for AGIs $100k-200k)
Earned income credit: $1,692 (reported on 11.2% of returns)
Here:
$1,692
State:
$2,106
(% of AGI for various income ranges: 2.9% for AGIs below $25k, 0.9% for AGIs $25k-50k)
Percentage of individuals using paid preparers for their 2012 taxes: 55.1%
Here:
55%
State:
53%
(% for various income ranges: 48.8% for AGIs below $25k, 56.0% for AGIs $25k-50k, 61.1% for AGIs $50k-75k, 60.0% for AGIs $75k-100k, 61.5% for AGIs $100k-200k)
Averages for the 2004 tax year for zip code 15958, filed in 2005:
Average Adjusted Gross Income (AGI) in 2004: $35,745 (Individual Income Tax Returns)
Here:
$35,745
State:
$48,049
Salary/wage: $34,263 (reported on 84.4% of returns)
Here:
$34,263
State:
$42,646
(% of AGI for various income ranges: 81.8% for AGIs below $10k, 66.2% for AGIs $10k-25k, 79.8% for AGIs $25k-50k, 87.4% for AGIs $50k-75k, 87.8% for AGIs $75k-100k, 73.9% for AGIs over 100k)
Taxable interest for individuals: $951 (reported on 59.9% of returns)
This zip code:
$951
Pennsylvania:
$1,657
(% of AGI for various income ranges: 7.1% for AGIs below $10k, 3.8% for AGIs $10k-25k, 1.2% for AGIs $25k-50k, 0.8% for AGIs $50k-75k, 1.1% for AGIs $75k-100k, 1.3% for AGIs over 100k)
Taxable dividends: $1,520 (reported on 26.9% of returns)
Here:
$1,520
State:
$3,566
(% of AGI for various income ranges: 1.4% for AGIs below $10k, 2.3% for AGIs $10k-25k, 1.4% for AGIs $25k-50k, 0.5% for AGIs $50k-75k, 0.4% for AGIs $75k-100k, 1.9% for AGIs over 100k)
Net capital gain/loss: +$1,323 (reported on 16.3% of returns)
Here:
+$1,323
State:
+$9,716
(% of AGI for various income ranges: -3.2% for AGIs below $10k, 1.1% for AGIs $10k-25k, 1.3% for AGIs $25k-50k, 0.2% for AGIs $50k-75k, 0.2% for AGIs $75k-100k, 1.0% for AGIs over 100k)
Profit/loss from business: +$7,451 (reported on 8.9% of returns)
Here:
+$7,451
State:
+$14,267
(% of AGI for various income ranges: 2.7% for AGIs below $10k, 2.5% for AGIs $10k-25k, 4.1% for AGIs $25k-50k, 1.9% for AGIs $75k-100k)
IRA payment deduction: $2,950 (reported on 3.9% of returns)
15958:
$2,950
Pennsylvania:
$2,903
Total itemized deductions: $14,047 (19% of AGI, reported on 14.5% of returns)
Here:
$14,047
State:
$18,804
Here:
18.9% of AGI
State:
19.5% of AGI
(% of AGI for various income ranges: 5.6% for AGIs $25k-50k, 5.8% for AGIs $50k-75k, 8.2% for AGIs $75k-100k, 7.7% for AGIs over 100k)
Charity contributions deductions: $2,266 (3% of AGI, reported on 12.5% of returns)
Here:
$2,266
State:
$3,337
Here:
3.0% of AGI
State:
3.3% of AGI
(% of AGI for various income ranges: 0.5% for AGIs $25k-50k, 1.2% for AGIs $50k-75k, 1.0% for AGIs $75k-100k, 1.1% for AGIs over 100k)
Total tax: $4,213 (reported on 72.1% of returns)
15958:
$4,213
State:
$8,008
(% of AGI for various income ranges: 2.1% for AGIs below $10k, 3.9% for AGIs $10k-25k, 5.9% for AGIs $25k-50k, 7.8% for AGIs $50k-75k, 10.2% for AGIs $75k-100k, 16.5% for AGIs over 100k)
Earned income credit: $1,459 (reported on 10.9% of returns)
Here:
$1,459
State:
$1,643
Percentage of individuals using paid preparers for their 2004 taxes: 52.6%
Here:
53%
State:
56%
(% for various income ranges: 47.8% for AGIs below $10k, 51.9% for AGIs $10k-25k, 58.3% for AGIs $25k-50k, 46.5% for AGIs $50k-75k, 57.5% for AGIs $75k-100k, 60.0% for AGIs over 100k)
Household received Food Stamps/SNAP in the past 12 months: 64 Household did not receive Food Stamps/SNAP in the past 12 months: 862
Women who had a birth in the past 12 months: 9 (8 now married, 0 unmarried) Women who did not have a birth in the past 12 months: 418 (171 now married, 247 unmarried)
Housing units in zip code 15958 with a mortgage: 339 (39 second mortgage, 29 both second mortgage and home equity loan) Houses without a mortgage: 29
Median monthly owner costs for units with a mortgage: $1,060 Median monthly owner costs for units without a mortgage: $463
Residents with income below the poverty level in 2022:
This zip code:
4.1%
Whole state:
11.8%
Residents with income below 50% of the poverty level in 2022:
This zip code:
2.6%
Whole state:
6.1%
Median number of rooms in houses and condos:
Here:
7.2
State:
6.8
Median number of rooms in apartments:
Here:
5.4
State:
4.3
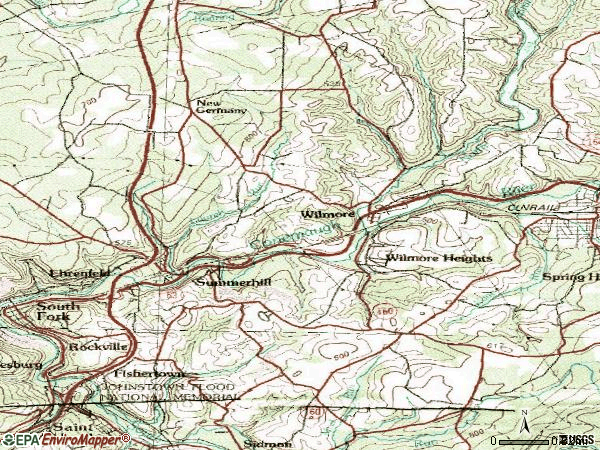
Notable locations in this zip code not listed on our city pages
Notable locations in zip code 15958: Buckhorn Grange (A), Cambria County Fairground (B), Summerhill Borough Fire Department (C). Display/hide their locations on the map
Cemeteries: Saints Peter and Paul Cemetery (1), Pringle Hill Cemetery (2), Mount Union Cemetery (3), Sherbine Cemetery (4). Display/hide their locations on the map
In group quarters: 10 (-1 institutionalized population)
Size of family households: 331 2-persons, 155 3-persons, 154 4-persons, 31 5-persons, 3 7-or-more-persons
Size of nonfamily households: 207 1-person, 23 2-persons, 18 3-persons
196 married couples with children.
298 single-parent households (277 men, 21 women).
98.1% of residents of 15958 zip code speak English at home.
0.7% of residents speak Spanish at home (88% very well, 12% not well).
0.7% of residents speak Asian or Pacific Island language at home (69% very well, 31% well).
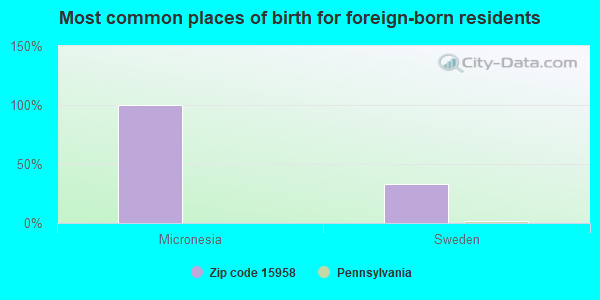
Foreign born population: 6 (0.3%) (51.0% of them are naturalized citizens)
This zip code:
0.3%
Whole state:
7.5%
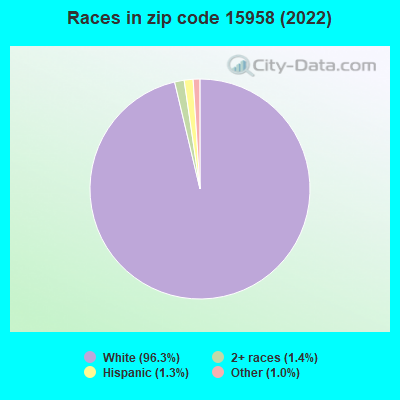
100%Micronesia
33%Sweden
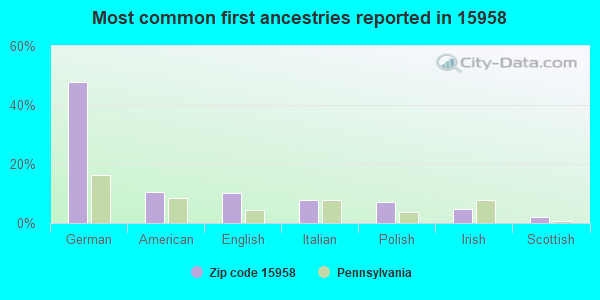
48%German
11%American
10%English
8%Italian
7%Polish
5%Irish
2%Scottish
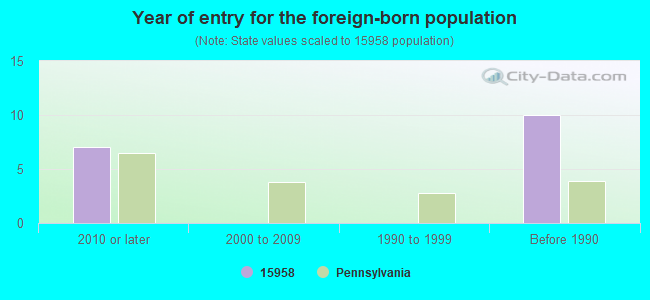
Year of entry for the foreign-born population
72010 or later
02000 to 2009
01990 to 1999
10Before 1990
Facilities with environmental interests located in this zip code:
C & C SMITH LUMBER CO/CROYLE WOOD PELLET (RR 1 BOX 341 in SUMMERHILL, PA)
AIR SYNTHETIC MINOR (AIRS/AFS) Business SIC classification: WOOD PRODUCTS Alternative names: C & C SMITH LUMBER C CROYLE WOOD PELLETS
Housing units lacking complete plumbing facilities: 1.8% Housing units lacking complete kitchen facilities: 3.5%
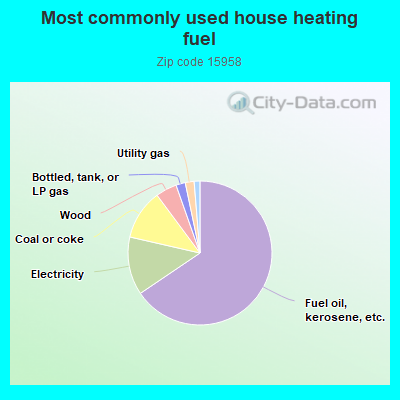
65.8%Fuel oil, kerosene, etc.
13.1%Electricity
11.3%Coal or coke
4.8%Wood
2.1%Bottled, tank, or LP gas
2.0%Utility gas
0.7%Other fuel
0.7%No fuel used
Population in 1990: 2,215. Population change in the 1990s: +161 (+7.3%).
Place of birth for U.S.-born residents:
This state: 2,056
Northeast: 56
Midwest: 11
South: 95
West: 18
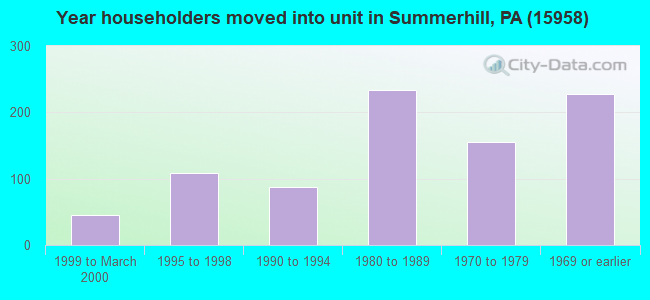
85% of the 15958 zip code residents lived in the same house 5 years ago. Out of people who lived in different houses, 71% lived in this county. Out of people who lived in different counties, 50% lived in Pennsylvania.
93% of the 15958 zip code residents lived in the same house 1 year ago. Out of people who lived in different houses, 70% moved from this county. Out of people who lived in different houses, 1% moved from different county within same state. Out of people who lived in different houses, 13% moved from different state. Out of people who lived in different houses, 17% moved from abroad.
Private vs. public school enrollment:
Students in private schools in grades 1 to 8 (elementary and middle school): 36
Here:
11.5%
Pennsylvania:
15.7%
Students in private schools in grades 9 to 12 (high school): 6
Here:
6.2%
Pennsylvania:
13.4%
Students in private undergraduate colleges: 27
Here:
40.4%
Pennsylvania:
39.8%
Occupation by median earnings in the past 12 months ($)
81,955Architecture and engineering occupations
70,755Management occupations
70,672Health diagnosing and treating practitioners and other technical occupations
61,201Education, training, and library occupations
52,352Community and social service occupations
52,269Production occupations
Top industries in this zip code by the number of employees in 2005:
Construction: Drywall and Insulation Contractors (100-249 employees: 1 establishment)
Other Services (except Public Administration): Commercial and Industrial Machinery and Equipment (except Automotive and Electronic) Repair and Maintenance (20-49: 1)
Health Care and Social Assistance: Homes for the Elderly (10-19: 1)
Accommodation and Food Services: Full-Service Restaurants (10-19: 1)
Health Care and Social Assistance: Ambulance Services (10-19: 1)
Other Services (except Public Administration): Religious Organizations (5-9: 2)
People in group quarters in 2000:
10 people in other noninstitutional group quarters
2 people in religious group quarters
Fatal accident statistics in 2013:
Fatal accident count: 1
Vehicles involved in fatal accidents: 1
Fatal accidents caused by drunken drivers: 1
Fatalities: 1
Persons involved in fatal accidents: 2
Pedestrians involved in fatal accidents: 0
Fatal accident statistics in 2012:
Fatal accident count: 1
Vehicles involved in fatal accidents: 2
Fatal accidents caused by drunken drivers: 1
Fatalities: 1
Persons involved in fatal accidents: 2
Pedestrians involved in fatal accidents: 0
Home Mortgage Disclosure Act Aggregated Statistics For Year 2009 (Based on 4 partial tracts)
A) FHA, FSA/RHS & VA Home Purchase Loans
B) Conventional Home Purchase Loans
C) Refinancings
D) Home Improvement Loans
F) Non-occupant Loans on < 5 Family Dwellings (A B C & D)
G) Loans On Manufactured Home Dwelling (A B C & D)
Number
Average Value
Number
Average Value
Number
Average Value
Number
Average Value
Number
Average Value
Number
Average Value
LOANS ORIGINATED
10
$78,767
17
$78,556
50
$97,781
23
$28,917
1
$38,820
2
$54,245
APPLICATIONS APPROVED, NOT ACCEPTED
0
$0
1
$147,250
6
$101,545
1
$10,640
1
$19,620
0
$0
APPLICATIONS DENIED
1
$43,610
4
$45,515
19
$81,513
8
$25,648
1
$12,610
1
$13,300
APPLICATIONS WITHDRAWN
1
$20,210
1
$144,510
9
$114,813
3
$46,593
1
$55,310
0
$0
FILES CLOSED FOR INCOMPLETENESS
0
$0
0
$0
1
$227,690
0
$0
0
$0
0
$0
Aggregated Statistics For Year 2008 (Based on 4 partial tracts)
A) FHA, FSA/RHS & VA Home Purchase Loans
B) Conventional Home Purchase Loans
C) Refinancings
D) Home Improvement Loans
F) Non-occupant Loans on < 5 Family Dwellings (A B C & D)
G) Loans On Manufactured Home Dwelling (A B C & D)
Number
Average Value
Number
Average Value
Number
Average Value
Number
Average Value
Number
Average Value
Number
Average Value
LOANS ORIGINATED
15
$82,539
23
$86,663
44
$86,071
30
$25,748
8
$48,040
1
$124,710
APPLICATIONS APPROVED, NOT ACCEPTED
0
$0
4
$74,612
5
$39,446
1
$32,440
1
$18,920
1
$107,960
APPLICATIONS DENIED
2
$48,615
7
$65,654
45
$76,842
20
$48,866
2
$40,540
3
$53,013
APPLICATIONS WITHDRAWN
1
$112,100
3
$107,030
8
$117,601
3
$53,627
0
$0
0
$0
FILES CLOSED FOR INCOMPLETENESS
0
$0
1
$41,340
2
$132,880
0
$0
0
$0
0
$0
Aggregated Statistics For Year 2007 (Based on 4 partial tracts)
A) FHA, FSA/RHS & VA Home Purchase Loans
B) Conventional Home Purchase Loans
C) Refinancings
D) Home Improvement Loans
F) Non-occupant Loans on < 5 Family Dwellings (A B C & D)
G) Loans On Manufactured Home Dwelling (A B C & D)
Number
Average Value
Number
Average Value
Number
Average Value
Number
Average Value
Number
Average Value
Number
Average Value
LOANS ORIGINATED
10
$54,506
32
$97,472
38
$62,066
40
$29,224
5
$43,710
1
$67,910
APPLICATIONS APPROVED, NOT ACCEPTED
1
$43,610
2
$53,620
8
$83,995
2
$7,840
0
$0
0
$0
APPLICATIONS DENIED
1
$28,020
8
$75,610
43
$81,758
34
$23,507
2
$24,730
4
$48,172
APPLICATIONS WITHDRAWN
1
$70,200
3
$65,683
9
$77,312
2
$13,580
2
$64,755
0
$0
FILES CLOSED FOR INCOMPLETENESS
1
$22,870
1
$178,150
2
$186,010
1
$4,250
0
$0
0
$0
Aggregated Statistics For Year 2006 (Based on 4 partial tracts)
A) FHA, FSA/RHS & VA Home Purchase Loans
B) Conventional Home Purchase Loans
C) Refinancings
D) Home Improvement Loans
F) Non-occupant Loans on < 5 Family Dwellings (A B C & D)
G) Loans On Manufactured Home Dwelling (A B C & D)
Number
Average Value
Number
Average Value
Number
Average Value
Number
Average Value
Number
Average Value
Number
Average Value
LOANS ORIGINATED
10
$73,430
32
$80,433
48
$69,755
34
$16,119
3
$74,137
4
$35,185
APPLICATIONS APPROVED, NOT ACCEPTED
1
$15,420
3
$49,937
9
$48,844
3
$39,197
0
$0
0
$0
APPLICATIONS DENIED
1
$85,240
6
$74,943
66
$68,054
21
$22,000
2
$13,900
0
$0
APPLICATIONS WITHDRAWN
0
$0
5
$73,156
21
$75,845
1
$30,310
0
$0
0
$0
FILES CLOSED FOR INCOMPLETENESS
0
$0
2
$38,335
8
$109,601
1
$98,000
1
$123,310
0
$0
Aggregated Statistics For Year 2005 (Based on 4 partial tracts)
A) FHA, FSA/RHS & VA Home Purchase Loans
B) Conventional Home Purchase Loans
C) Refinancings
D) Home Improvement Loans
F) Non-occupant Loans on < 5 Family Dwellings (A B C & D)
G) Loans On Manufactured Home Dwelling (A B C & D)
Number
Average Value
Number
Average Value
Number
Average Value
Number
Average Value
Number
Average Value
Number
Average Value
LOANS ORIGINATED
5
$63,902
37
$92,910
52
$66,257
43
$20,684
6
$40,182
3
$63,927
APPLICATIONS APPROVED, NOT ACCEPTED
0
$0
1
$28,060
9
$68,256
2
$24,730
1
$10,510
1
$111,430
APPLICATIONS DENIED
0
$0
5
$70,916
70
$60,742
20
$33,320
2
$32,360
3
$72,387
APPLICATIONS WITHDRAWN
1
$26,590
4
$130,558
35
$82,340
2
$27,900
0
$0
1
$98,080
FILES CLOSED FOR INCOMPLETENESS
0
$0
1
$18,080
6
$97,372
0
$0
0
$0
1
$93,880
Aggregated Statistics For Year 2004 (Based on 4 partial tracts)
A) FHA, FSA/RHS & VA Home Purchase Loans
B) Conventional Home Purchase Loans
C) Refinancings
D) Home Improvement Loans
F) Non-occupant Loans on < 5 Family Dwellings (A B C & D)
G) Loans On Manufactured Home Dwelling (A B C & D)
Number
Average Value
Number
Average Value
Number
Average Value
Number
Average Value
Number
Average Value
Number
Average Value
LOANS ORIGINATED
7
$64,747
36
$67,585
65
$62,893
51
$24,056
7
$50,496
6
$37,942
APPLICATIONS APPROVED, NOT ACCEPTED
1
$38,530
1
$17,520
10
$49,508
2
$36,945
1
$28,190
1
$17,520
APPLICATIONS DENIED
0
$0
4
$35,935
50
$62,198
15
$36,121
5
$28,418
3
$95,960
APPLICATIONS WITHDRAWN
0
$0
4
$38,965
36
$59,162
5
$36,556
2
$41,585
0
$0
FILES CLOSED FOR INCOMPLETENESS
0
$0
1
$13,300
8
$76,416
1
$21,270
0
$0
0
$0
Aggregated Statistics For Year 2003 (Based on 4 partial tracts)
A) FHA, FSA/RHS & VA Home Purchase Loans
B) Conventional Home Purchase Loans
C) Refinancings
D) Home Improvement Loans
E) Loans on Dwellings For 5+ Families
F) Non-occupant Loans on < 5 Family Dwellings (A B C & D)
Number
Average Value
Number
Average Value
Number
Average Value
Number
Average Value
Number
Average Value
Number
Average Value
LOANS ORIGINATED
7
$56,380
28
$71,742
110
$55,307
41
$15,642
1
$319,080
6
$33,185
APPLICATIONS APPROVED, NOT ACCEPTED
0
$0
2
$55,655
20
$67,236
2
$7,710
0
$0
1
$28,020
APPLICATIONS DENIED
1
$72,860
10
$39,576
63
$62,817
8
$10,731
0
$0
2
$11,700
APPLICATIONS WITHDRAWN
0
$0
4
$120,090
27
$69,495
3
$24,430
0
$0
0
$0
FILES CLOSED FOR INCOMPLETENESS
0
$0
1
$53,180
3
$46,367
1
$21,020
0
$0
0
$0
Aggregated Statistics For Year 2002 (Based on 4 partial tracts)
A) FHA, FSA/RHS & VA Home Purchase Loans
B) Conventional Home Purchase Loans
C) Refinancings
D) Home Improvement Loans
F) Non-occupant Loans on < 5 Family Dwellings (A B C & D)
Number
Average Value
Number
Average Value
Number
Average Value
Number
Average Value
Number
Average Value
LOANS ORIGINATED
7
$71,934
22
$54,468
71
$284,341
39
$20,222
5
$3,253,664
APPLICATIONS APPROVED, NOT ACCEPTED
0
$0
1
$49,040
11
$62,093
3
$25,077
0
$0
APPLICATIONS DENIED
1
$58,150
8
$33,120
57
$58,566
11
$9,146
1
$4,200
APPLICATIONS WITHDRAWN
1
$23,930
1
$53,710
31
$63,425
1
$7,450
1
$48,340
FILES CLOSED FOR INCOMPLETENESS
0
$0
0
$0
8
$86,048
0
$0
1
$37,230
Aggregated Statistics For Year 2001 (Based on 4 partial tracts)
A) FHA, FSA/RHS & VA Home Purchase Loans
B) Conventional Home Purchase Loans
C) Refinancings
D) Home Improvement Loans
E) Loans on Dwellings For 5+ Families
F) Non-occupant Loans on < 5 Family Dwellings (A B C & D)
Number
Average Value
Number
Average Value
Number
Average Value
Number
Average Value
Number
Average Value
Number
Average Value
LOANS ORIGINATED
10
$47,321
32
$61,310
70
$45,817
58
$13,626
1
$56,050
3
$32,263
APPLICATIONS APPROVED, NOT ACCEPTED
0
$0
2
$46,090
10
$50,936
5
$16,868
0
$0
0
$0
APPLICATIONS DENIED
1
$33,630
9
$28,241
40
$46,706
17
$7,996
0
$0
1
$31,380
APPLICATIONS WITHDRAWN
1
$10,510
0
$0
15
$63,866
1
$6,910
0
$0
1
$151,090
FILES CLOSED FOR INCOMPLETENESS
0
$0
0
$0
6
$49,933
1
$26,590
0
$0
0
$0
Aggregated Statistics For Year 2000 (Based on 4 partial tracts)
A) FHA, FSA/RHS & VA Home Purchase Loans
B) Conventional Home Purchase Loans
C) Refinancings
D) Home Improvement Loans
F) Non-occupant Loans on < 5 Family Dwellings (A B C & D)
Number
Average Value
Number
Average Value
Number
Average Value
Number
Average Value
Number
Average Value
LOANS ORIGINATED
10
$73,607
18
$47,414
27
$40,121
52
$10,246
2
$28,335
APPLICATIONS APPROVED, NOT ACCEPTED
0
$0
3
$35,767
11
$59,273
2
$74,450
2
$26,275
APPLICATIONS DENIED
1
$46,270
11
$58,627
25
$44,358
11
$11,537
2
$20,475
APPLICATIONS WITHDRAWN
0
$0
3
$65,927
9
$35,198
2
$23,835
1
$45,540
FILES CLOSED FOR INCOMPLETENESS
0
$0
0
$0
3
$108,803
1
$31,910
0
$0
Aggregated Statistics For Year 1999 (Based on 2 partial tracts)
A) FHA, FSA/RHS & VA Home Purchase Loans
B) Conventional Home Purchase Loans
C) Refinancings
D) Home Improvement Loans
F) Non-occupant Loans on < 5 Family Dwellings (A B C & D)


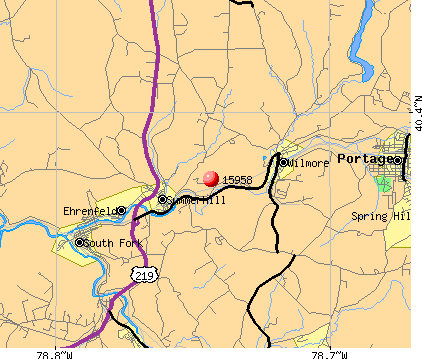 Nearest zip codes: 15962, 15951, 15955, 15956, 15921, 15942.