Estimated zip code population in 2022: 2,008 Zip code population in 2010: 2,079 Zip code population in 2000: 2,055
Houses and condos: 787 Renter-occupied apartments: 60
% of renters here:
8%
State:
31%
March 2022 cost of living index in zip code 15942: 91.5 (less than average, U.S. average is 100)
Land area: 18.5 sq. mi. Water area: 0.2 sq. mi.
Population density: 108 people per square mile
(very low).
OSM Map
General Map
Google Map
MSN Map
OSM Map
General Map
Google Map
MSN Map
OSM Map
General Map
Google Map
MSN Map
OSM Map
General Map
Google Map
MSN Map
Please wait while loading the map...
Real estate property taxes paid for housing units in 2022:
This zip code:
0.7% ($1,328)
Pennsylvania:
1.3% ($3,094)
Median real estate property taxes paid for housing units with mortgages in 2022: $1,437 (0.8%) Median real estate property taxes paid for housing units with no mortgage in 2022: $1,192 (0.6%)
Business Search- 14 Million verified businesses
Males: 1,078
(53.7%)
Females: 930
(46.3%)
For population 25 years and over in 15942:
High school or higher: 95.7%
Bachelor's degree or higher: 34.3%
Graduate or professional degree: 9.0%
Unemployed: 1.5%
Mean travel time to work (commute): 27.1 minutes
For population 15 years and over in 15942:
Never married: 25.9%
Now married: 63.1%
Separated: 2.7%
Widowed: 3.6%
Divorced: 4.7%
Zip code 15942 compared to state average:
Unemployed percentage below state average.
Black race population percentage significantly below state average.
Hispanic race population percentage significantly below state average.
Foreign-born population percentage significantly below state average.
Renting percentage significantly below state average.
Length of stay since moving in above state average.
Estimated median house/condo value in 2022: $178,319
15942:
$178,319
Pennsylvania:
$245,500
According to our research of Pennsylvania and other state lists, there were 2 registered sex offenders living in 15942 zip code as of May 24, 2024. The ratio of all residents to sex offenders in zip code 15942 is 1,114 to 1. The ratio of registered sex offenders to all residents in this zip code is lower than the state average.
Median resident age:
This zip code:
44.7 years
Pennsylvania median age:
40.9 years
Average household size:
This zip code:
2.7 people
Pennsylvania:
2.4 people
Averages for the 2020 tax year for zip code 15942, filed in 2021:
Average Adjusted Gross Income (AGI) in 2020: $59,118 (Individual Income Tax Returns)
Here:
$59,118
State:
$75,707
Salary/wage: $55,543 (reported on 76.8% of returns)
Here:
$55,543
State:
$62,806
(% of AGI for various income ranges: 911.1% for AGIs below $25k, 2926.0% for AGIs $25k-50k, 6176.9% for AGIs $50k-75k, 8497.8% for AGIs $75k-100k, 14179.0% for AGIs $100k-200k)
Taxable interest for individuals: $679 (reported on 39.4% of returns)
This zip code:
$679
Pennsylvania:
$1,633
(% of AGI for various income ranges: 33.7% for AGIs below $25k, 25.5% for AGIs $25k-50k, 16.9% for AGIs $50k-75k, 58.9% for AGIs $75k-100k, 75.0% for AGIs $100k-200k)
Ordinary dividends: $2,172 (reported on 18.2% of returns)
Here:
$2,172
State:
$7,382
(% of AGI for various income ranges: 14.2% for AGIs below $25k, 21.5% for AGIs $25k-50k, 10.0% for AGIs $50k-75k, 84.4% for AGIs $75k-100k, 232.0% for AGIs $100k-200k)
Net capital gain/loss in AGI: +$3,187 (reported on 15.2% of returns)
Here:
+$3,187
State:
+$23,522
(% of AGI for various income ranges: 10.0% for AGIs below $25k, 10.5% for AGIs $25k-50k, 83.1% for AGIs $50k-75k, 330.0% for AGIs $100k-200k)
Profit/loss from business: +$8,250 (reported on 8.1% of returns)
Here:
+$8,250
State:
+$16,274
(% of AGI for various income ranges: 36.8% for AGIs below $25k, 157.0% for AGIs $25k-50k, 306.7% for AGIs $75k-100k)
Taxable individual retirement arrangement distribution: $11,500 (reported on 13.1% of returns)
15942:
$11,500
Pennsylvania:
$18,583
(% of AGI for various income ranges: 115.8% for AGIs below $25k, 147.5% for AGIs $25k-50k, 404.6% for AGIs $50k-75k, 454.0% for AGIs $100k-200k)
Earned income credit: $2,238 (reported on 8.1% of returns)
Here:
$2,238
State:
$2,100
(% of AGI for various income ranges: 50.0% for AGIs below $25k, 42.0% for AGIs $25k-50k)
Percentage of individuals using paid preparers for their 2020 taxes: 94.9%
Here:
95%
State:
92%
(% for various income ranges: 93.3% for AGIs below $25k, 95.8% for AGIs $25k-50k, 100.0% for AGIs $50k-75k, 91.7% for AGIs $75k-100k, 92.9% for AGIs $100k-200k, 100.0% for AGIs over 200k)
Averages for the 2012 tax year for zip code 15942, filed in 2013:
Average Adjusted Gross Income (AGI) in 2012: $44,991 (Individual Income Tax Returns)
Here:
$44,991
State:
$61,346
Salary/wage: $43,740 (reported on 80.2% of returns)
Here:
$43,740
State:
$51,902
(% of AGI for various income ranges: 68.9% for AGIs below $25k, 71.8% for AGIs $25k-50k, 81.1% for AGIs $50k-75k, 79.1% for AGIs $75k-100k, 82.6% for AGIs $100k-200k)
Taxable interest for individuals: $557 (reported on 41.6% of returns)
This zip code:
$557
Pennsylvania:
$1,588
(% of AGI for various income ranges: 1.6% for AGIs below $25k, 0.8% for AGIs $25k-50k, 0.3% for AGIs $50k-75k, 0.3% for AGIs $75k-100k, 0.2% for AGIs $100k-200k)
Ordinary dividends: $1,705 (reported on 21.8% of returns)
Here:
$1,705
State:
$5,827
(% of AGI for various income ranges: 1.7% for AGIs below $25k, 0.6% for AGIs $25k-50k, 1.0% for AGIs $50k-75k, 0.8% for AGIs $75k-100k, 0.5% for AGIs $100k-200k)
Net capital gain/loss in AGI: +$20 (reported on 9.9% of returns)
Here:
+$20
State:
+$14,495
(% of AGI for various income ranges: 0.2% for AGIs $25k-50k, 0.2% for AGIs $75k-100k)
Profit/loss from business: +$10,150 (reported on 9.9% of returns)
Here:
+$10,150
State:
+$16,268
(% of AGI for various income ranges: 2.2% for AGIs below $25k, 3.0% for AGIs $25k-50k, 1.2% for AGIs $50k-75k, 5.8% for AGIs $75k-100k)
Taxable individual retirement arrangement distribution: $9,042 (reported on 11.9% of returns)
15942:
$9,042
Pennsylvania:
$14,550
(% of AGI for various income ranges: 5.2% for AGIs below $25k, 3.6% for AGIs $25k-50k, 5.7% for AGIs $75k-100k)
Total itemized deductions: $15,659 (18% of AGI, reported on 16.8% of returns)
Here:
$15,659
State:
$23,538
Here:
17.7% of AGI
State:
18.4% of AGI
(% of AGI for various income ranges: 5.0% for AGIs $25k-50k, 5.0% for AGIs $50k-75k, 6.2% for AGIs $75k-100k, 9.0% for AGIs $100k-200k)
Charity contributions: $2,208 (reported on 12.9% of returns)
Here:
$2,208
State:
$4,025
(% of AGI for various income ranges: 0.6% for AGIs $50k-75k, 0.7% for AGIs $75k-100k, 1.3% for AGIs $100k-200k)
Taxes paid: $6,006 (reported on 16.8% of returns)
15942:
$6,006
State:
$9,982
(% of AGI for various income ranges: 1.1% for AGIs $25k-50k, 1.5% for AGIs $50k-75k, 2.2% for AGIs $75k-100k, 4.6% for AGIs $100k-200k)
Earned income credit: $1,750 (reported on 11.9% of returns)
Here:
$1,750
State:
$2,106
(% of AGI for various income ranges: 3.4% for AGIs below $25k, 0.6% for AGIs $25k-50k)
Percentage of individuals using paid preparers for their 2012 taxes: 55.4%
Here:
55%
State:
53%
(% for various income ranges: 52.5% for AGIs below $25k, 53.8% for AGIs $25k-50k, 56.2% for AGIs $50k-75k, 60.0% for AGIs $75k-100k, 66.7% for AGIs $100k-200k)
Averages for the 2004 tax year for zip code 15942, filed in 2005:
Average Adjusted Gross Income (AGI) in 2004: $34,333 (Individual Income Tax Returns)
Here:
$34,333
State:
$48,049
Salary/wage: $33,686 (reported on 82.5% of returns)
Here:
$33,686
State:
$42,646
(% of AGI for various income ranges: 78.5% for AGIs below $10k, 63.6% for AGIs $10k-25k, 82.9% for AGIs $25k-50k, 83.7% for AGIs $50k-75k, 85.5% for AGIs $75k-100k, 83.4% for AGIs over 100k)
Taxable interest for individuals: $1,128 (reported on 49.6% of returns)
This zip code:
$1,128
Pennsylvania:
$1,657
(% of AGI for various income ranges: 4.6% for AGIs below $10k, 4.4% for AGIs $10k-25k, 0.9% for AGIs $25k-50k, 1.3% for AGIs $50k-75k, 0.2% for AGIs $75k-100k, 2.1% for AGIs over 100k)
Taxable dividends: $893 (reported on 21.6% of returns)
Here:
$893
State:
$3,566
(% of AGI for various income ranges: 0.5% for AGIs below $10k, 1.8% for AGIs $10k-25k, 0.3% for AGIs $25k-50k, 0.5% for AGIs $50k-75k, 0.1% for AGIs $75k-100k, 0.4% for AGIs over 100k)
Net capital gain/loss: +$973 (reported on 14.0% of returns)
Here:
+$973
State:
+$9,716
(% of AGI for various income ranges: -2.6% for AGIs below $10k, 0.1% for AGIs $10k-25k, -0.1% for AGIs $25k-50k, 1.1% for AGIs $50k-75k, 1.0% for AGIs over 100k)
Profit/loss from business: +$5,593 (reported on 11.3% of returns)
Here:
+$5,593
State:
+$14,267
(% of AGI for various income ranges: 6.1% for AGIs below $10k, 3.6% for AGIs $10k-25k, 1.9% for AGIs $25k-50k, 2.2% for AGIs $50k-75k)
IRA payment deduction: $3,000 (reported on 3.0% of returns)
15942:
$3,000
Pennsylvania:
$2,903
Total itemized deductions: $13,073 (18% of AGI, reported on 14.5% of returns)
Here:
$13,073
State:
$18,804
Here:
18.5% of AGI
State:
19.5% of AGI
(% of AGI for various income ranges: 3.1% for AGIs $10k-25k, 3.8% for AGIs $25k-50k, 6.2% for AGIs $50k-75k, 8.7% for AGIs $75k-100k, 7.8% for AGIs over 100k)
Charity contributions deductions: $2,296 (3% of AGI, reported on 12.0% of returns)
Here:
$2,296
State:
$3,337
Here:
3.0% of AGI
State:
3.3% of AGI
(% of AGI for various income ranges: 0.4% for AGIs $10k-25k, 0.2% for AGIs $25k-50k, 0.8% for AGIs $50k-75k, 1.1% for AGIs $75k-100k, 2.3% for AGIs over 100k)
Total tax: $4,110 (reported on 72.2% of returns)
15942:
$4,110
State:
$8,008
(% of AGI for various income ranges: 1.7% for AGIs below $10k, 3.7% for AGIs $10k-25k, 6.8% for AGIs $25k-50k, 8.3% for AGIs $50k-75k, 10.9% for AGIs $75k-100k, 17.6% for AGIs over 100k)
Earned income credit: $1,427 (reported on 12.6% of returns)
Here:
$1,427
State:
$1,643
Percentage of individuals using paid preparers for their 2004 taxes: 58.8%
Here:
59%
State:
56%
(% for various income ranges: 53.7% for AGIs below $10k, 56.8% for AGIs $10k-25k, 63.5% for AGIs $25k-50k, 56.8% for AGIs $50k-75k, 62.5% for AGIs $75k-100k, 80.0% for AGIs over 100k)
Household received Food Stamps/SNAP in the past 12 months: 104 Household did not receive Food Stamps/SNAP in the past 12 months: 640
Women who had a birth in the past 12 months: 8 (8 now married, 0 unmarried) Women who did not have a birth in the past 12 months: 405 (200 now married, 203 unmarried)
Housing units in zip code 15942 with a mortgage: 325 (41 second mortgage, 41 both second mortgage and home equity loan) Houses without a mortgage: 35
Median monthly owner costs for units with a mortgage: $1,323 Median monthly owner costs for units without a mortgage: $539
Residents with income below the poverty level in 2022:
This zip code:
5.8%
Whole state:
11.8%
Residents with income below 50% of the poverty level in 2022:
This zip code:
5.2%
Whole state:
6.1%
Median number of rooms in houses and condos:
Here:
6.9
State:
6.8
Median number of rooms in apartments:
Here:
6.5
State:
4.3
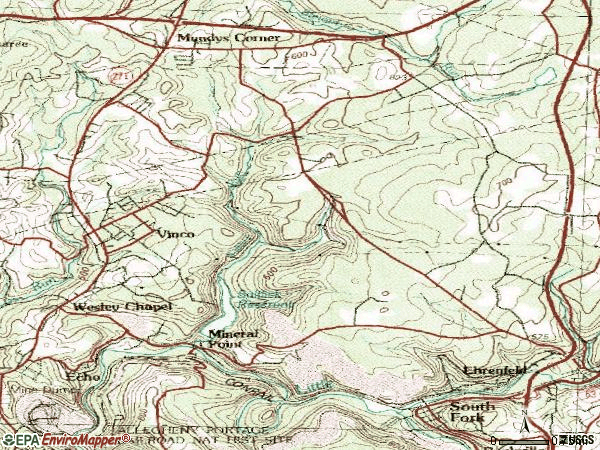
Notable locations in this zip code not listed on our city pages
In group quarters: 1 (-1 institutionalized population)
Size of family households: 256 2-persons, 140 3-persons, 114 4-persons, 73 5-persons
Size of nonfamily households: 123 1-person, 26 2-persons, 4 5-persons
331 married couples with children.
84 single-parent households (24 men, 60 women).
98.9% of residents of 15942 zip code speak English at home.
0.6% of residents speak other Indo-European language at home (100% very well).
Foreign born population: 0 (0.0%)
:
0.0%
Whole state:
7.5%
25%German
15%European
13%American
7%English
5%Irish
3%Italian
3%Slovak
Facilities with environmental interests located in this zip code:
AMFIRE MINING CO/MADISON DEEP MINE (210 HOLLOW LN in MINERAL POINT, PA)
AIR MINOR (AIRS/AFS) Business SIC classification: COAL MINING SERVICES
Housing units lacking complete plumbing facilities: 3.6% Housing units lacking complete kitchen facilities: 3.7%
45.6%Fuel oil, kerosene, etc.
26.0%Utility gas
15.7%Electricity
6.2%Coal or coke
4.1%Wood
1.5%Other fuel
1.4%Bottled, tank, or LP gas
Population in 1990: 420. Population change in the 1990s: +1,635 (+389.3%).
Place of birth for U.S.-born residents:
This state: 1,854
Northeast: 58
Midwest: 44
South: 25
West: 7
81% of the 15942 zip code residents lived in the same house 5 years ago. Out of people who lived in different houses, 86% lived in this county. Out of people who lived in different counties, 50% lived in Pennsylvania.
99% of the 15942 zip code residents lived in the same house 1 year ago. Out of people who lived in different houses, 71% moved from this county. Out of people who lived in different houses, 52% moved from different county within same state.
Private vs. public school enrollment:
Students in private schools in grades 1 to 8 (elementary and middle school): 21
Here:
10.4%
Pennsylvania:
15.7%
Students in private schools in grades 9 to 12 (high school): 47
Here:
46.8%
Pennsylvania:
13.4%
Students in private undergraduate colleges: 10
Here:
61.5%
Pennsylvania:
39.8%
Occupation by median earnings in the past 12 months ($)
78,348Law enforcement workers including supervisors
66,955Education, training, and library occupations
58,966Transportation occupations
57,433Business and financial operations occupations
56,213Health diagnosing and treating practitioners and other technical occupations
53,712Community and social service occupations
Companies with federal contracts located in this zip code:
CHARLES J MERLO INC (234 MERLOROAD in MINERAL POINT, PA; small business) : $7,513,064 in 35 contractsfrom 2002 to 2005
Contracts for Construction of Structures and Facilities -- Other Conservation and Development Facilities, Maintenance, Repair or Alteration of Real Property -- Other Conservation and Development Facilities by U.S. Army Corps of Engineers - civil program financing only, Army Signed by year:2000: $0; 2001: $0; 2002: $55,000; 2003: $3,775,180; 2004: $2,571,520; 2005: $1,111,364; 2006: $0.
Biggest contracts:
$1,000,000 with U.S. Army Corps of Engineers - civil program financing only for Construction of Structures and Facilities -- Other Conservation and Development Facilities. Signed on 2003-05-15. Completion date: 2004-07-21.
$555,682 with Army for Construction of Structures and Facilities -- Other Conservation and Development Facilities. Signed on 2005-04-29. Completion date: 2004-07-21.
$555,682 with U.S. Army Corps of Engineers - civil program financing only for Construction of Structures and Facilities -- Other Conservation and Development Facilities. Signed on 2005-04-29. Completion date: 2004-07-21.
$500,000, same as above.Signed on 2003-07-25. Completion date: 2004-07-21.
Top industries in this zip code by the number of employees in 2005:
Construction: Highway, Street, and Bridge Construction (50-99 employees: 1 establishment)
Information: Motion Picture and Video Production (10-19: 1)
Construction: New Single-Family Housing Construction (except Operative Builders) (5-9: 1, 1-4: 1)
Other Services (except Public Administration): Religious Organizations (5-9: 1, 1-4: 1)
Accommodation and Food Services: Limited-Service Restaurants (5-9: 1)
Construction: Residential Remodelers (1-4: 2)
Real Estate and Rental and Leasing: All Other Consumer Goods Rental (1-4: 1)
Other Services (except Public Administration): Labor Unions and Similar Labor Organizations (1-4: 1)
People in group quarters in 2000:
3 people in homes for the mentally retarded
Fatal accident statistics in 2014:
Fatal accident count: 2
Vehicles involved in fatal accidents: 2
Fatal accidents caused by drunken drivers: 1
Fatalities: 2
Persons involved in fatal accidents: 2
Pedestrians involved in fatal accidents: 0
Home Mortgage Disclosure Act Aggregated Statistics For Year 2009 (Based on 8 partial tracts)
A) FHA, FSA/RHS & VA Home Purchase Loans
B) Conventional Home Purchase Loans
C) Refinancings
D) Home Improvement Loans
F) Non-occupant Loans on < 5 Family Dwellings (A B C & D)
G) Loans On Manufactured Home Dwelling (A B C & D)
Number
Average Value
Number
Average Value
Number
Average Value
Number
Average Value
Number
Average Value
Number
Average Value
LOANS ORIGINATED
16
$95,345
21
$88,639
68
$93,806
34
$28,968
4
$38,772
3
$42,763
APPLICATIONS APPROVED, NOT ACCEPTED
1
$78,490
2
$140,350
7
$107,323
3
$7,903
0
$0
2
$27,855
APPLICATIONS DENIED
1
$143,940
7
$65,191
32
$89,077
10
$26,161
1
$69,940
2
$46,005
APPLICATIONS WITHDRAWN
1
$135,510
2
$173,790
14
$113,104
2
$31,830
1
$108,820
0
$0
FILES CLOSED FOR INCOMPLETENESS
0
$0
1
$103,890
1
$106,930
0
$0
0
$0
0
$0
Aggregated Statistics For Year 2008 (Based on 8 partial tracts)
A) FHA, FSA/RHS & VA Home Purchase Loans
B) Conventional Home Purchase Loans
C) Refinancings
D) Home Improvement Loans
F) Non-occupant Loans on < 5 Family Dwellings (A B C & D)
G) Loans On Manufactured Home Dwelling (A B C & D)
Number
Average Value
Number
Average Value
Number
Average Value
Number
Average Value
Number
Average Value
Number
Average Value
LOANS ORIGINATED
13
$77,175
27
$82,931
55
$75,097
43
$22,703
8
$50,486
3
$55,303
APPLICATIONS APPROVED, NOT ACCEPTED
0
$0
2
$103,020
5
$52,668
2
$39,955
0
$0
2
$63,050
APPLICATIONS DENIED
2
$97,450
7
$74,120
50
$86,085
25
$41,328
3
$26,610
7
$55,109
APPLICATIONS WITHDRAWN
1
$69,640
2
$134,870
14
$101,972
3
$64,070
0
$0
1
$84,670
FILES CLOSED FOR INCOMPLETENESS
0
$0
2
$37,715
3
$92,817
0
$0
0
$0
0
$0
Aggregated Statistics For Year 2007 (Based on 8 partial tracts)
A) FHA, FSA/RHS & VA Home Purchase Loans
B) Conventional Home Purchase Loans
C) Refinancings
D) Home Improvement Loans
F) Non-occupant Loans on < 5 Family Dwellings (A B C & D)
G) Loans On Manufactured Home Dwelling (A B C & D)
Number
Average Value
Number
Average Value
Number
Average Value
Number
Average Value
Number
Average Value
Number
Average Value
LOANS ORIGINATED
12
$78,210
39
$78,609
55
$70,794
40
$29,651
6
$49,988
4
$51,010
APPLICATIONS APPROVED, NOT ACCEPTED
2
$43,675
3
$88,913
13
$60,017
2
$14,645
1
$104,830
2
$71,780
APPLICATIONS DENIED
1
$68,710
11
$58,276
58
$75,422
21
$26,185
4
$36,638
5
$40,508
APPLICATIONS WITHDRAWN
1
$57,660
4
$74,108
18
$78,638
2
$18,375
2
$94,600
1
$62,170
FILES CLOSED FOR INCOMPLETENESS
1
$42,960
0
$0
1
$72,820
1
$13,720
0
$0
0
$0
Aggregated Statistics For Year 2006 (Based on 8 partial tracts)
A) FHA, FSA/RHS & VA Home Purchase Loans
B) Conventional Home Purchase Loans
C) Refinancings
D) Home Improvement Loans
F) Non-occupant Loans on < 5 Family Dwellings (A B C & D)
G) Loans On Manufactured Home Dwelling (A B C & D)
Number
Average Value
Number
Average Value
Number
Average Value
Number
Average Value
Number
Average Value
Number
Average Value
LOANS ORIGINATED
11
$89,952
34
$77,832
60
$65,996
49
$25,206
4
$54,600
9
$54,397
APPLICATIONS APPROVED, NOT ACCEPTED
1
$24,750
3
$86,403
11
$66,296
6
$33,993
1
$52,470
1
$97,320
APPLICATIONS DENIED
1
$66,820
11
$67,810
80
$76,355
24
$33,903
3
$54,270
6
$53,500
APPLICATIONS WITHDRAWN
0
$0
7
$91,544
33
$86,216
2
$21,985
1
$82,580
1
$41,720
FILES CLOSED FOR INCOMPLETENESS
0
$0
1
$48,680
7
$104,881
1
$53,720
1
$54,540
0
$0
Aggregated Statistics For Year 2005 (Based on 8 partial tracts)
A) FHA, FSA/RHS & VA Home Purchase Loans
B) Conventional Home Purchase Loans
C) Refinancings
D) Home Improvement Loans
F) Non-occupant Loans on < 5 Family Dwellings (A B C & D)
G) Loans On Manufactured Home Dwelling (A B C & D)
Number
Average Value
Number
Average Value
Number
Average Value
Number
Average Value
Number
Average Value
Number
Average Value
LOANS ORIGINATED
6
$65,403
39
$79,086
74
$71,025
55
$26,556
6
$44,638
7
$43,786
APPLICATIONS APPROVED, NOT ACCEPTED
0
$0
4
$46,422
18
$66,016
5
$26,220
1
$39,890
3
$42,850
APPLICATIONS DENIED
0
$0
5
$59,954
79
$73,340
18
$27,791
2
$48,405
7
$61,220
APPLICATIONS WITHDRAWN
1
$34,520
6
$71,840
42
$86,204
6
$69,878
1
$76,020
1
$32,720
FILES CLOSED FOR INCOMPLETENESS
0
$0
1
$90,930
9
$77,562
0
$0
0
$0
0
$0
Aggregated Statistics For Year 2004 (Based on 8 partial tracts)
A) FHA, FSA/RHS & VA Home Purchase Loans
B) Conventional Home Purchase Loans
C) Refinancings
D) Home Improvement Loans
F) Non-occupant Loans on < 5 Family Dwellings (A B C & D)
G) Loans On Manufactured Home Dwelling (A B C & D)
Number
Average Value
Number
Average Value
Number
Average Value
Number
Average Value
Number
Average Value
Number
Average Value
LOANS ORIGINATED
5
$66,036
42
$78,280
86
$60,924
57
$26,543
7
$42,631
5
$26,702
APPLICATIONS APPROVED, NOT ACCEPTED
0
$0
4
$71,058
17
$54,572
7
$31,953
0
$0
3
$33,210
APPLICATIONS DENIED
1
$39,210
10
$47,380
63
$70,787
20
$34,716
5
$29,996
7
$51,036
APPLICATIONS WITHDRAWN
0
$0
4
$102,722
48
$76,826
7
$40,347
2
$75,215
1
$62,930
FILES CLOSED FOR INCOMPLETENESS
0
$0
0
$0
11
$89,996
1
$40,550
0
$0
0
$0
Aggregated Statistics For Year 2003 (Based on 8 partial tracts)
A) FHA, FSA/RHS & VA Home Purchase Loans
B) Conventional Home Purchase Loans
C) Refinancings
D) Home Improvement Loans
F) Non-occupant Loans on < 5 Family Dwellings (A B C & D)
Number
Average Value
Number
Average Value
Number
Average Value
Number
Average Value
Number
Average Value
LOANS ORIGINATED
6
$75,278
35
$80,153
158
$64,241
53
$25,513
5
$38,390
APPLICATIONS APPROVED, NOT ACCEPTED
0
$0
2
$58,370
29
$65,601
5
$43,422
0
$0
APPLICATIONS DENIED
0
$0
10
$41,285
69
$67,043
15
$19,120
3
$20,647
APPLICATIONS WITHDRAWN
1
$26,520
4
$82,855
43
$72,803
3
$23,643
0
$0
FILES CLOSED FOR INCOMPLETENESS
0
$0
1
$83,480
2
$74,135
1
$57,260
0
$0
Aggregated Statistics For Year 2002 (Based on 8 partial tracts)
A) FHA, FSA/RHS & VA Home Purchase Loans
B) Conventional Home Purchase Loans
C) Refinancings
D) Home Improvement Loans
F) Non-occupant Loans on < 5 Family Dwellings (A B C & D)
Number
Average Value
Number
Average Value
Number
Average Value
Number
Average Value
Number
Average Value
LOANS ORIGINATED
11
$74,925
34
$483,124
106
$189,097
41
$18,201
5
$2,678,676
APPLICATIONS APPROVED, NOT ACCEPTED
0
$0
1
$25,440
20
$71,408
3
$17,617
0
$0
APPLICATIONS DENIED
2
$61,555
9
$29,234
60
$60,042
14
$15,713
1
$8,180
APPLICATIONS WITHDRAWN
1
$27,436,060
4
$54,702
36
$57,089
2
$22,780
0
$0
FILES CLOSED FOR INCOMPLETENESS
0
$0
0
$0
11
$76,652
0
$0
0
$0
Aggregated Statistics For Year 2001 (Based on 8 partial tracts)
A) FHA, FSA/RHS & VA Home Purchase Loans
B) Conventional Home Purchase Loans
C) Refinancings
D) Home Improvement Loans
F) Non-occupant Loans on < 5 Family Dwellings (A B C & D)
Number
Average Value
Number
Average Value
Number
Average Value
Number
Average Value
Number
Average Value
LOANS ORIGINATED
9
$49,971
35
$63,872
92
$56,676
63
$18,805
6
$31,982
APPLICATIONS APPROVED, NOT ACCEPTED
0
$0
2
$39,215
18
$57,211
6
$27,278
1
$124,340
APPLICATIONS DENIED
0
$0
12
$36,422
56
$52,676
17
$15,698
1
$25,770
APPLICATIONS WITHDRAWN
0
$0
2
$95,225
29
$63,193
5
$12,496
0
$0
FILES CLOSED FOR INCOMPLETENESS
0
$0
0
$0
9
$55,761
1
$21,840
0
$0
Aggregated Statistics For Year 2000 (Based on 8 partial tracts)
A) FHA, FSA/RHS & VA Home Purchase Loans
B) Conventional Home Purchase Loans
C) Refinancings
D) Home Improvement Loans
F) Non-occupant Loans on < 5 Family Dwellings (A B C & D)
Number
Average Value
Number
Average Value
Number
Average Value
Number
Average Value
Number
Average Value
LOANS ORIGINATED
10
$69,423
31
$54,514
36
$46,019
60
$14,012
3
$22,423
APPLICATIONS APPROVED, NOT ACCEPTED
0
$0
3
$45,980
15
$58,046
6
$31,425
0
$0
APPLICATIONS DENIED
1
$38,000
18
$43,357
44
$48,120
17
$12,548
3
$28,437
APPLICATIONS WITHDRAWN
0
$0
2
$82,945
14
$42,959
5
$21,514
0
$0
FILES CLOSED FOR INCOMPLETENESS
0
$0
0
$0
5
$88,886
1
$30,630
0
$0
Aggregated Statistics For Year 1999 (Based on 4 partial tracts)
A) FHA, FSA/RHS & VA Home Purchase Loans
B) Conventional Home Purchase Loans
C) Refinancings
D) Home Improvement Loans
F) Non-occupant Loans on < 5 Family Dwellings (A B C & D)


 Nearest zip codes: 15956, 15909, 15945, 15951, 15943, 15958.