Estimated zip code population in 2022: 1,412 Zip code population in 2010: 1,042 Zip code population in 2000: 1,353
Houses and condos: 1,784 Renter-occupied apartments: 70
% of renters here:
11%
State:
35%
March 2022 cost of living index in zip code 08738: 123.5 (high, U.S. average is 100)
Land area: 1.0 sq. mi. Water area: 2.3 sq. mi.
Population density: 1,422 people per square mile
(low).
OSM Map
Google Map
MSN Map
OSM Map
General Map
Google Map
MSN Map
OSM Map
Google Map
MSN Map
OSM Map
Google Map
MSN Map
Please wait while loading the map...
Real estate property taxes paid for housing units in 2022:
This zip code:
0.6% ($9,521)
New Jersey:
2.1% ($8,897)
Median real estate property taxes paid for housing units with mortgages in 2022: $9,557 (0.7%) Median real estate property taxes paid for housing units with no mortgage in 2022: $9,483 (0.6%)
Business Search- 14 Million verified businesses
Males: 673
(47.6%)
Females: 739
(52.4%)
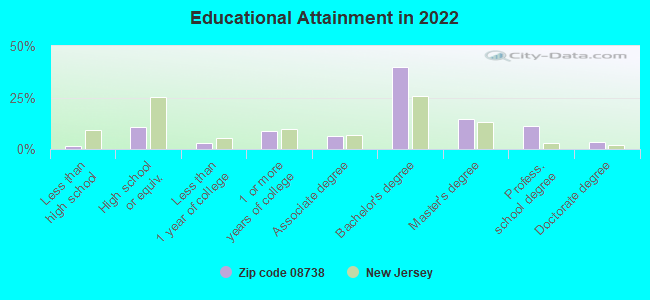
For population 25 years and over in 08738:
High school or higher: 99.3%
Bachelor's degree or higher: 70.0%
Graduate or professional degree: 29.8%
Unemployed: 4.6%
Mean travel time to work (commute): 40.8 minutes
For population 15 years and over in 08738:
Never married: 20.8%
Now married: 66.1%
Separated: 0.5%
Widowed: 4.1%
Divorced: 8.5%
Zip code 08738 compared to state average:
Median household income above state average.
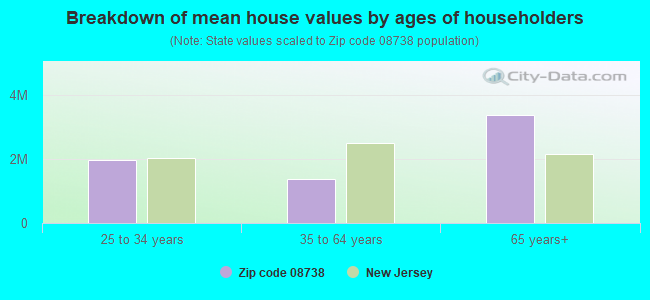
Median house value significantly above state average.
Black race population percentage significantly below state average.
Hispanic race population percentage significantly below state average.
Median age significantly above state average.
Foreign-born population percentage significantly below state average.
Renting percentage significantly below state average.
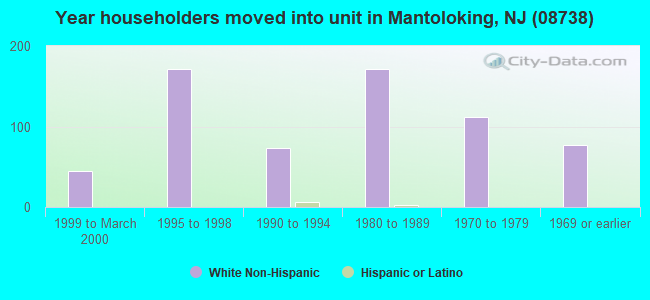
Length of stay since moving in significantly below state average.
Number of rooms per house above state average.
House age below state average.
Percentage of population with a bachelor's degree or higher above state average.
Estimated median house/condo value in 2022: $1,519,849
08738:
$1,519,849
New Jersey:
$428,900
Median resident age:
This zip code:
57.8 years
New Jersey median age:
40.4 years
Average household size:
This zip code:
2.3 people
New Jersey:
2.6 people
Averages for the 2020 tax year for zip code 08738, filed in 2021:
Average Adjusted Gross Income (AGI) in 2020: $303,656 (Individual Income Tax Returns)
Here:
$303,656
State:
$95,247
Salary/wage: $198,484 (reported on 67.3% of returns)
Here:
$198,484
State:
$80,635
(% of AGI for various income ranges: 1320.0% for AGIs below $25k, 4796.7% for AGIs $25k-50k, 9760.0% for AGIs $50k-75k, 7913.3% for AGIs $75k-100k, 16517.5% for AGIs $100k-200k, 202236.7% for AGIs over 200k)
Taxable interest for individuals: $5,739 (reported on 69.1% of returns)
This zip code:
$5,739
New Jersey:
$2,414
(% of AGI for various income ranges: 56.7% for AGIs below $25k, 120.0% for AGIs $25k-50k, 685.0% for AGIs $50k-75k, 366.7% for AGIs $75k-100k, 727.5% for AGIs $100k-200k, 5300.0% for AGIs over 200k)
Ordinary dividends: $22,319 (reported on 67.3% of returns)
Here:
$22,319
State:
$8,057
(% of AGI for various income ranges: 253.3% for AGIs below $25k, 933.3% for AGIs $25k-50k, 1270.0% for AGIs $50k-75k, 1713.3% for AGIs $75k-100k, 3452.5% for AGIs $100k-200k, 19176.7% for AGIs over 200k)
Net capital gain/loss in AGI: +$39,511 (reported on 65.5% of returns)
Here:
+$39,511
State:
+$25,022
(% of AGI for various income ranges: 130.0% for AGIs below $25k, 133.3% for AGIs $25k-50k, 1195.0% for AGIs $50k-75k, 773.3% for AGIs $75k-100k, 2505.0% for AGIs $100k-200k, 42240.0% for AGIs over 200k)
Profit/loss from business: +$70,810 (reported on 18.2% of returns)
Here:
+$70,810
State:
+$18,035
(% of AGI for various income ranges: 863.3% for AGIs $75k-100k, 22740.0% for AGIs over 200k)
Taxable individual retirement arrangement distribution: $35,409 (reported on 20.0% of returns)
08738:
$35,409
New Jersey:
$21,558
(% of AGI for various income ranges: 3375.0% for AGIs $50k-75k, 4062.5% for AGIs $100k-200k, 5316.7% for AGIs over 200k)
Total itemized deductions: $54,884 (reported on 34.5% of returns)
Here:
$54,884
State:
$32,863
(% of AGI for various income ranges: 1463.3% for AGIs below $25k, 3860.0% for AGIs $50k-75k, 3932.5% for AGIs $100k-200k, 25480.0% for AGIs over 200k)
Charity contributions: $13,618 (reported on 30.9% of returns)
Here:
$13,618
State:
$7,880
(% of AGI for various income ranges: 1090.0% for AGIs $50k-75k, 890.0% for AGIs $100k-200k, 5803.3% for AGIs over 200k)
Taxes paid: $9,674 (reported on 34.5% of returns)
08738:
$9,674
State:
$9,183
(% of AGI for various income ranges: 596.7% for AGIs below $25k, 1240.0% for AGIs $50k-75k, 1022.5% for AGIs $100k-200k, 3340.0% for AGIs over 200k)
Percentage of individuals using paid preparers for their 2020 taxes: 92.7%
Here:
93%
State:
92%
(% for various income ranges: 87.5% for AGIs below $25k, 85.7% for AGIs $25k-50k, 100.0% for AGIs $50k-75k, 100.0% for AGIs $75k-100k, 92.3% for AGIs $100k-200k, 93.8% for AGIs over 200k)
Averages for the 2012 tax year for zip code 08738, filed in 2013:
Average Adjusted Gross Income (AGI) in 2012: $206,485 (Individual Income Tax Returns)
Here:
$206,485
State:
$79,688
Salary/wage: $121,823 (reported on 56.4% of returns)
Here:
$121,823
State:
$68,122
(% of AGI for various income ranges: 35.6% for AGIs below $25k, 41.2% for AGIs $25k-50k, 75.4% for AGIs $50k-75k, 29.2% for AGIs $100k-200k, 33.8% for AGIs over 200k)
Taxable interest for individuals: $4,300 (reported on 76.9% of returns)
This zip code:
$4,300
New Jersey:
$2,193
(% of AGI for various income ranges: 6.9% for AGIs below $25k, 6.2% for AGIs $25k-50k, 1.2% for AGIs $50k-75k, 1.8% for AGIs $75k-100k, 2.0% for AGIs $100k-200k, 1.3% for AGIs over 200k)
Ordinary dividends: $16,400 (reported on 69.2% of returns)
Here:
$16,400
State:
$6,828
(% of AGI for various income ranges: 17.5% for AGIs below $25k, 10.2% for AGIs $25k-50k, 11.8% for AGIs $50k-75k, 7.9% for AGIs $75k-100k, 8.3% for AGIs $100k-200k, 4.1% for AGIs over 200k)
Net capital gain/loss in AGI: +$22,296 (reported on 61.5% of returns)
Here:
+$22,296
State:
+$15,358
(% of AGI for various income ranges: 3.9% for AGIs below $25k, 2.1% for AGIs $100k-200k, 8.8% for AGIs over 200k)
Profit/loss from business: +$50,500 (reported on 17.9% of returns)
Here:
+$50,500
State:
+$19,577
Taxable individual retirement arrangement distribution: $31,200 (reported on 38.5% of returns)
08738:
$31,200
New Jersey:
$18,214
(% of AGI for various income ranges: 22.3% for AGIs below $25k, 17.3% for AGIs $50k-75k, 15.0% for AGIs $100k-200k, 3.5% for AGIs over 200k)
Total itemized deductions: $136,460 (53% of AGI, reported on 76.9% of returns)
Here:
$136,460
State:
$30,827
Here:
52.6% of AGI
State:
21.2% of AGI
(% of AGI for various income ranges: 278.1% for AGIs below $25k, 101.8% for AGIs $25k-50k, 150.5% for AGIs $50k-75k, 107.7% for AGIs $75k-100k, 84.6% for AGIs $100k-200k, 30.3% for AGIs over 200k)
Charity contributions: $5,956 (reported on 69.2% of returns)
Here:
$5,956
State:
$3,451
(% of AGI for various income ranges: 3.6% for AGIs $25k-50k, 2.2% for AGIs $50k-75k, 2.3% for AGIs $75k-100k, 2.4% for AGIs $100k-200k, 1.9% for AGIs over 200k)
Taxes paid: $35,843 (reported on 76.9% of returns)
08738:
$35,843
State:
$15,801
(% of AGI for various income ranges: 50.0% for AGIs below $25k, 20.8% for AGIs $25k-50k, 18.1% for AGIs $50k-75k, 21.4% for AGIs $75k-100k, 16.1% for AGIs $100k-200k, 11.3% for AGIs over 200k)
Percentage of individuals using paid preparers for their 2012 taxes: 76.9%
Here:
77%
State:
65%
(% for various income ranges: 71.4% for AGIs below $25k, 80.0% for AGIs $25k-50k, 60.0% for AGIs $50k-75k, 75.0% for AGIs $75k-100k, 77.8% for AGIs $100k-200k, 88.9% for AGIs over 200k)
Averages for the 2004 tax year for zip code 08738, filed in 2005:
Average Adjusted Gross Income (AGI) in 2004: $169,641 (Individual Income Tax Returns)
Here:
$169,641
State:
$64,921
Salary/wage: $165,333 (reported on 58.2% of returns)
Here:
$165,333
State:
$57,755
(% of AGI for various income ranges: 230.6% for AGIs below $10k, 45.3% for AGIs $10k-25k, 42.5% for AGIs $25k-50k, 26.6% for AGIs $50k-75k, 44.8% for AGIs $75k-100k, 59.3% for AGIs over 100k)
Taxable interest for individuals: $6,388 (reported on 79.0% of returns)
This zip code:
$6,388
New Jersey:
$2,068
(% of AGI for various income ranges: 52.8% for AGIs below $10k, 7.7% for AGIs $10k-25k, 7.3% for AGIs $25k-50k, 5.6% for AGIs $50k-75k, 6.1% for AGIs $75k-100k, 2.4% for AGIs over 100k)
Taxable dividends: $12,799 (reported on 71.2% of returns)
Here:
$12,799
State:
$3,959
(% of AGI for various income ranges: 79.2% for AGIs below $10k, 15.3% for AGIs $10k-25k, 14.0% for AGIs $25k-50k, 10.4% for AGIs $50k-75k, 13.8% for AGIs $75k-100k, 4.1% for AGIs over 100k)
Net capital gain/loss: +$29,075 (reported on 63.0% of returns)
Here:
+$29,075
State:
+$13,591
(% of AGI for various income ranges: -73.6% for AGIs below $10k, -3.0% for AGIs $10k-25k, -1.9% for AGIs $25k-50k, 4.7% for AGIs $50k-75k, 0.2% for AGIs $75k-100k, 12.5% for AGIs over 100k)
Profit/loss from business: +$22,718 (reported on 19.9% of returns)
Here:
+$22,718
State:
+$17,520
(% of AGI for various income ranges: 111.1% for AGIs below $10k, 10.4% for AGIs $25k-50k, 13.9% for AGIs $50k-75k, 1.5% for AGIs $75k-100k, 1.8% for AGIs over 100k)
IRA payment deduction: $4,217 (reported on 4.2% of returns)
08738:
$4,217
New Jersey:
$3,270
Self-employed pension: $18,923 (reported on 2.4% of returns)
Here:
$18,923
New Jersey:
$17,258
Total itemized deductions: $43,528 (19% of AGI, reported on 71.4% of returns)
Here:
$43,528
State:
$23,924
Here:
19.1% of AGI
State:
21.1% of AGI
(% of AGI for various income ranges: 175.0% for AGIs below $10k, 74.2% for AGIs $10k-25k, 41.1% for AGIs $25k-50k, 30.3% for AGIs $50k-75k, 31.8% for AGIs $75k-100k, 15.2% for AGIs over 100k)
Charity contributions deductions: $5,345 (2% of AGI, reported on 68.3% of returns)
Here:
$5,345
State:
$3,242
Here:
2.3% of AGI
State:
2.7% of AGI
(% of AGI for various income ranges: 6.0% for AGIs $10k-25k, 4.2% for AGIs $25k-50k, 3.0% for AGIs $50k-75k, 3.7% for AGIs $75k-100k, 1.9% for AGIs over 100k)
Total tax: $44,024 (reported on 82.4% of returns)
08738:
$44,024
State:
$12,321
(% of AGI for various income ranges: 13.9% for AGIs below $10k, 3.7% for AGIs $10k-25k, 7.4% for AGIs $25k-50k, 10.5% for AGIs $50k-75k, 10.1% for AGIs $75k-100k, 23.3% for AGIs over 100k)
Earned income credit: $267 (reported on 2.7% of returns)
Here:
$267
State:
$1,711
Percentage of individuals using paid preparers for their 2004 taxes: 76.8%
Here:
77%
State:
65%
(% for various income ranges: 65.9% for AGIs below $10k, 67.2% for AGIs $10k-25k, 74.2% for AGIs $25k-50k, 81.0% for AGIs $50k-75k, 78.2% for AGIs $75k-100k, 84.1% for AGIs over 100k)
Household received Food Stamps/SNAP in the past 12 months: 0 Household did not receive Food Stamps/SNAP in the past 12 months: 601
Women who had a birth in the past 12 months: 13 (14 now married, 0 unmarried) Women who did not have a birth in the past 12 months: 193 (66 now married, 127 unmarried)
Housing units in zip code 08738 with a mortgage: 217 (20 second mortgage, 12 both second mortgage and home equity loan) Houses without a mortgage: 8
Median monthly owner costs for units with a mortgage: $3,744 Median monthly owner costs for units without a mortgage: $1,425
Residents with income below the poverty level in 2022:
This zip code:
1.6%
Whole state:
9.7%
Residents with income below 50% of the poverty level in 2022:
This zip code:
1.0%
Whole state:
5.2%
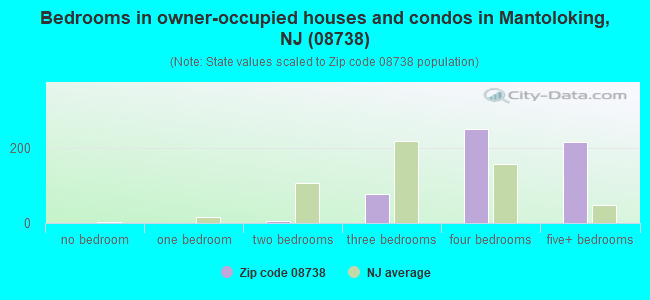
Median number of rooms in houses and condos:
Here:
8.0
State:
6.8
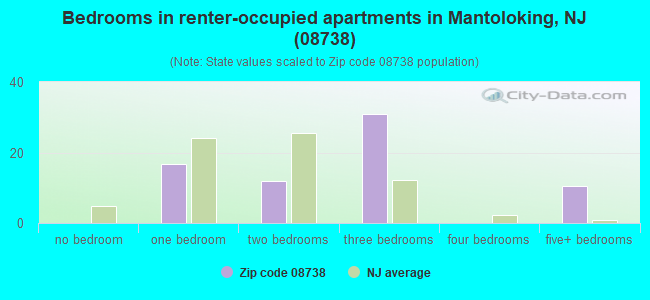
Median number of rooms in apartments:
Here:
4.8
State:
3.9
Notable locations in this zip code not listed on our city pages
Notable locations in zip code 08738: Brick Township Fire Department Pioneer Hose Fire Company Station 22 - 1 (A), Mantoloking Fire Company 1 Station 35 (B). Display/hide their locations on the map
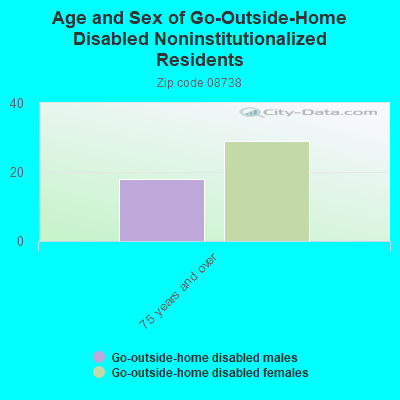
In group quarters: 8 (-1 institutionalized population)
Size of family households: 274 2-persons, 87 3-persons, 60 4-persons, 20 5-persons, 16 6-persons
Size of nonfamily households: 142 1-person, 6 2-persons
191 married couples with children.
8 single-parent households (5 men, 3 women).
93.5% of residents of 08738 zip code speak English at home.
0.9% of residents speak Spanish at home (83% very well, 17% not well).
0.3% of residents speak other Indo-European language at home (75% very well, 25% well).
4.7% of residents speak Asian or Pacific Island language at home (44% very well, 36% well, 20% not well).
1.0% of residents speak other language at home (100% very well).
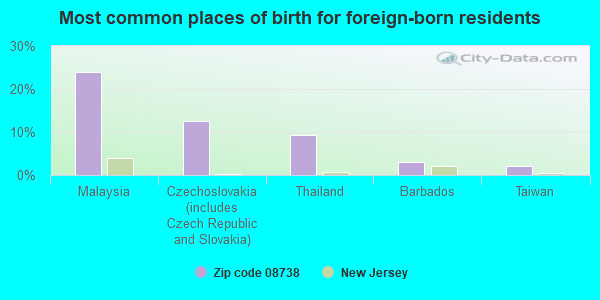
Foreign born population: 96 (6.8%) (56.0% of them are naturalized citizens)
This zip code:
6.8%
Whole state:
23.5%
24%Malaysia
12%Czechoslovakia (includes Czech Republic and Slovakia)
9%Thailand
3%Barbados
2%Taiwan
27%Italian
12%Irish
9%Polish
9%Portuguese
5%English
4%American
4%German
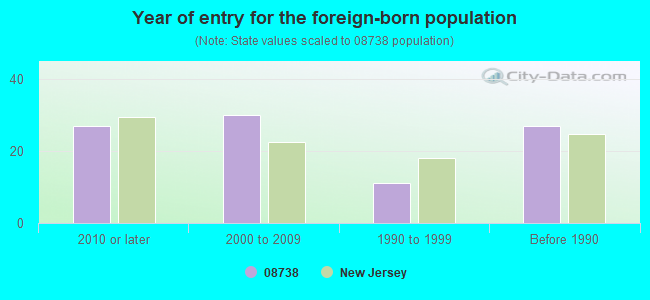
Year of entry for the foreign-born population
272010 or later
302000 to 2009
111990 to 1999
27Before 1990
Housing units lacking complete plumbing facilities: 0.1% Housing units lacking complete kitchen facilities: 0.4%
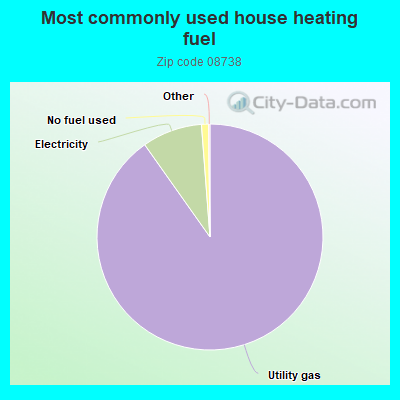
90.3%Utility gas
8.6%Electricity
1.0%No fuel used
Population in 1990: 1,186. Population change in the 1990s: +167 (+14.1%).
Place of birth for U.S.-born residents:
This state: 870
Northeast: 338
Midwest: 36
South: 48
West: 20
62% of the 08738 zip code residents lived in the same house 5 years ago. Out of people who lived in different houses, 15% lived in this county. Out of people who lived in different counties, 50% lived in New Jersey.
84% of the 08738 zip code residents lived in the same house 1 year ago. Out of people who lived in different houses, 16% moved from this county. Out of people who lived in different houses, 38% moved from different county within same state. Out of people who lived in different houses, 48% moved from different state.
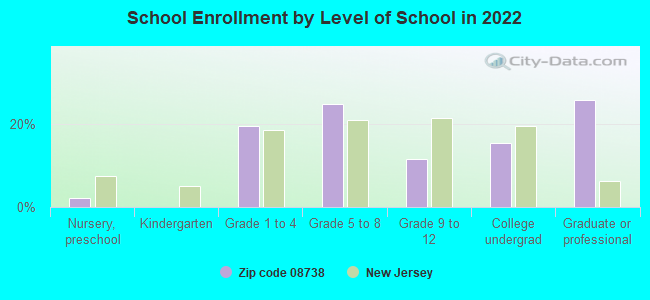
Private vs. public school enrollment:
Students in private schools in grades 1 to 8 (elementary and middle school): 54
Here:
44.6%
New Jersey:
12.3%
Students in private schools in grades 9 to 12 (high school): 16
Here:
52.9%
New Jersey:
13.1%
Students in private undergraduate colleges: 43
Here:
100.0%
New Jersey:
33.2%
Occupation by median earnings in the past 12 months ($)
206,650Management occupations
198,254Health diagnosing and treating practitioners and other technical occupations
182,256Computer and mathematical occupations
145,531Legal occupations
92,484Business and financial operations occupations
71,718Personal care and service occupations
Top industries in this zip code by the number of employees in 2005:
Construction: Commercial and Institutional Building Construction (5-9 employees: 1 establishment)
Other Services (except Public Administration): Beauty Salons (5-9: 1)
Other Services (except Public Administration): Religious Organizations (5-9: 1)
Real Estate and Rental and Leasing: Lessors of Residential Buildings and Dwellings (1-4: 2)
Arts, Entertainment, and Recreation: Fitness and Recreational Sports Centers (1-4: 2)
Arts, Entertainment, and Recreation: All Other Amusement and Recreation Industries (1-4: 2)
Finance and Insurance: Real Estate Credit (1-4: 1)
Real Estate and Rental and Leasing: Offices of Real Estate Agents and Brokers (1-4: 1)
People in group quarters in 2010:
5 people in group homes for juveniles (non-correctional)
4 people in workers' group living quarters and job corps centers
3 people in other noninstitutional facilities
People in group quarters in 2000:
5 people in other group homes
2 people in religious group quarters
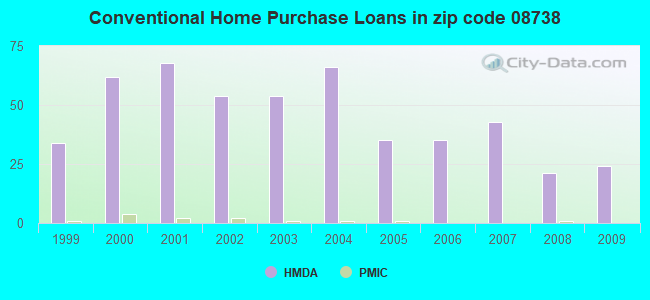
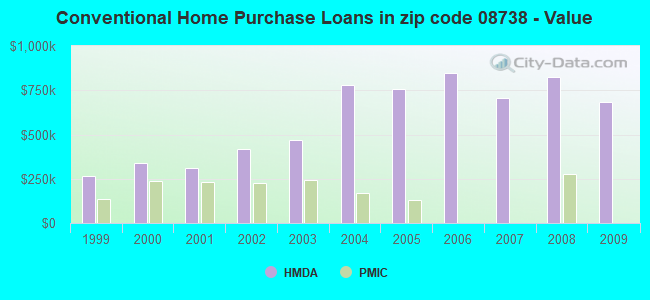
Home Mortgage Disclosure Act Aggregated Statistics For Year 2009 (Based on 6 partial tracts)
B) Conventional Home Purchase Loans
C) Refinancings
D) Home Improvement Loans
F) Non-occupant Loans on < 5 Family Dwellings (A B C & D)
Number
Average Value
Number
Average Value
Number
Average Value
Number
Average Value
LOANS ORIGINATED
24
$683,355
103
$491,771
7
$479,106
88
$558,958
APPLICATIONS APPROVED, NOT ACCEPTED
2
$632,735
9
$356,952
0
$0
6
$436,660
APPLICATIONS DENIED
3
$882,323
23
$708,436
1
$139,450
16
$793,911
APPLICATIONS WITHDRAWN
0
$0
12
$401,516
1
$286,310
7
$488,201
FILES CLOSED FOR INCOMPLETENESS
1
$1,145,910
8
$669,254
0
$0
6
$869,453
Aggregated Statistics For Year 2008 (Based on 6 partial tracts)
B) Conventional Home Purchase Loans
C) Refinancings
D) Home Improvement Loans
F) Non-occupant Loans on < 5 Family Dwellings (A B C & D)
Number
Average Value
Number
Average Value
Number
Average Value
Number
Average Value
LOANS ORIGINATED
21
$824,906
48
$566,287
4
$163,540
33
$808,736
APPLICATIONS APPROVED, NOT ACCEPTED
4
$1,045,483
12
$471,667
1
$528,770
9
$714,939
APPLICATIONS DENIED
7
$564,744
13
$775,076
2
$422,695
12
$815,596
APPLICATIONS WITHDRAWN
4
$774,910
6
$985,682
1
$968,040
5
$1,383,144
FILES CLOSED FOR INCOMPLETENESS
0
$0
1
$840,650
0
$0
1
$804,270
Aggregated Statistics For Year 2007 (Based on 6 partial tracts)
B) Conventional Home Purchase Loans
C) Refinancings
D) Home Improvement Loans
F) Non-occupant Loans on < 5 Family Dwellings (A B C & D)
Number
Average Value
Number
Average Value
Number
Average Value
Number
Average Value
LOANS ORIGINATED
43
$708,983
60
$566,051
8
$410,028
58
$713,025
APPLICATIONS APPROVED, NOT ACCEPTED
6
$612,618
16
$344,825
3
$218,750
12
$447,477
APPLICATIONS DENIED
8
$1,044,460
19
$876,075
3
$108,943
10
$1,091,583
APPLICATIONS WITHDRAWN
6
$948,825
11
$738,219
1
$38,340
8
$701,178
FILES CLOSED FOR INCOMPLETENESS
1
$533,110
6
$686,718
0
$0
2
$893,880
Aggregated Statistics For Year 2006 (Based on 6 partial tracts)
B) Conventional Home Purchase Loans
C) Refinancings
D) Home Improvement Loans
F) Non-occupant Loans on < 5 Family Dwellings (A B C & D)
Number
Average Value
Number
Average Value
Number
Average Value
Number
Average Value
LOANS ORIGINATED
35
$847,364
76
$550,848
8
$229,820
60
$738,034
APPLICATIONS APPROVED, NOT ACCEPTED
7
$638,380
12
$466,887
1
$17,150
7
$809,096
APPLICATIONS DENIED
7
$559,959
19
$515,322
3
$190,200
11
$602,148
APPLICATIONS WITHDRAWN
1
$1,411,460
10
$797,533
1
$143,790
2
$366,075
FILES CLOSED FOR INCOMPLETENESS
0
$0
6
$902,053
0
$0
2
$1,518,000
Aggregated Statistics For Year 2005 (Based on 6 partial tracts)
B) Conventional Home Purchase Loans
C) Refinancings
D) Home Improvement Loans
F) Non-occupant Loans on < 5 Family Dwellings (A B C & D)
Number
Average Value
Number
Average Value
Number
Average Value
Number
Average Value
LOANS ORIGINATED
35
$755,714
84
$503,973
7
$241,000
63
$667,714
APPLICATIONS APPROVED, NOT ACCEPTED
7
$708,169
13
$527,178
1
$214,990
11
$712,386
APPLICATIONS DENIED
12
$653,595
21
$565,143
3
$160,403
13
$635,573
APPLICATIONS WITHDRAWN
5
$879,876
19
$487,881
2
$428,280
7
$933,510
FILES CLOSED FOR INCOMPLETENESS
1
$955,160
5
$339,968
0
$0
3
$469,177
Aggregated Statistics For Year 2004 (Based on 6 partial tracts)
B) Conventional Home Purchase Loans
C) Refinancings
D) Home Improvement Loans
F) Non-occupant Loans on < 5 Family Dwellings (A B C & D)
Number
Average Value
Number
Average Value
Number
Average Value
Number
Average Value
LOANS ORIGINATED
66
$778,527
93
$472,242
10
$89,409
89
$629,656
APPLICATIONS APPROVED, NOT ACCEPTED
10
$803,783
9
$396,912
2
$63,370
10
$829,883
APPLICATIONS DENIED
7
$650,506
16
$420,670
5
$186,916
12
$581,879
APPLICATIONS WITHDRAWN
6
$635,842
17
$465,151
3
$148,087
8
$682,080
FILES CLOSED FOR INCOMPLETENESS
0
$0
7
$295,331
0
$0
2
$433,600
Aggregated Statistics For Year 2003 (Based on 6 partial tracts)
B) Conventional Home Purchase Loans
C) Refinancings
D) Home Improvement Loans
F) Non-occupant Loans on < 5 Family Dwellings (A B C & D)
Number
Average Value
Number
Average Value
Number
Average Value
Number
Average Value
LOANS ORIGINATED
54
$468,806
237
$353,666
8
$116,038
145
$413,537
APPLICATIONS APPROVED, NOT ACCEPTED
7
$470,501
24
$259,571
1
$35,450
14
$374,630
APPLICATIONS DENIED
3
$700,610
33
$322,395
6
$160,712
12
$325,272
APPLICATIONS WITHDRAWN
10
$447,260
25
$438,417
1
$186,280
11
$670,969
FILES CLOSED FOR INCOMPLETENESS
1
$418,120
6
$223,570
0
$0
3
$225,837
Aggregated Statistics For Year 2002 (Based on 6 partial tracts)
A) FHA, FSA/RHS & VA Home Purchase Loans
B) Conventional Home Purchase Loans
C) Refinancings
D) Home Improvement Loans
E) Loans on Dwellings For 5+ Families
F) Non-occupant Loans on < 5 Family Dwellings (A B C & D)
Number
Average Value
Number
Average Value
Number
Average Value
Number
Average Value
Number
Average Value
Number
Average Value
LOANS ORIGINATED
1
$153,050
54
$419,949
179
$351,800
12
$117,052
0
$0
120
$406,864
APPLICATIONS APPROVED, NOT ACCEPTED
0
$0
6
$625,318
23
$298,575
1
$112,010
0
$0
12
$369,443
APPLICATIONS DENIED
0
$0
3
$361,423
26
$342,626
5
$122,530
1
$219,030
7
$437,486
APPLICATIONS WITHDRAWN
0
$0
4
$405,040
14
$320,258
2
$293,740
0
$0
9
$467,256
FILES CLOSED FOR INCOMPLETENESS
0
$0
0
$0
5
$318,958
0
$0
0
$0
3
$247,447
Aggregated Statistics For Year 2001 (Based on 6 partial tracts)
A) FHA, FSA/RHS & VA Home Purchase Loans
B) Conventional Home Purchase Loans
C) Refinancings
D) Home Improvement Loans
F) Non-occupant Loans on < 5 Family Dwellings (A B C & D)
Number
Average Value
Number
Average Value
Number
Average Value
Number
Average Value
Number
Average Value
LOANS ORIGINATED
0
$0
68
$312,372
113
$302,502
9
$106,964
81
$310,222
APPLICATIONS APPROVED, NOT ACCEPTED
0
$0
5
$447,774
9
$385,318
1
$21,820
8
$361,596
APPLICATIONS DENIED
1
$100,520
8
$625,732
17
$275,001
5
$44,442
3
$459,113
APPLICATIONS WITHDRAWN
0
$0
5
$650,592
9
$272,310
2
$285,945
2
$235,985
FILES CLOSED FOR INCOMPLETENESS
0
$0
1
$411,960
5
$253,466
0
$0
2
$363,155
Aggregated Statistics For Year 2000 (Based on 6 partial tracts)
A) FHA, FSA/RHS & VA Home Purchase Loans
B) Conventional Home Purchase Loans
C) Refinancings
D) Home Improvement Loans
F) Non-occupant Loans on < 5 Family Dwellings (A B C & D)
Number
Average Value
Number
Average Value
Number
Average Value
Number
Average Value
Number
Average Value
LOANS ORIGINATED
1
$143,800
62
$337,276
33
$334,333
8
$67,506
45
$352,822
APPLICATIONS APPROVED, NOT ACCEPTED
0
$0
4
$439,275
6
$389,063
4
$46,325
2
$1,082,975
APPLICATIONS DENIED
0
$0
7
$548,343
15
$321,251
2
$57,565
2
$492,495
APPLICATIONS WITHDRAWN
0
$0
4
$679,940
9
$163,320
1
$26,700
4
$488,938
FILES CLOSED FOR INCOMPLETENESS
0
$0
0
$0
2
$201,490
0
$0
0
$0
Aggregated Statistics For Year 1999 (Based on 3 partial tracts)
B) Conventional Home Purchase Loans
C) Refinancings
D) Home Improvement Loans
F) Non-occupant Loans on < 5 Family Dwellings (A B C & D)
2004 - 2018 National Fire Incident Reporting System (NFIRS) incidents
Based on the data from the years 2004 - 2018 the average number of fires per year is 7. The highest number of fire incidents - 17 took place in 2010, and the least - 0 in 2013. The data has a rising trend.
When looking into fire subcategories, the most reports belonged to: Structure Fires (54.9%), and Outside Fires (29.4%).
Fire incident types reported to NFIRS in Zip Code 08738


 Nearest zip codes: 08735, 08723, 08742, 08751, 08724, 08730.
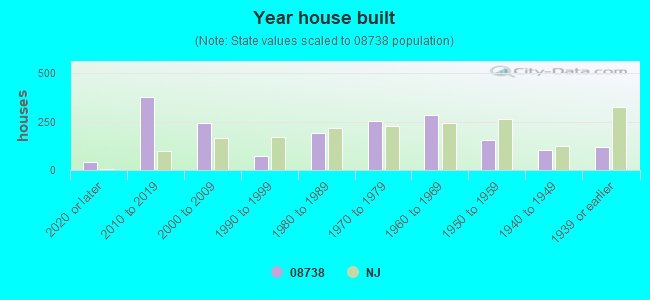


 Based on the data from the years 2004 - 2018 the average number of fires per year is 7. The highest number of fire incidents - 17 took place in 2010, and the least - 0 in 2013. The data has a rising trend.
 When looking into fire subcategories, the most reports belonged to: Structure Fires (54.9%), and Outside Fires (29.4%).