Work and Jobs in Blackfeet, Montana (MT) Detailed Stats
Occupations, Industries, Unemployment, Workers, Commute
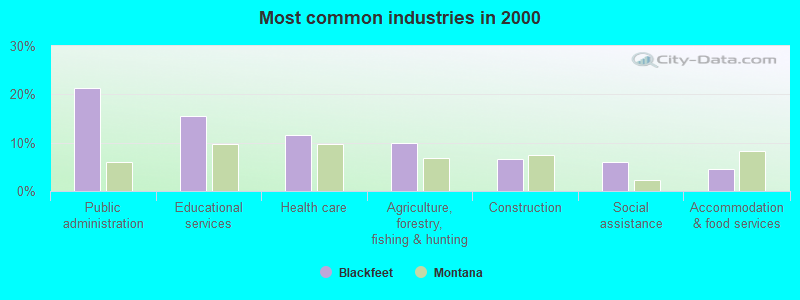
The most common industries in Blackfeet are: Public administration (21.2% of civilian employees), Educational services (15.5% of civilian employees), Health care (11.6% of civilian employees). 24.7% of workers are employees of private companies, which is 126.8% less than the rate of 56.0% across the entire state of Montana.
Most common industries
Most common industries | |||
|---|---|---|---|
Industry | All | Males | Females |
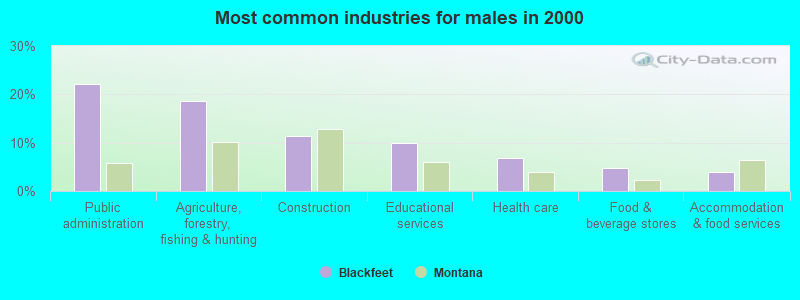
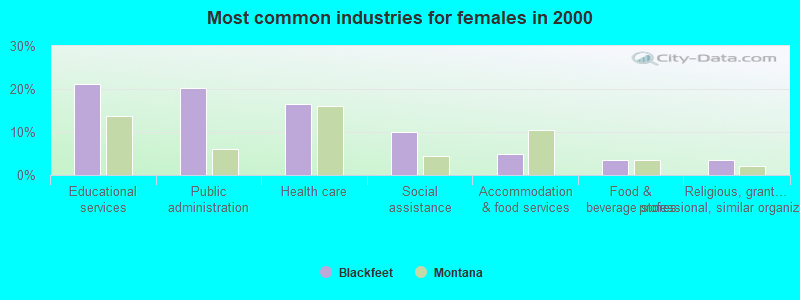
| Public administration | 21.2% (621) | 22.2% (325) | 20.3% (296) |
| Educational services | 15.5% (452) | 9.9% (145) | 21.1% (307) |
| Health care | 11.6% (340) | 6.8% (100) | 16.5% (240) |
| Agriculture, forestry, fishing and hunting | 10.0% (292) | 18.7% (274) | 1.2% (18) |
| Construction | 6.7% (196) | 11.3% (166) | 2.1% (30) |
| Social assistance | 6.0% (176) | 2.0% (29) | 10.1% (147) |
| Accommodation and food services | 4.4% (130) | 4.0% (59) | 4.9% (71) |
| Food and beverage stores | 4.1% (120) | 4.7% (69) | 3.5% (51) |
| Religious, grantmaking, civic, professional, and similar organizations | 2.6% (75) | 1.7% (25) | 3.4% (50) |
| Administrative and support and waste management services | 1.9% (56) | 2.5% (36) | 1.4% (20) |
| Professional, scientific, and technical services | 1.7% (51) | 1.4% (20) | 2.1% (31) |
| Finance and insurance | 1.3% (39) | 0.2% (3) | 2.5% (36) |
| Motor vehicle and parts dealers | 1.2% (36) | 2.5% (36) | 0.0% (0) |
| Real estate and rental and leasing | 1.2% (34) | 1.1% (16) | 1.2% (18) |
| Utilities | 1.0% (30) | 0.8% (12) | 1.2% (18) |
| Truck transportation | 0.9% (27) | 1.8% (27) | 0.0% (0) |
| Arts, entertainment, and recreation | 0.8% (23) | 1.2% (17) | 0.4% (6) |
| Department and other general merchandise stores | 0.7% (21) | 0.1% (2) | 1.3% (19) |
| Retail florists | 0.6% (18) | 0.1% (2) | 1.1% (16) |
| Private households | 0.6% (18) | 0.3% (5) | 0.9% (13) |
| U. S. Postal service | 0.6% (17) | 0.2% (3) | 1.0% (14) |
| Repair and maintenance | 0.6% (17) | 1.2% (17) | 0.0% (0) |
| Other transportation, and support activities, and couriers | 0.5% (16) | 0.7% (11) | 0.3% (5) |
| Groceries and related products merchant wholesalers | 0.5% (14) | 0.6% (9) | 0.3% (5) |
| Gasoline stations | 0.4% (11) | 0.3% (5) | 0.4% (6) |
| Personal and laundry services | 0.4% (11) | 0.0% (0) | 0.8% (11) |
| Sporting goods, camera, and hobby and toy stores | 0.3% (10) | 0.0% (0) | 0.7% (10) |
| Metal and metal products | 0.3% (10) | 0.7% (10) | 0.0% (0) |
| Fuel dealers | 0.3% (8) | 0.2% (3) | 0.3% (5) |
| Broadcasting and telecommunications | 0.2% (7) | 0.3% (5) | 0.1% (2) |
| Drugs, sundries, and chemical and allied products merchant wholesalers | 0.2% (7) | 0.5% (7) | 0.0% (0) |
| Building material and garden equipment and supplies dealers | 0.2% (6) | 0.4% (6) | 0.0% (0) |
| Air transportation | 0.2% (6) | 0.4% (6) | 0.0% (0) |
| Rail transportation | 0.2% (5) | 0.3% (5) | 0.0% (0) |
| Wood products | 0.1% (4) | 0.3% (4) | 0.0% (0) |
| Other direct selling establishments | 0.1% (3) | 0.0% (0) | 0.2% (3) |
| Warehousing and storage | 0.1% (3) | 0.0% (0) | 0.2% (3) |
| Publishing, and motion picture and sound recording industries | 0.1% (3) | 0.0% (0) | 0.2% (3) |
| Petroleum and coal products | 0.1% (3) | 0.2% (3) | 0.0% (0) |
| Clothing and accessories, including shoe, stores | 0.1% (2) | 0.1% (2) | 0.0% (0) |
| Miscellaneous durable goods merchant wholesalers | 0.1% (2) | 0.1% (2) | 0.0% (0) |
Unemployment in Blackfeet
- Unemployment by race in 2000
- Unemployment rate for White non-Hispanic residents
- 3.6%Males
- 6.6%Females
- Unemployment rate for American Indian and Alaska Native residents
- 28.1%Males
- 22.3%Females
- Unemployment rate for two or more race residents
- 26.3%Males
- 14.9%Females
- Unemployment rate for Hispanic or Latino residents
- 58.3%Males
- 50.0%Females
Time leaving home to go to work

<5am:
| Blackfeet: | 1.2% (35) |
| Montana: | 2.7% (11,262) |
5:30am:
| Blackfeet: | 0.2% (7) |
| Montana: | 1.8% (7,411) |
6am:
| Blackfeet: | 1.4% (40) |
| Montana: | 3.0% (12,480) |
6:30am:
| Blackfeet: | 5.2% (149) |
| Montana: | 5.1% (21,726) |
7am:
| Blackfeet: | 5.1% (147) |
| Montana: | 8.4% (35,518) |
7:30am:
| Blackfeet: | 14.1% (407) |
| Montana: | 13.3% (56,115) |
8am:
| Blackfeet: | 36.7% (1,059) |
| Montana: | 21.4% (90,201) |
8:30am:
| Blackfeet: | 12.4% (359) |
| Montana: | 11.7% (49,381) |
9am:
| Blackfeet: | 2.1% (62) |
| Montana: | 5.0% (20,912) |
10am:
| Blackfeet: | 4.3% (125) |
| Montana: | 5.3% (22,556) |
11am:
| Blackfeet: | 1.6% (47) |
| Montana: | 2.5% (10,541) |
12pm:
| Blackfeet: | 1.4% (40) |
| Montana: | 1.2% (5,136) |
4pm:
| Blackfeet: | 3.5% (100) |
| Montana: | 5.7% (24,245) |
>4pm:
| Blackfeet: | 3.9% (113) |
| Montana: | 6.6% (27,764) |
Travel time to work


Less than 5 minutes:
| Blackfeet: | 9.8% (284) |
| Montana: | 7.8% (33,091) |
5 to 9 minutes:
| Blackfeet: | 24.1% (694) |
| Montana: | 20.5% (86,585) |
10 to 14 minutes:
| Blackfeet: | 18.5% (534) |
| Montana: | 20.8% (87,855) |
15 to 19 minutes:
| Blackfeet: | 14.7% (423) |
| Montana: | 16.3% (68,642) |
20 to 24 minutes:
| Blackfeet: | 6.7% (194) |
| Montana: | 10.3% (43,356) |
25 to 29 minutes:
| Blackfeet: | 1.7% (48) |
| Montana: | 2.9% (12,288) |
30 to 34 minutes:
| Blackfeet: | 8.1% (235) |
| Montana: | 6.4% (27,044) |
35 to 39 minutes:
| Blackfeet: | 1.0% (29) |
| Montana: | 0.9% (3,683) |
40 to 44 minutes:
| Blackfeet: | 1.1% (33) |
| Montana: | 1.1% (4,826) |
45 to 59 minutes:
| Blackfeet: | 3.1% (89) |
| Montana: | 2.7% (11,349) |
60 to 89 minutes:
| Blackfeet: | 2.4% (68) |
| Montana: | 2.1% (8,715) |
90 or more minutes:
| Blackfeet: | 2.0% (59) |
| Montana: | 1.9% (7,814) |
Means of transportation to work

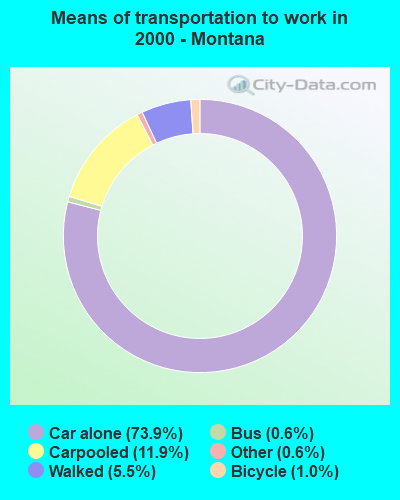
Drove car alone:
| Blackfeet: | 59.1% (1,704) |
| Montana: | 73.9% (311,872) |
Carpooled:
| Blackfeet: | 25.7% (741) |
| Montana: | 11.9% (50,192) |
Bus or trolley bus:
| Blackfeet: | 0.1% (4) |
| Montana: | 0.6% (2,441) |
Walked:
| Blackfeet: | 7.5% (216) |
| Montana: | 5.5% (23,336) |
Other means:
| Blackfeet: | 0.9% (25) |
| Montana: | 0.6% (2,649) |
Private vehicle occupancy

Drove alone:
| Blackfeet: | 69.7% (1,704) |
| Montana: | 86.1% (311,872) |
In 2 person carpool:
| Blackfeet: | 18.5% (453) |
| Montana: | 10.7% (38,849) |
In 3 person carpool:
| Blackfeet: | 6.0% (147) |
| Montana: | 2.1% (7,492) |
In 4 person carpool:
| Blackfeet: | 3.0% (73) |
| Montana: | 0.7% (2,420) |
In 5-6 person carpool:
| Blackfeet: | 2.8% (68) |
| Montana: | 0.3% (1,138) |
Class of workers
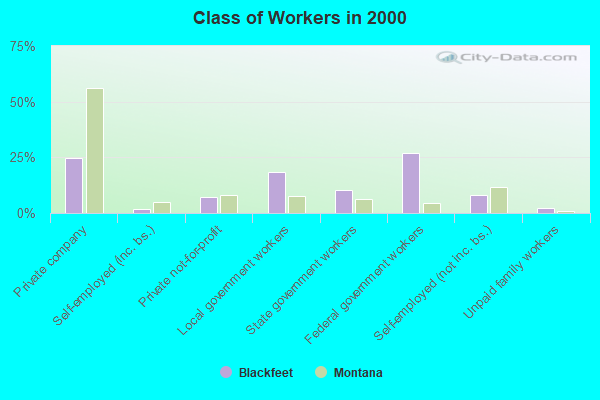
Employee of private company:
| Blackfeet: | 24.7% (722) |
| Montana: | 56.0% (238,678) |
Self-employed in own incorporated business:
| Blackfeet: | 2.0% (57) |
| Montana: | 4.9% (20,821) |
Private not-for-profit wage and salary workers:
| Blackfeet: | 7.2% (210) |
| Montana: | 8.2% (35,132) |
Local government workers:
| Blackfeet: | 18.3% (535) |
| Montana: | 7.8% (33,240) |
State government workers:
| Blackfeet: | 10.1% (296) |
| Montana: | 6.2% (26,416) |
Federal government workers:
| Blackfeet: | 27.0% (789) |
| Montana: | 4.3% (18,467) |
Self-employed workers in own not incorporated business:
| Blackfeet: | 8.3% (242) |
| Montana: | 11.8% (50,112) |
Unpaid family workers:
| Blackfeet: | 2.5% (72) |
| Montana: | 0.7% (3,111) |

Employee of private company - Males:
| Blackfeet: | 30.7% (451) |
| Montana: | 57.9% (130,152) |
Self-employed in own incorporated business - Males:
| Blackfeet: | 2.9% (43) |
| Montana: | 6.7% (15,063) |
Private not-for-profit wage and salary workers - Males:
| Blackfeet: | 3.7% (55) |
| Montana: | 4.7% (10,570) |
Local government workers - Males:
| Blackfeet: | 15.7% (231) |
| Montana: | 6.0% (13,559) |
State government workers - Males:
| Blackfeet: | 6.8% (100) |
| Montana: | 5.3% (11,870) |
Federal government workers - Males:
| Blackfeet: | 23.0% (338) |
| Montana: | 4.4% (9,873) |
Self-employed workers in own not incorporated business - Males:
| Blackfeet: | 12.1% (177) |
| Montana: | 14.3% (32,254) |
Unpaid family workers - Males:
| Blackfeet: | 4.9% (72) |
| Montana: | 0.7% (1,592) |

Employee of private company - Females:
| Blackfeet: | 18.6% (271) |
| Montana: | 54.0% (108,526) |
Self-employed in own incorporated business - Females:
| Blackfeet: | 1.0% (14) |
| Montana: | 2.9% (5,758) |
Private not-for-profit wage and salary workers - Females:
| Blackfeet: | 10.6% (155) |
| Montana: | 12.2% (24,562) |
Local government workers - Females:
| Blackfeet: | 20.9% (304) |
| Montana: | 9.8% (19,681) |
State government workers - Females:
| Blackfeet: | 13.5% (196) |
| Montana: | 7.2% (14,546) |
Federal government workers - Females:
| Blackfeet: | 31.0% (451) |
| Montana: | 4.3% (8,594) |
Self-employed workers in own not incorporated business - Females:
| Blackfeet: | 4.5% (65) |
| Montana: | 8.9% (17,858) |