Races in Yarmouth, Massachusetts (MA) Detailed Stats
Ancestries, Foreign-born residents, place of birth

Recent posts about races in Yarmouth, Massachusetts on our local forum with over 2,400,000 registered users:
 | "Migrants" living in hotels in MA---What is the endgame or is there one at all? (1024 replies) |
| Report finds MA Roadways Dangerous (190 replies) |
| Big MA Ancestry Data Thread by Town (31 replies) |
| Shooting in Broad Daylight Main Street Hyannis (36 replies) |
| Coronavirus in Massachusetts (18048 replies) |
| Yarmouth/Dennis regulations for adding 1/2 bath (2 replies) |
Latest news about races in Yarmouth, MA collected exclusively by city-data.com from local newspapers, TV, and radio stations
5.7% of Yarmouth, MA residents are foreign-born (2.2% born in Europe, 2.1% born in Latin America, 0.7% born in Asia), which is 214.5% less than the foreign-born rate of 18.0% across the entire state of Massachusetts.
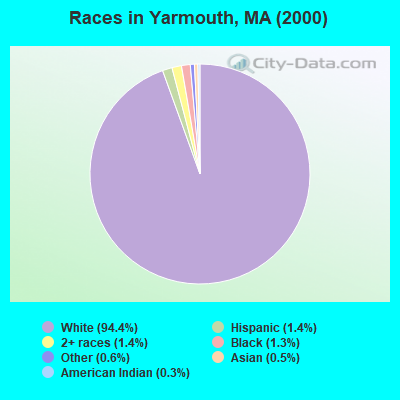
Race distribution in Yarmouth

- 23,42894.4%White alone
- 3581.4%Hispanic
- 3531.4%Two or more races
- 3261.3%Black alone
- 1400.6%Other race alone
- 1170.5%Asian alone
- 760.3%American Indian alone
- 90.04%Native Hawaiian and Other
Pacific Islander alone
2000
2022
-
- 5,198,35981.9%White alone
- 428,7296.8%Hispanic
- 318,3295.0%Black alone
- 236,7863.7%Asian alone
- 110,3381.7%Two or more races
- 43,5860.7%Other race alone
- 11,2640.2%American Indian alone
- 1,7060.03%Native Hawaiian and Other
Pacific Islander alone

-
- 4,676,62767.0%White alone
- 911,03813.0%Hispanic
- 501,4637.2%Asian alone
- 459,7406.6%Black alone
- 341,8894.9%Two or more races
- 84,4031.2%Other race alone
- 5,8380.08%American Indian alone
- 9760.01%Native Hawaiian and Other
Pacific Islander alone

Income and house value in Yarmouth
- Median household income in 2022
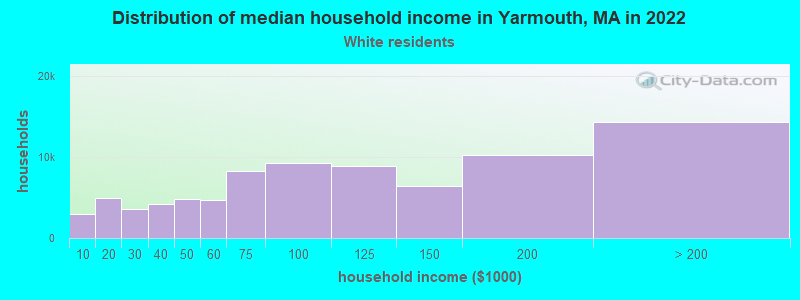
- $81,203White non-Hispanic householders
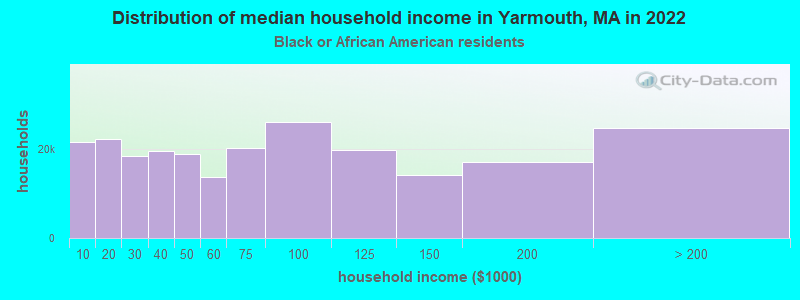
- $62,568Black householders
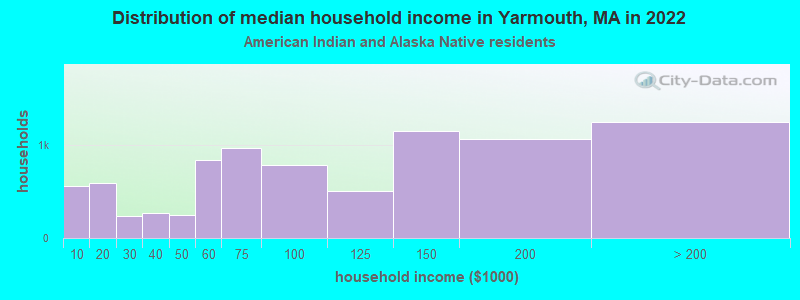
- $172,081American Indian and Alaska Native householders
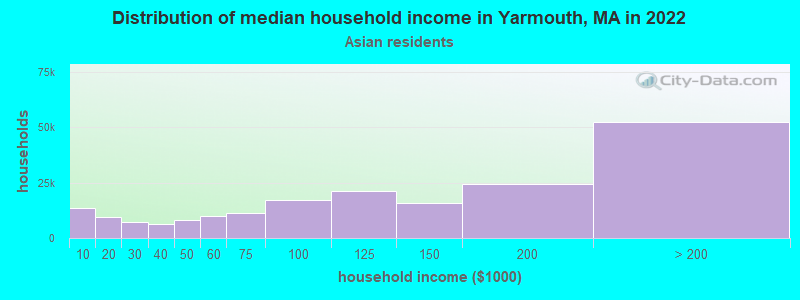
- over $200,000Asian householders
- $175,346Some other race householders
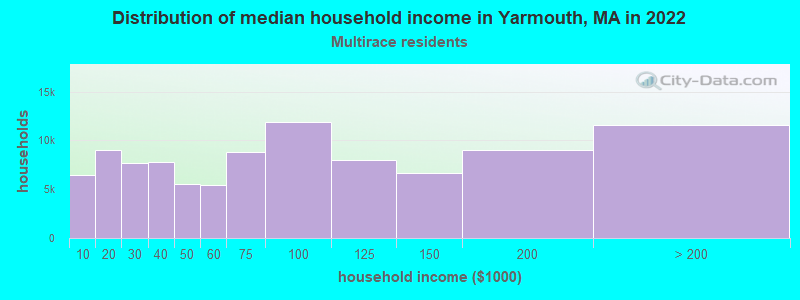
- $66,676Two or more races householders
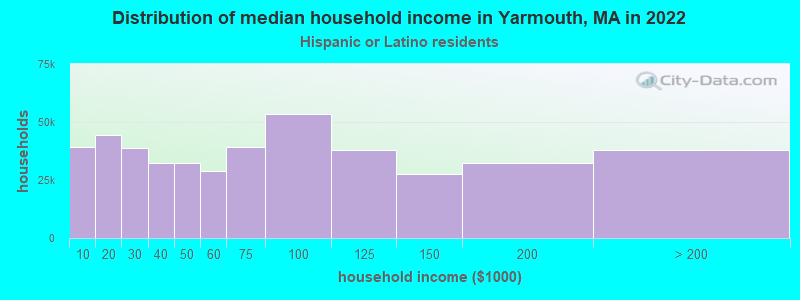
- $104,384Hispanic or Latino race householders
- Median 2022 house value
- $538,122White Non-Hispanic householders
- $490,974Black or African American householders
- $487,429American Indian or Alaska Native householders
- over $1,000,000Asian householders
- $408,732Some other race householders
- $427,165Two or more races householders
- $405,187Hispanic or Latino householders
Household income for White non-Hispanic householders
Household income for Black householders
Household income for American Indian and Alaska Native householders
Household income for Asian householders
Household income for Two or more races householders
Household income for Hispanic or Latino race householders
Foreign-born residents in Yarmouth
1,420 residents are foreign born (2.2% Europe, 2.1% Latin America, 0.7% Asia).
| This city: | 5.7% |
| Massachusetts: | 12.2% |
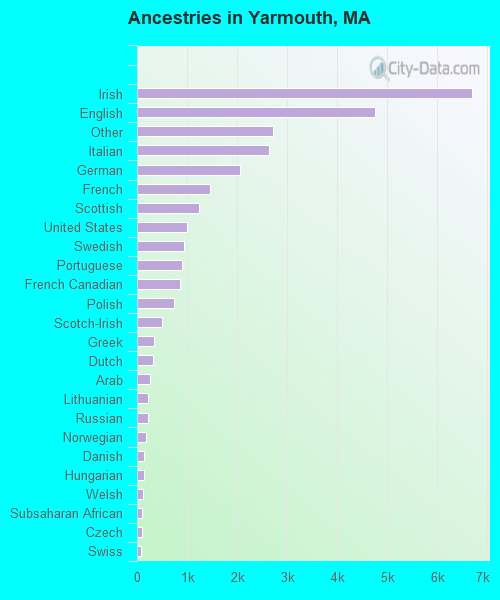
Ancestries in Yarmouth

- 6,69623.3%Irish
- 4,75916.6%English
- 2,7119.4%Other
- 2,6389.2%Italian
- 2,0637.2%German
- 1,4545.1%French
- 1,2314.3%Scottish
- 9963.5%United States
- 9443.3%Swedish
- 8893.1%Portuguese
- 8543.0%French Canadian
- 7342.6%Polish
- 4961.7%Scotch-Irish
- 3301.1%Greek
- 3211.1%Dutch
- 2660.9%Arab
- 2270.8%Lithuanian
- 2190.8%Russian
- 1730.6%Norwegian
- 1450.5%Danish
- 1310.5%Hungarian
- 1160.4%Welsh
- 1050.4%Subsaharan African
- 930.3%Czech
- 740.3%Swiss
- 670.2%Ukrainian
- 50.02%West Indian
Zip codes: 02673.