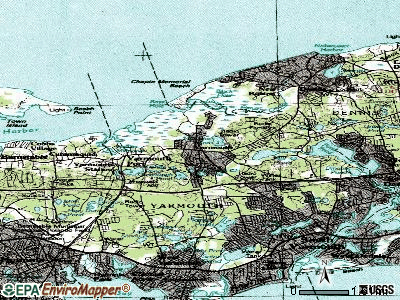
Yarmouth, Massachusetts
Submit your own pictures of this town and show them to the world
- OSM Map
- General Map
- Google Map
- MSN Map
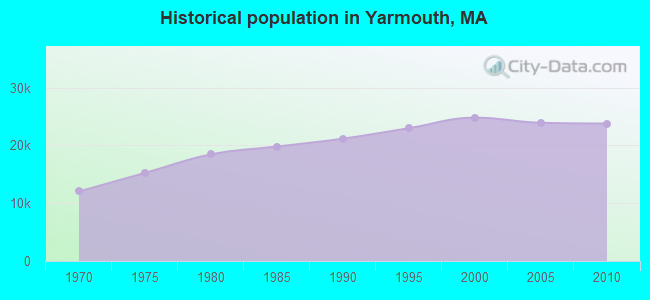
Population change since 2000: -4.1%
 |
| Males: 11,067 | |
| Females: 12,726 |
| Median resident age: | 51.4 years |
| Massachusetts median age: | 39.2 years |
Zip codes: 02673.
| Yarmouth: | $79,245 |
| MA: | $94,488 |
Estimated per capita income in 2022: $54,199 (it was $22,731 in 2000)
Yarmouth town income, earnings, and wages data
Estimated median house or condo value in 2022: $535,996 (it was $151,200 in 2000)
| Yarmouth: | $535,996 |
| MA: | $534,700 |
Mean prices in 2022: all housing units: $623,757; detached houses: $648,447; townhouses or other attached units: $490,502; in 2-unit structures: $577,155; in 3-to-4-unit structures: $445,551; in 5-or-more-unit structures: $351,307; mobile homes: $108,058
Detailed information about poverty and poor residents in Yarmouth, MA


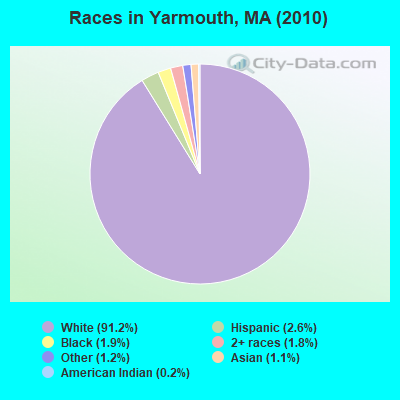
- 21,69891.2%White alone
- 6212.6%Hispanic
- 4481.9%Black alone
- 4251.8%Two or more races
- 2811.2%Other race alone
- 2581.1%Asian alone
- 590.2%American Indian alone
- 30.01%Native Hawaiian and Other
Pacific Islander alone
Races in Yarmouth detailed stats: ancestries, foreign born residents, place of birth
According to our research of Massachusetts and other state lists, there were 5 registered sex offenders living in Yarmouth, Massachusetts as of May 07, 2024.
The ratio of all residents to sex offenders in Yarmouth is 4,759 to 1.
The ratio of registered sex offenders to all residents in this city is much lower than the state average.
Type |
2009 |
2010 |
2011 |
2012 |
2013 |
2014 |
2015 |
2016 |
2017 |
2018 |
2019 |
2020 |
2021 |
2022 |
|---|---|---|---|---|---|---|---|---|---|---|---|---|---|---|
| Murders (per 100,000) | 1 (4.2) | 1 (4.2) | 0 (0.0) | 0 (0.0) | 0 (0.0) | 0 (0.0) | 0 (0.0) | 0 (0.0) | 1 (4.3) | 1 (4.3) | 0 (0.0) | 0 (0.0) | 0 (0.0) | 0 (0.0) |
| Rapes (per 100,000) | 9 (37.5) | 12 (50.4) | 18 (75.2) | 5 (20.8) | 17 (71.6) | 10 (42.2) | 16 (67.9) | 13 (55.8) | 14 (59.9) | 17 (73.1) | 19 (82.3) | 9 (39.1) | 16 (68.7) | 16 (62.2) |
| Robberies (per 100,000) | 21 (87.5) | 22 (92.5) | 18 (75.2) | 7 (29.2) | 8 (33.7) | 17 (71.8) | 12 (51.0) | 4 (17.2) | 11 (47.1) | 7 (30.1) | 3 (13.0) | 4 (17.4) | 6 (25.8) | 2 (7.8) |
| Assaults (per 100,000) | 97 (404.0) | 121 (508.6) | 127 (530.5) | 136 (566.9) | 177 (745.7) | 177 (747.4) | 187 (794.1) | 185 (794.0) | 134 (573.4) | 88 (378.2) | 74 (320.7) | 74 (321.5) | 57 (244.7) | 63 (245.1) |
| Burglaries (per 100,000) | 349 (1,454) | 410 (1,723) | 400 (1,671) | 287 (1,196) | 200 (842.6) | 202 (852.9) | 115 (488.3) | 98 (420.6) | 76 (325.2) | 48 (206.3) | 38 (164.7) | 47 (204.2) | 41 (176.0) | 33 (128.4) |
| Thefts (per 100,000) | 581 (2,420) | 391 (1,643) | 370 (1,546) | 423 (1,763) | 447 (1,883) | 358 (1,512) | 267 (1,134) | 353 (1,515) | 287 (1,228) | 228 (979.8) | 189 (819.0) | 162 (703.9) | 167 (716.9) | 189 (735.3) |
| Auto thefts (per 100,000) | 32 (133.3) | 15 (63.0) | 18 (75.2) | 15 (62.5) | 22 (92.7) | 19 (80.2) | 22 (93.4) | 18 (77.3) | 9 (38.5) | 16 (68.8) | 5 (21.7) | 8 (34.8) | 8 (34.3) | 5 (19.5) |
| Arson (per 100,000) | 8 (33.3) | 5 (21.0) | 5 (20.9) | 7 (29.2) | 2 (8.4) | 4 (16.9) | 7 (29.7) | 2 (8.6) | 3 (12.8) | 5 (21.5) | 0 (0.0) | 2 (8.7) | 2 (8.6) | 3 (11.7) |
| City-Data.com crime index | 354.6 | 369.6 | 373.6 | 298.1 | 358.3 | 331.4 | 315.5 | 304.8 | 260.2 | 210.8 | 179.9 | 146.0 | 155.4 | 141.1 |
The City-Data.com crime index weighs serious crimes and violent crimes more heavily. Higher means more crime, U.S. average is 246.1. It adjusts for the number of visitors and daily workers commuting into cities.
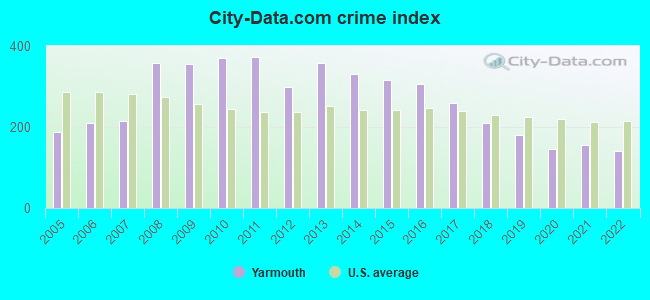
Crime rate in Yarmouth detailed stats: murders, rapes, robberies, assaults, burglaries, thefts, arson
Full-time law enforcement employees in 2021, including police officers: 75 (61 officers - 57 male; 4 female).
| Officers per 1,000 residents here: | 2.62 |
| Massachusetts average: | 2.53 |
 Recent articles from our blog. Our writers, many of them Ph.D. graduates or candidates, create easy-to-read articles on a wide variety of topics.

 | "Migrants" living in hotels in MA---What is the endgame or is there one at all? (992 replies) |
| 2024 Real Estate Observations (859 replies) |
| Gov Declares "State of Emergency" for Migrant Crisis (1384 replies) |
| Report finds MA Roadways Dangerous (190 replies) |
| Somerville 'career criminal' that killed Yarmouth cop had 111 priors (45 replies) |
| Shooting in Broad Daylight Main Street Hyannis (36 replies) |
Latest news from Yarmouth, MA collected exclusively by city-data.com from local newspapers, TV, and radio stations
Ancestries: Irish (27.0%), English (19.2%), Italian (10.6%), German (8.3%), French (5.9%), Scottish (5.0%).
Current Local Time: EST time zone
Incorporated in 1639
Elevation: 30 feet
Land area: 24.2 square miles.
Population density: 981 people per square mile (low).
1,420 residents are foreign born (2.2% Europe, 2.1% Latin America, 0.7% Asia).
| This town: | 5.7% |
| Massachusetts: | 12.2% |
| Yarmouth town: | 1.0% ($1,468) |
| Massachusetts: | 1.3% ($2,336) |
Nearest city with pop. 50,000+: New Bedford, MA  (37.0 miles , pop. 93,768).
Nearest city with pop. 200,000+: Boston, MA (63.6 miles , pop. 589,141).
Nearest city with pop. 1,000,000+: Bronx, NY (198.4 miles , pop. 1,332,650).
Nearest cities:
), ), ), Latitude: 41.67 N, Longitude: 70.22 W

Yarmouth, Massachusetts accommodation & food services, waste management - Economy and Business Data
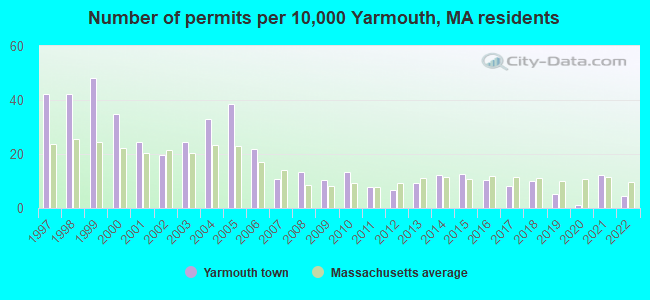
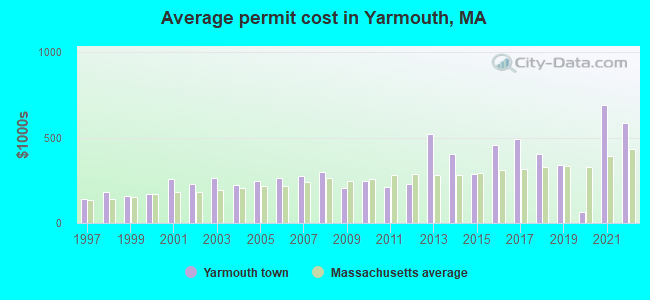
Single-family new house construction building permits:
- 2022: 11 buildings, average cost: $582,500
- 2021: 30 buildings, average cost: $691,800
- 2020: 3 buildings, average cost: $62,300
- 2019: 13 buildings, average cost: $338,400
- 2018: 25 buildings, average cost: $403,200
- 2017: 20 buildings, average cost: $493,900
- 2016: 26 buildings, average cost: $457,100
- 2015: 31 buildings, average cost: $288,300
- 2014: 30 buildings, average cost: $406,100
- 2013: 23 buildings, average cost: $522,500
- 2012: 17 buildings, average cost: $231,000
- 2011: 19 buildings, average cost: $212,100
- 2010: 33 buildings, average cost: $246,400
- 2009: 26 buildings, average cost: $202,700
- 2008: 33 buildings, average cost: $299,600
- 2007: 27 buildings, average cost: $274,800
- 2006: 54 buildings, average cost: $263,000
- 2005: 96 buildings, average cost: $247,100
- 2004: 82 buildings, average cost: $220,200
- 2003: 61 buildings, average cost: $261,500
- 2002: 49 buildings, average cost: $229,900
- 2001: 61 buildings, average cost: $255,900
- 2000: 86 buildings, average cost: $168,600
- 1999: 119 buildings, average cost: $155,800
- 1998: 105 buildings, average cost: $181,000
- 1997: 105 buildings, average cost: $139,200
| Here: | 5.4% |
| Massachusetts: | 3.5% |
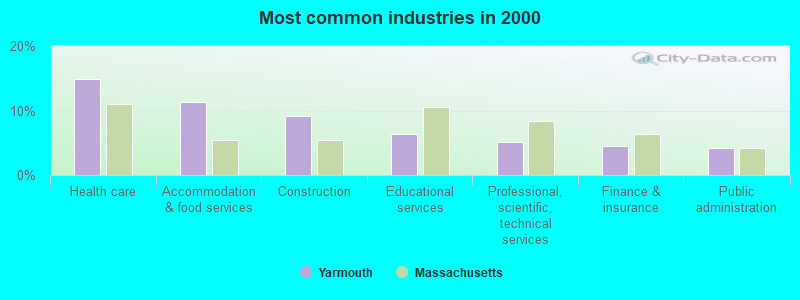
- Health care (14.8%)
- Accommodation & food services (11.4%)
- Construction (9.2%)
- Educational services (6.4%)
- Professional, scientific, technical services (5.2%)
- Finance & insurance (4.5%)
- Public administration (4.2%)
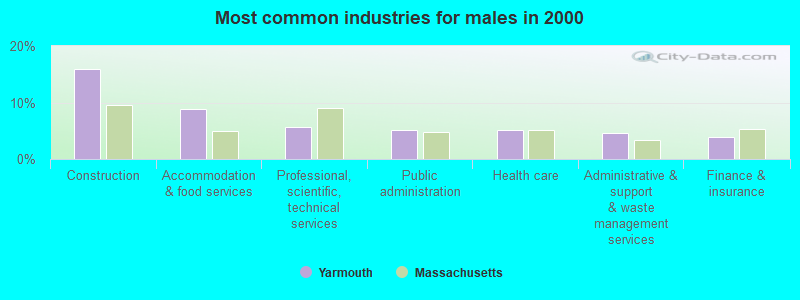
- Construction (16.0%)
- Accommodation & food services (8.8%)
- Professional, scientific, technical services (5.6%)
- Public administration (5.1%)
- Health care (5.1%)
- Administrative & support & waste management services (4.6%)
- Finance & insurance (4.0%)
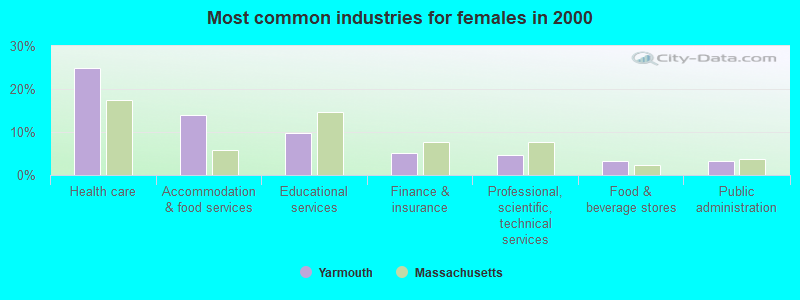
- Health care (24.9%)
- Accommodation & food services (14.0%)
- Educational services (9.8%)
- Finance & insurance (5.1%)
- Professional, scientific, technical services (4.7%)
- Food & beverage stores (3.3%)
- Public administration (3.2%)
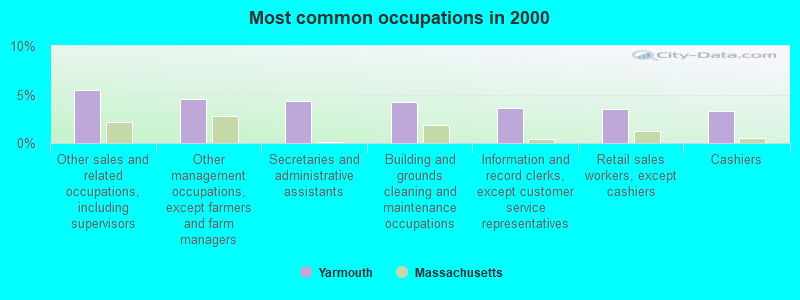
- Other sales and related occupations, including supervisors (5.5%)
- Other management occupations, except farmers and farm managers (4.5%)
- Secretaries and administrative assistants (4.4%)
- Building and grounds cleaning and maintenance occupations (4.3%)
- Information and record clerks, except customer service representatives (3.6%)
- Retail sales workers, except cashiers (3.5%)
- Cashiers (3.3%)
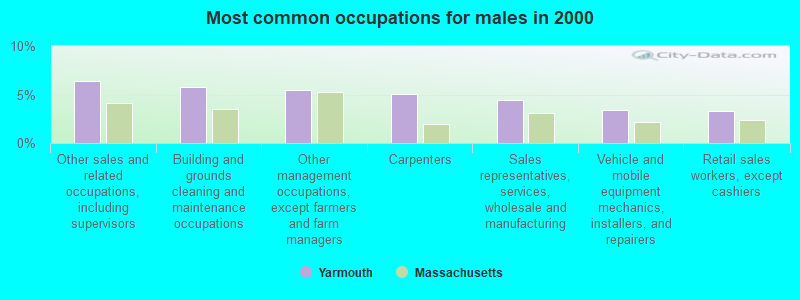
- Other sales and related occupations, including supervisors (6.3%)
- Building and grounds cleaning and maintenance occupations (5.8%)
- Other management occupations, except farmers and farm managers (5.5%)
- Carpenters (5.0%)
- Sales representatives, services, wholesale and manufacturing (4.4%)
- Vehicle and mobile equipment mechanics, installers, and repairers (3.4%)
- Retail sales workers, except cashiers (3.3%)

- Secretaries and administrative assistants (8.5%)
- Information and record clerks, except customer service representatives (6.5%)
- Registered nurses (5.6%)
- Nursing, psychiatric, and home health aides (5.6%)
- Other office and administrative support workers, including supervisors (5.3%)
- Other sales and related occupations, including supervisors (4.6%)
- Cashiers (4.3%)
Average climate in Yarmouth, Massachusetts
Based on data reported by over 4,000 weather stations


(lower is better)
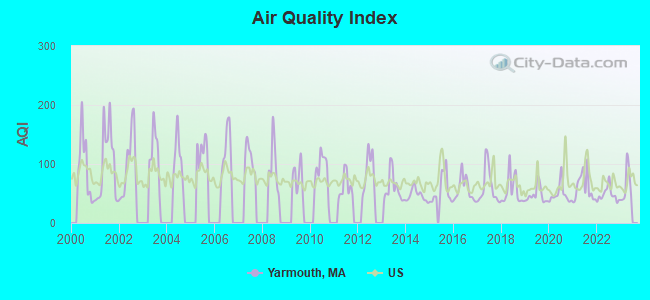
Air Quality Index (AQI) level in 2022 was 48.0. This is significantly better than average.
| City: | 48.0 |
| U.S.: | 72.6 |
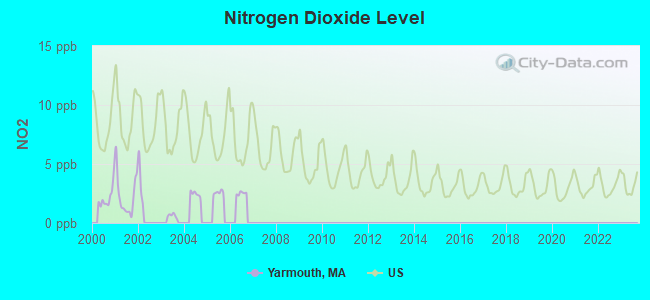
Nitrogen Dioxide (NO2) [ppb] level in 2001 was 2.30. This is significantly better than average. Closest monitor was 21.7 miles away from the city center.
| City: | 2.30 |
| U.S.: | 5.11 |
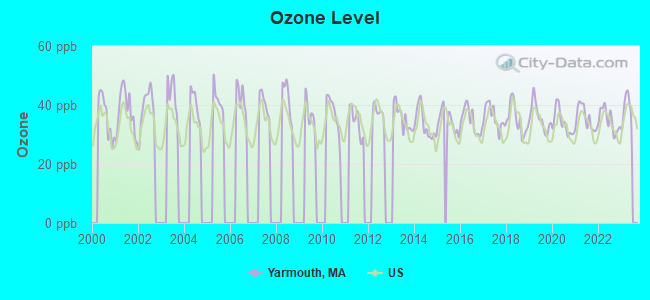
Ozone [ppb] level in 2022 was 34.8. This is about average. Closest monitor was 23.5 miles away from the city center.
| City: | 34.8 |
| U.S.: | 33.3 |
Earthquake activity:
Yarmouth-area historical earthquake activity is significantly above Massachusetts state average. It is 77% smaller than the overall U.S. average.On 10/16/2012 at 23:12:25, a magnitude 4.7 (4.7 ML, Depth: 10.0 mi, Class: Light, Intensity: IV - V) earthquake occurred 135.2 miles away from Yarmouth center
On 10/7/1983 at 10:18:46, a magnitude 5.3 (5.1 MB, 5.3 LG, 5.1 ML, Class: Moderate, Intensity: VI - VII) earthquake occurred 262.2 miles away from the city center
On 1/19/1982 at 00:14:42, a magnitude 4.7 (4.5 MB, 4.7 MD, 4.5 LG) earthquake occurred 144.9 miles away from Yarmouth center
On 4/20/2002 at 10:50:47, a magnitude 5.3 (5.3 ML, Depth: 3.0 mi) earthquake occurred 263.7 miles away from Yarmouth center
On 8/22/1992 at 12:20:32, a magnitude 4.8 (4.8 MB, 3.8 MS, 4.7 LG, Depth: 6.2 mi) earthquake occurred 177.4 miles away from the city center
On 4/20/2002 at 10:50:47, a magnitude 5.2 (5.2 MB, 4.2 MS, 5.2 MW, 5.0 MW) earthquake occurred 263.1 miles away from Yarmouth center
Magnitude types: regional Lg-wave magnitude (LG), body-wave magnitude (MB), duration magnitude (MD), local magnitude (ML), surface-wave magnitude (MS), moment magnitude (MW)
Natural disasters:
The number of natural disasters in Barnstable County (21) is greater than the US average (15).Major Disasters (Presidential) Declared: 11
Emergencies Declared: 8
Causes of natural disasters: Hurricanes: 7, Floods: 5, Storms: 4, Snows: 3, Snowstorms: 3, Winter Storms: 3, Blizzards: 2, Snowfall: 1, Tropical Storm: 1, Wind: 1, Other: 1 (Note: some incidents may be assigned to more than one category).
Hospitals and medical centers in Yarmouth:
Other hospitals and medical centers near Yarmouth:
- WINDSOR NURSING AND RETIREMENT HOME (Nursing Home, about 2 miles away; SOUTH YARMOUTH, MA)
- MAYFLOWER PLACE NURSING CENTER (Nursing Home, about 3 miles away; WEST YARMOUTH, MA)
- CAPE COD HOSPITAL Acute Care Hospitals (about 4 miles away; HYANNIS, MA)
- HYANNIS SKILLED CARE CENTER (Nursing Home, about 4 miles away; HYANNIS, MA)
- LEWIS BAY CONV HOME (Nursing Home, about 4 miles away; HYANNIS, MA)
- HYANNIS CONVALESCENT CENTER (Nursing Home, about 4 miles away; HYANNIS, MA)
- OLSTEN KIMBERLY QUALITY CARE (Home Health Center, about 4 miles away; YARMOUTH PORT, MA)
Colleges/universities with over 2000 students nearest to Yarmouth:
- Cape Cod Community College (about 7 miles; West Barnstable, MA; Full-time enrollment: 2,491)
- University of Massachusetts-Dartmouth (about 41 miles; North Dartmouth, MA; FT enrollment: 7,545)
- Bridgewater State University (about 45 miles; Bridgewater, MA; FT enrollment: 9,802)
- Bristol Community College (about 47 miles; Fall River, MA; FT enrollment: 5,707)
- Massasoit Community College (about 49 miles; Brockton, MA; FT enrollment: 5,442)
- Stonehill College (about 52 miles; Easton, MA; FT enrollment: 2,563)
- Roger Williams University (about 55 miles; Bristol, RI; FT enrollment: 4,375)
Points of interest:
Notable locations in Yarmouth: Bass River West Jetty Light (A), Bass River Golf Club (B), Christmas Tree Plaza (C), South Yarmouth Plaza (D), Boy Scout Camp (E), Baxters Mill (F), South Dennis Station (G), Medical Services Ambulances (H), Cape Cod Ambulance (I), Yarmouth Fire Department Station 3 (J), Yarmouth Fire Department Station 2 (K), Yarmouth Fire Department Station 1 Headquarters (L), Cape Cod Coliseum (M), Chandler Gray House (N), Colonel John Thacher House (O), Winslow-Crocker House (P), South Yarmouth Station (Q). Display/hide their locations on the map
Cemeteries: Ancient Cemetery (1), Georgetown Cemetery (2), Woodside Cemetery (3), Pine Grove Cemetery (4). Display/hide their locations on the map
Lakes, reservoirs, and swamps: Howes Pond (A), Labans Pond (B), Seine Pond (C), Plashes Pond (D), Perch Pond (E), Mill Pond (F), Miller Pond (G), Matthews Pond (H). Display/hide their locations on the map
Streams, rivers, and creeks: Short Wharf Creek (A), Chase Garden Creek (B), Clays Creek (C), Parkers River (D), Pine Island Creek (E), Whites Brook (F), Town Brook (G), Thornton Brook (H), Plashes Brook (I). Display/hide their locations on the map
Beaches: Bass River Beach (A), Parkers River Beach (B), Thachers Beach (C), Sea Gull Beach (D), Bay View Street Beach (E), Grays Beach (F), Englewood Beach (G), Salt Box Beach (H). Display/hide their locations on the map
Hotel: Blueberry Manor (438 Route 6A) (1). Display/hide its approximate location on the map
Birthplace of: Joe Sherman - Baseball player, Joseph Eldridge Hamblin - Union Army general, Kevin Reed - College basketball player (Maine Black Bears).
| This town: | 2.1 people |
| Massachusetts: | 2.5 people |
| This town: | 57.7% |
| Whole state: | 63.0% |
| This town: | 6.3% |
| Whole state: | 7.0% |
Likely homosexual households (counted as self-reported same-sex unmarried-partner households)
- Lesbian couples: 0.6% of all households
- Gay men: 0.4% of all households
| This town: | 7.5% |
| Whole state: | 9.3% |
| This town: | 3.7% |
| Whole state: | 4.4% |
People in group quarters in Yarmouth in 2010:
- 101 people in nursing facilities/skilled-nursing facilities
- 46 people in emergency and transitional shelters (with sleeping facilities) for people experiencing homelessness
- 12 people in group homes intended for adults
- 10 people in residential treatment centers for juveniles (non-correctional)
People in group quarters in Yarmouth in 2000:
- 179 people in nursing homes
- 120 people in other workers' dormitories
- 100 people in other noninstitutional group quarters
- 21 people in other nonhousehold living situations
- 16 people in homes for the mentally retarded
- 12 people in homes for the physically handicapped
- 8 people in other group homes
- 6 people in residential treatment centers for emotionally disturbed children
- 4 people in religious group quarters
For population 15 years and over in Yarmouth:
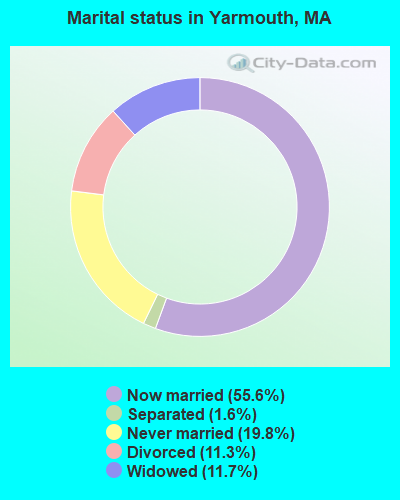
- Never married: 19.8%
- Now married: 55.6%
- Separated: 1.6%
- Widowed: 11.7%
- Divorced: 11.3%
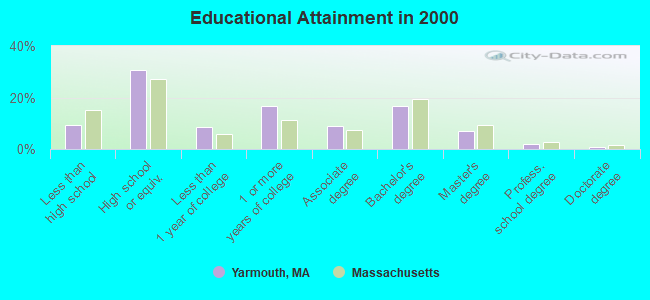
For population 25 years and over in Yarmouth:
- High school or higher: 90.8%
- Bachelor's degree or higher: 26.2%
- Graduate or professional degree: 9.5%
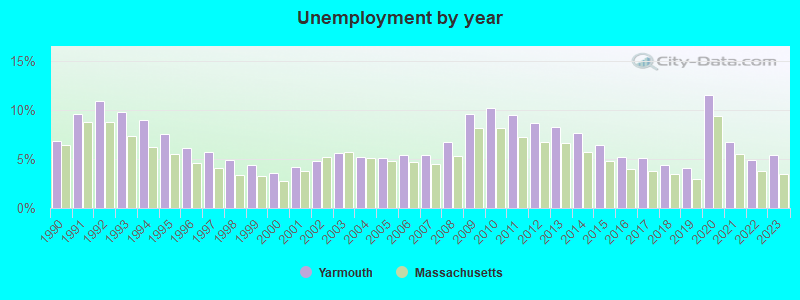
- Unemployed: 5.9%
- Mean travel time to work (commute): 21.4 minutes
| Here: | 10.0 |
| Massachusetts average: | 13.1 |
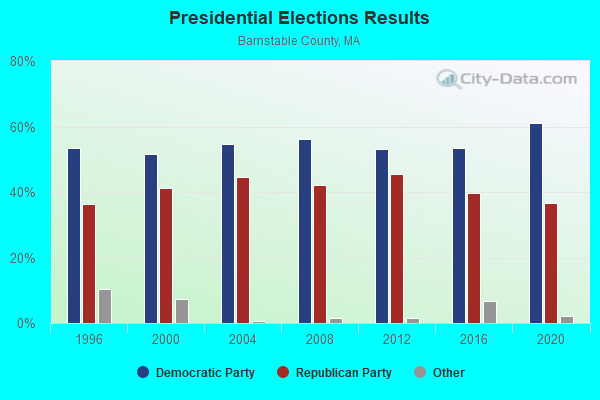
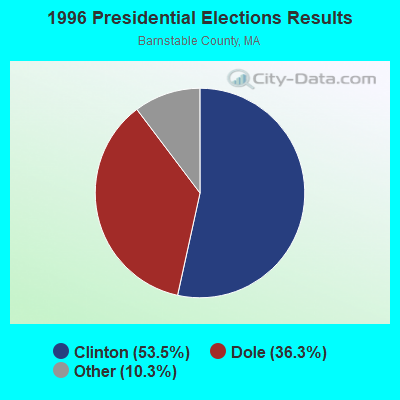
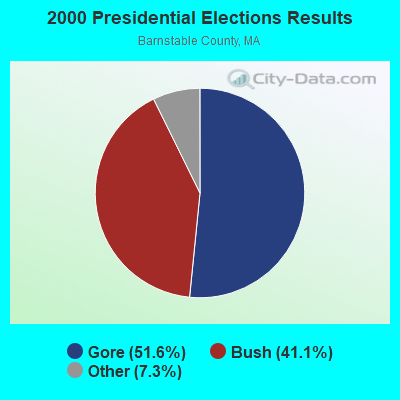

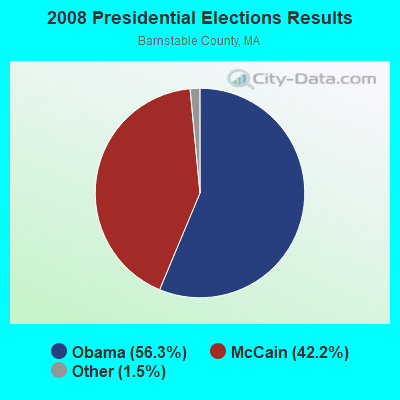

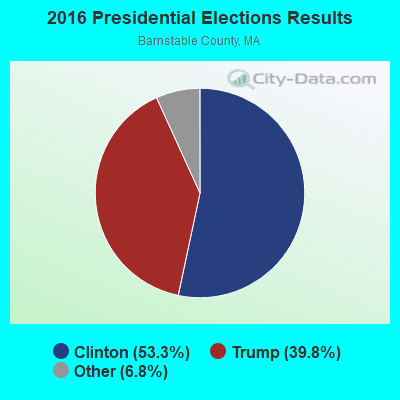
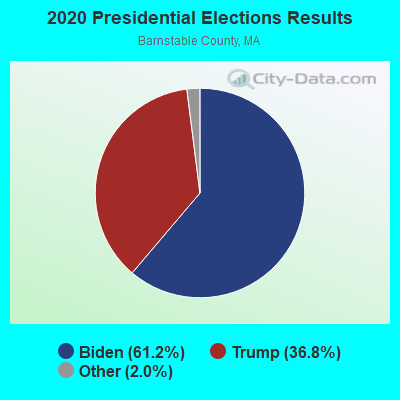
Graphs represent county-level data. Detailed 2008 Election Results
Religion statistics for Yarmouth, MA (based on Barnstable County data)
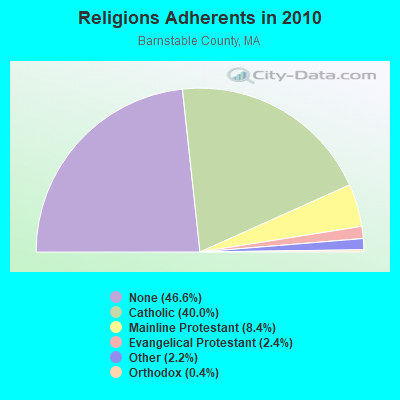
| Religion | Adherents | Congregations |
|---|---|---|
| Catholic | 86,370 | 18 |
| Mainline Protestant | 18,165 | 68 |
| Evangelical Protestant | 5,281 | 46 |
| Other | 4,734 | 32 |
| Orthodox | 810 | 3 |
| None | 100,528 | - |
Food Environment Statistics:
| Here: | 3.06 / 10,000 pop. |
| Massachusetts: | 1.98 / 10,000 pop. |
| Barnstable County: | 0.05 / 10,000 pop. |
| Massachusetts: | 0.05 / 10,000 pop. |
| Barnstable County: | 3.38 / 10,000 pop. |
| Massachusetts: | 2.22 / 10,000 pop. |
| Here: | 2.57 / 10,000 pop. |
| Massachusetts: | 1.77 / 10,000 pop. |
| This county: | 18.60 / 10,000 pop. |
| State: | 8.76 / 10,000 pop. |
| Here: | 7.9% |
| Massachusetts: | 8.1% |
| Barnstable County: | 19.6% |
| Massachusetts: | 22.5% |
| Here: | 13.8% |
| Massachusetts: | 16.5% |
| Businesses in Yarmouth, MA | ||||
| Name | Count | Name | Count | |
|---|---|---|---|---|
| Advance Auto Parts | 1 | UPS | 1 | |
| Goodwill | 1 | Walgreens | 1 | |
Strongest AM radio stations in Yarmouth:
- WBUR (1240 AM; 1 kW; WEST YARMOUTH, MA; Owner: THE EXEC. COMM. OF TRTS. BOSTON U)
- WBZ (1030 AM; 50 kW; BOSTON, MA; Owner: INFINITY BROADCASTING OPERATIONS, INC.)
- WEEI (850 AM; 50 kW; BOSTON, MA; Owner: ENTERCOM BOSTON LICENSE, LLC)
- WRKO (680 AM; 50 kW; BOSTON, MA; Owner: ENTERCOM BOSTON LICENSE, LLC)
- WALE (990 AM; 50 kW; GREENVILLE, RI; Owner: NORTH AMERICAN BROADCASTING CO., INC.)
- WKOX (1200 AM; 50 kW; FRAMINGHAM, MA; Owner: CAPSTAR TX LIMITED PARTNERSHIP)
- WWZN (1510 AM; 50 kW; BOSTON, MA; Owner: ROSE CITY RADIO CORPORATION)
- WBIX (1060 AM; 40 kW; NATICK, MA; Owner: LANGER BROADCASTING CORPORATION)
- WCRN (830 AM; 50 kW; WORCESTER, MA; Owner: CARTER BROADCASTING CORPORATION)
- WAMG (890 AM; 25 kW; DEDHAM, MA; Owner: MEGA COMMUNICATIONS OF DEDHAM LICENSEE, LLC)
- WFPB (1170 AM; daytime; 1 kW; ORLEANS, MA; Owner: UNIVERSITY OF MASSACHUSETTS)
- WNNZ (640 AM; 50 kW; WESTFIELD, MA; Owner: CLEAR CHANNEL BROADCASTING LICENSES, INC.)
- WRCA (1330 AM; 25 kW; WALTHAM, MA; Owner: WRCA LICENSE, LLC)
Strongest FM radio stations in Yarmouth:
- WXTK (95.1 FM; WEST YARMOUTH, MA; Owner: BOCH BROADCASTING LTD. PARTNERSHIP)
- WOCN-FM (103.9 FM; SOUTH YARMOUTH, MA; Owner: SANDAB COMMUNICATIONS LTD. PARTNERSHIP II)
- WCOD-FM (106.1 FM; HYANNIS, MA; Owner: BOCH BROADCASTING, L.P.)
- WPXC (102.9 FM; HYANNIS, MA; Owner: QANTUM OF CAPE COD LICENSE COMPANY, LLC)
- WQRC (99.9 FM; BARNSTABLE, MA; Owner: SANDAB COMMUNICATION LTD. PNR/SHP II)
- WKPE-FM (104.7 FM; ORLEANS, MA; Owner: CRB WKPE LIC CORP.)
- WFCC-FM (107.5 FM; CHATHAM, MA; Owner: CHARLES RIVER B/CING WFCC LIC. CORP.)
- WDVT (93.5 FM; HARWICH PORT, MA; Owner: BOCH BROADCASTING, L.P.)
- WKKL (90.7 FM; WEST BARNSTABLE, MA; Owner: CAPE COD COMMUNITY COLLEGE)
- WCIB (101.9 FM; FALMOUTH, MA; Owner: QANTUM OF CAPE COD LICENSE COMPANY, LLC)
- WCCT-FM (90.3 FM; HARWICH, MA; Owner: CAPE COD REGIONAL TECH HIGH SCHOOL)
- WTWV (101.1 FM; MASHPEE, MA; Owner: BOCH BROADCASTING, L.P.)
- WRZE (96.3 FM; NANTUCKET, MA; Owner: QANTUM OF CAPE COD LICENSE COMPANY, LLC)
- WSDH (91.5 FM; SANDWICH, MA; Owner: SANDWICH MASS. PUBLIC SCHOOLS)
- WFPB-FM (91.9 FM; FALMOUTH, MA; Owner: UNIVERSITY OF MASSACHUSETTS)
TV broadcast stations around Yarmouth:
- WDPX (Channel 58; VINEYARD HAVEN, MA; Owner: PAXSON BOSTON-68 LICENSE, INC.)
- W08CH (Channel 8; HYANNIS, MA; Owner: WGBH EDUCATIONAL FOUNDATION)
- WMPX-LP (Channel 67; DENNIS, MA; Owner: PAXSON BOSTON-68 LICENSE, INC.)
- WLWC (Channel 28; NEW BEDFORD, MA; Owner: C-28 FCC LICENSEE SUBSIDIARY, LLC)
- National Bridge Inventory (NBI) Statistics
- 11Number of bridges
- 115ft / 34.9mTotal length
- $24,840,000Total costs
- 225,565Total average daily traffic
- 11,875Total average daily truck traffic
- 388,350Total future (year 2031) average daily traffic
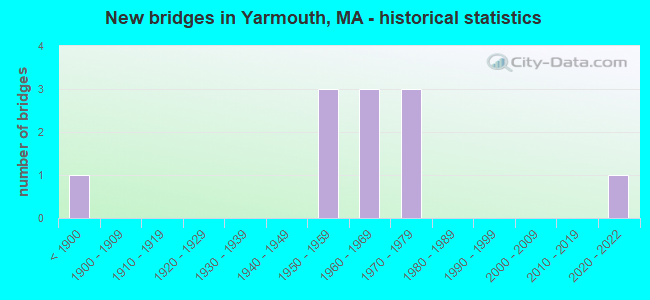
- New bridges - historical statistics
- 1Before 1900
- 31950-1959
- 31960-1969
- 31970-1979
- 12020-2022
FCC Registered Private Land Mobile Towers: 4 (See the full list of FCC Registered Private Land Mobile Towers in Yarmouth, MA)
FCC Registered Broadcast Land Mobile Towers: 10 (See the full list of FCC Registered Broadcast Land Mobile Towers)
FCC Registered Microwave Towers: 3 (See the full list of FCC Registered Microwave Towers in this town)
FCC Registered Paging Towers: 4 (See the full list of FCC Registered Paging Towers)
FCC Registered Maritime Coast & Aviation Ground Towers: 1 (See the full list of FCC Registered Maritime Coast & Aviation Ground Towers)
FCC Registered Amateur Radio Licenses: 10 (See the full list of FCC Registered Amateur Radio Licenses in Yarmouth)
2002 - 2018 National Fire Incident Reporting System (NFIRS) incidents
- Fire incident types reported to NFIRS in Yarmouth, MA
- 4949.0%Structure Fires
- 3131.0%Outside Fires
- 1212.0%Mobile Property/Vehicle Fires
- 88.0%Other
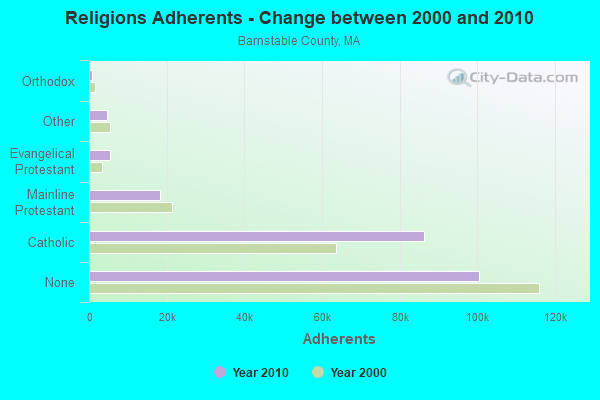
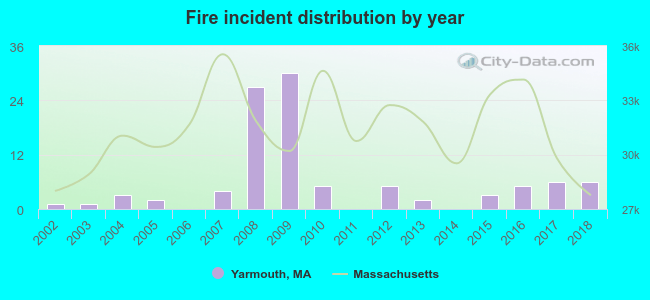 Based on the data from the years 2002 - 2018 the average number of fire incidents per year is 6. The highest number of reported fire incidents - 30 took place in 2009, and the least - 0 in 2006. The data has a growing trend.
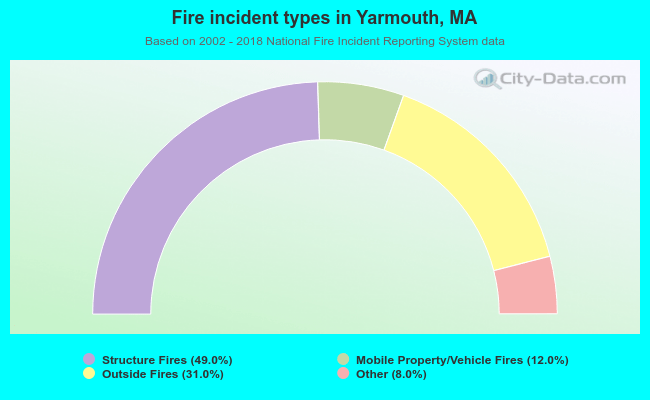 When looking into fire subcategories, the most reports belonged to: Structure Fires (49.0%), and Outside Fires (31.0%).
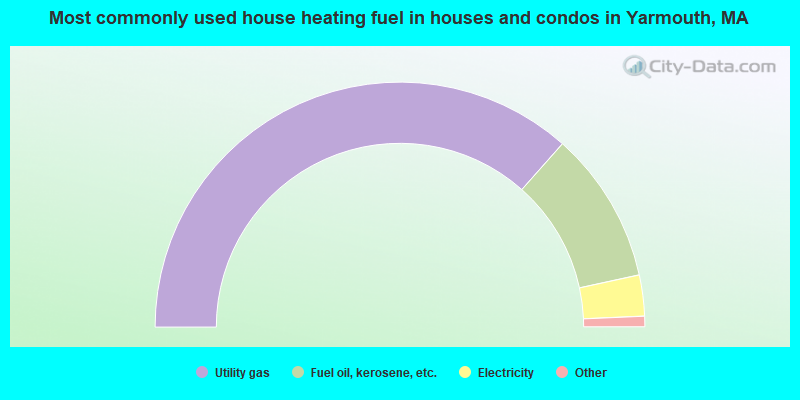
- 73.1%Utility gas
- 20.1%Fuel oil, kerosene, etc.
- 5.4%Electricity
- 0.6%Bottled, tank, or LP gas
- 0.5%Wood
- 0.3%Coal or coke
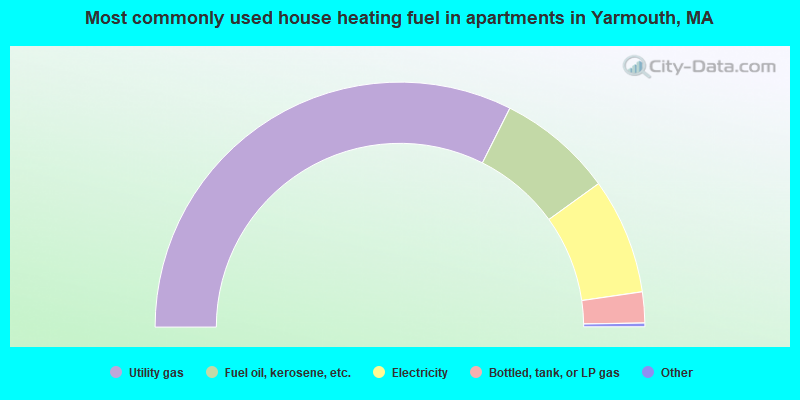
- 64.9%Utility gas
- 15.3%Fuel oil, kerosene, etc.
- 15.3%Electricity
- 4.1%Bottled, tank, or LP gas
- 0.2%Other fuel
- 0.2%Wood
Yarmouth compared to Massachusetts state average:
- Unemployed percentage below state average.
- Black race population percentage significantly below state average.
- Hispanic race population percentage significantly below state average.
- Median age significantly above state average.
- Foreign-born population percentage significantly below state average.
- Renting percentage below state average.
- Length of stay since moving in significantly above state average.
- Number of rooms per house significantly below state average.
- House age significantly below state average.
- Number of college students below state average.
Yarmouth on our top lists:
- #23 on the list of "Top 101 cities with largest percentage of females in industries: health care (population 5,000+)"
- #27 on the list of "Top 101 cities with largest percentage of males in occupations: cashiers (population 5,000+)"
- #31 on the list of "Top 101 cities with largest percentage of males in occupations: painters and paperhangers (population 5,000+)"
- #39 on the list of "Top 101 cities with largest percentage of males in industries: gasoline stations (population 5,000+)"
- #44 on the list of "Top 101 cities with largest percentage of males in occupations: food processing workers (population 5,000+)"
- #47 on the list of "Top 101 cities with largest percentage of females in occupations: information and record clerks except customer service representatives (population 5,000+)"
- #55 on the list of "Top 101 cities with largest percentage of males in occupations: carpenters (population 5,000+)"
- #59 on the list of "Top 101 cities with largest percentage of males in occupations: special education teachers (population 5,000+)"
- #62 on the list of "Top 101 cities with largest percentage of males in industries: vending machine operators (population 5,000+)"
- #71 on the list of "Top 101 cities with the largest percentage of people in other workers' dormitories (population 1,000+)"
- #75 on the list of "Top 100 high-educated but low-earning cities (pop. 5,000+)"
- #93 on the list of "Top 101 cities with largest percentage of males in industries: music stores (population 5,000+)"
- #93 on the list of "Top 101 cities with the most residents born in Brazil (population 500+)"
- #1 on the list of "Top 101 counties with the highest percentage of residents that smoked 100+ cigarettes in their lives"
- #7 on the list of "Top 101 counties with the lowest number of births per 1000 residents 2007-2013"
- #9 on the list of "Top 101 counties with the highest percentage of residents that visited a dentist within the past year"
- #10 on the list of "Top 101 counties with the lowest average weight of females"
- #24 on the list of "Top 101 counties with the largest number of people without health insurance coverage in 2000 (pop. 50,000+)"

|
Total of 5 patent applications in 2008-2024.