Races in Wheatland, Wisconsin (WI) Detailed Stats
Ancestries, Foreign-born residents, place of birth

Recent posts about races in Wheatland, Wisconsin on our local forum with over 2,400,000 registered users:
 | Tornados and 60 degrees in January (13 replies) |
1.5% of Wheatland, WI residents are foreign-born , which is 242.9% less than the foreign-born rate of 5.0% across the entire state of Wisconsin.
Race distribution in Wheatland

- 3,20797.4%White alone
- 321.0%Hispanic
- 220.7%Two or more races
- 160.5%Black alone
- 80.2%Asian alone
- 70.2%American Indian alone

2000
2022
-
- 4,681,63087.3%White alone
- 300,2455.6%Black alone
- 192,9213.6%Hispanic
- 87,9951.6%Asian alone
- 51,9211.0%Two or more races
- 43,9800.8%American Indian alone
- 3,6370.07%Other race alone
- 1,3460.03%Native Hawaiian and Other
Pacific Islander alone

-
- 4,654,03179.0%White alone
- 447,0227.6%Hispanic
- 345,6785.9%Black alone
- 217,5323.7%Two or more races
- 172,2422.9%Asian alone
- 33,7620.6%American Indian alone
- 19,6800.3%Other race alone
- 2,5920.04%Native Hawaiian and Other
Pacific Islander alone

Income and house value in Wheatland
- Median household income in 2022
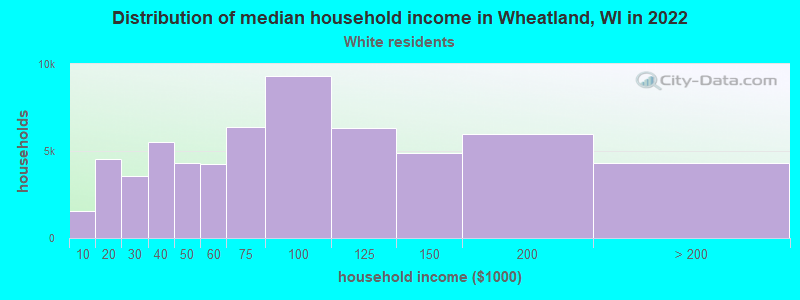
- $82,279White non-Hispanic householders
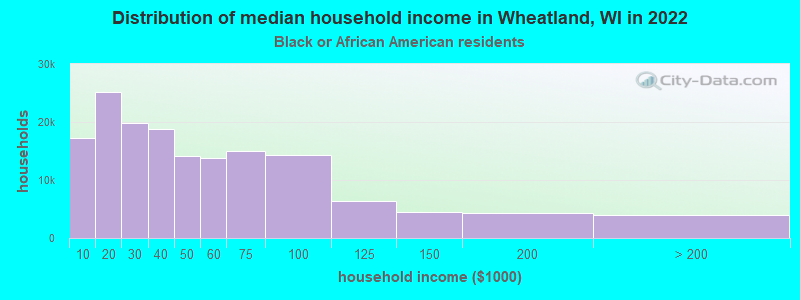
- $44,649Black householders
- $54,294Some other race householders
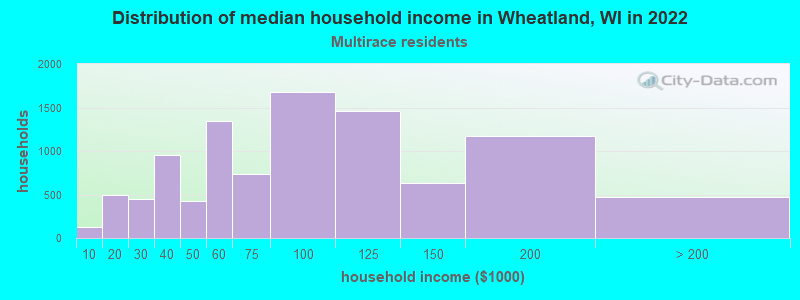
- $166,537Two or more races householders
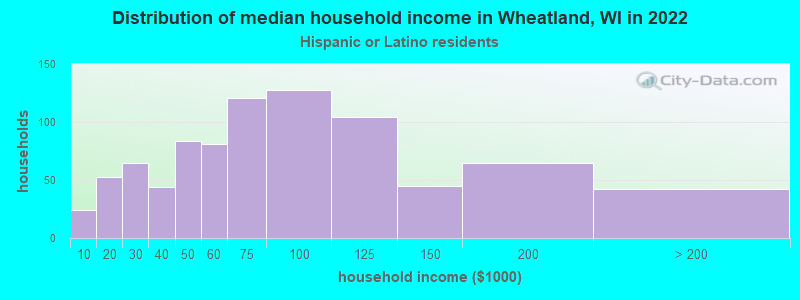
- $8,857Hispanic or Latino race householders
- Median 2022 house value
- $295,614White Non-Hispanic householders
- $348,096Black or African American householders
- $287,902Two or more races householders
Household income for White non-Hispanic householders
Household income for Black householders
Household income for Two or more races householders
Household income for Hispanic or Latino race householders
Foreign-born residents in Wheatland
48 residents are foreign born
| This city: | 1.5% |
| Wisconsin: | 3.6% |
Ancestries in Wheatland

- 1,57536.5%German
- 53212.3%Irish
- 3347.7%Polish
- 2936.8%English
- 2916.7%Other
- 2415.6%United States
- 2124.9%Italian
- 1553.6%French
- 1052.4%Swedish
- 1042.4%Dutch
- 831.9%Czech
- 611.4%Norwegian
- 531.2%French Canadian
- 521.2%Lithuanian
- 491.1%Scotch-Irish
- 360.8%Hungarian
- 310.7%Danish
- 290.7%Welsh
- 240.6%Swiss
- 160.4%Scottish
- 150.3%Russian
- 130.3%Slovak
- 90.2%Greek
- 40.09%Ukrainian

Zip codes: 53105.