Races in Southgate, Michigan (MI) Detailed Stats
Data:
Races - White alone (%)
Races - White alone (% change since 2000)
Races - Black alone (%)
Races - Black alone (% change since 2000)
Races - American Indian alone (%)
Races - American Indian alone (% change since 2000)
Races - Asian alone (%)
Races - Asian alone (% change since 2000)
Races - Hispanic (%)
Races - Hispanic (% change since 2000)
Races - Native Hawaiian and Other Pacific Islander alone (%)
Races - Native Hawaiian and Other Pacific Islander alone (% change since 2000)
Races - Two or more races(%)
Races - Two or more races(% change since 2000)
Races - Other race alone (%)
Races - Other race alone (% change since 2000)
Racial diversity
Place of birth - Born in state of residence (%)
Place of birth - Born in state of residence (%) - White
Place of birth - Born in state of residence (%) - Black or African American
Place of birth - Born in state of residence (%) - Asian
Place of birth - Born in state of residence (%) - Hispanic or Latino
Place of birth - Born in state of residence (%) - American Indian and Alaska Native
Place of birth - Born in state of residence (%) - Multirace
Place of birth - Born in state of residence (%) - Other Race
Place of birth - Born in other state (%)
Place of birth - Born in other state (%) - White
Place of birth - Born in other state (%) - Black or African American
Place of birth - Born in other state (%) - Asian
Place of birth - Born in other state (%) - Hispanic or Latino
Place of birth - Born in other state (%) - American Indian and Alaska Native
Place of birth - Born in other state (%) - Multirace
Place of birth - Born in other state (%) - Other Race
Place of birth - Native, outside of US (%)
Place of birth - Native, outside of US (%) - White
Place of birth - Native, outside of US (%) - Black or African American
Place of birth - Native, outside of US (%) - Asian
Place of birth - Native, outside of US (%) - Hispanic or Latino
Place of birth - Native, outside of US (%) - American Indian and Alaska Native
Place of birth - Native, outside of US (%) - Multirace
Place of birth - Native, outside of US (%) - Other Race
Place of birth - Foreign born (%)
Place of birth - Foreign born (%) - White
Place of birth - Foreign born (%) - Black or African American
Place of birth - Foreign born (%) - Asian
Place of birth - Foreign born (%) - Hispanic or Latino
Place of birth - Foreign born (%) - American Indian and Alaska Native
Place of birth - Foreign born (%) - Multirace
Place of birth - Foreign born (%) - Other Race
Residents speaking English at home (%)
Residents speaking English at home - Born in the United States (%)
Residents speaking English at home - Native, born elsewhere (%)
Residents speaking English at home - Foreign born (%)
Residents speaking Spanish at home (%)
Residents speaking Spanish at home - Born in the United States (%)
Residents speaking Spanish at home - Native, born elsewhere (%)
Residents speaking Spanish at home - Foreign born (%)
Residents speaking other language at home (%)
Residents speaking other language at home - Born in the United States (%)
Residents speaking other language at home - Native, born elsewhere (%)
Residents speaking other language at home - Foreign born (%)
Marital status - Never married (%)
Marital status - Now married (%)
Marital status - Separated (%)
Marital status - Widowed (%)
Marital status - Divorced (%)
Ancestries Reported - Arab (%)
Ancestries Reported - Czech (%)
Ancestries Reported - Danish (%)
Ancestries Reported - Dutch (%)
Ancestries Reported - English (%)
Ancestries Reported - French (%)
Ancestries Reported - French Canadian (%)
Ancestries Reported - German (%)
Ancestries Reported - Greek (%)
Ancestries Reported - Hungarian (%)
Ancestries Reported - Irish (%)
Ancestries Reported - Italian (%)
Ancestries Reported - Lithuanian (%)
Ancestries Reported - Norwegian (%)
Ancestries Reported - Polish (%)
Ancestries Reported - Portuguese (%)
Ancestries Reported - Russian (%)
Ancestries Reported - Scotch-Irish (%)
Ancestries Reported - Scottish (%)
Ancestries Reported - Slovak (%)
Ancestries Reported - Subsaharan African (%)
Ancestries Reported - Swedish (%)
Ancestries Reported - Swiss (%)
Ancestries Reported - Ukrainian (%)
Ancestries Reported - United States (%)
Ancestries Reported - Welsh (%)
Ancestries Reported - West Indian (%)
Ancestries Reported - Other (%)
Geographical mobility - Same house 1 year ago (%)
Geographical mobility - Same house 1 year ago (%) - White
Geographical mobility - Same house 1 year ago (%) - Black or African American
Geographical mobility - Same house 1 year ago (%) - Asian
Geographical mobility - Same house 1 year ago (%) - Hispanic or Latino
Geographical mobility - Same house 1 year ago (%) - American Indian and Alaska Native
Geographical mobility - Same house 1 year ago (%) - Multirace
Geographical mobility - Same house 1 year ago (%) - Other Race
Geographical mobility - Moved within same county (%)
Geographical mobility - Moved within same county (%) - White
Geographical mobility - Moved within same county (%) - Black or African American
Geographical mobility - Moved within same county (%) - Asian
Geographical mobility - Moved within same county (%) - Hispanic or Latino
Geographical mobility - Moved within same county (%) - American Indian and Alaska Native
Geographical mobility - Moved within same county (%) - Multirace
Geographical mobility - Moved within same county (%) - Other Race
Geographical mobility - Moved from different county within same state (%)
Geographical mobility - Moved from different county within same state (%) - White
Geographical mobility - Moved from different county within same state (%) - Black or African American
Geographical mobility - Moved from different county within same state (%) - Asian
Geographical mobility - Moved from different county within same state (%) - Hispanic or Latino
Geographical mobility - Moved from different county within same state (%) - American Indian and Alaska Native
Geographical mobility - Moved from different county within same state (%) - Multirace
Geographical mobility - Moved from different county within same state (%) - Other Race
Geographical mobility - Moved from different state (%)
Geographical mobility - Moved from different state (%) - White
Geographical mobility - Moved from different state (%) - Black or African American
Geographical mobility - Moved from different state (%) - Asian
Geographical mobility - Moved from different state (%) - Hispanic or Latino
Geographical mobility - Moved from different state (%) - American Indian and Alaska Native
Geographical mobility - Moved from different state (%) - Multirace
Geographical mobility - Moved from different state (%) - Other Race
Geographical mobility - Moved from abroad (%)
Geographical mobility - Moved from abroad (%) - White
Geographical mobility - Moved from abroad (%) - Black or African American
Geographical mobility - Moved from abroad (%) - Asian
Geographical mobility - Moved from abroad (%) - Hispanic or Latino
Geographical mobility - Moved from abroad (%) - American Indian and Alaska Native
Geographical mobility - Moved from abroad (%) - Multirace
Geographical mobility - Moved from abroad (%) - Other Race
Place of birth for the foreign-born population - Ireland (%)
Place of birth for the foreign-born population - Denmark (%)
Place of birth for the foreign-born population - Norway (%)
Place of birth for the foreign-born population - Sweden (%)
Place of birth for the foreign-born population - United Kingdom (%)
Place of birth for the foreign-born population - England (%)
Place of birth for the foreign-born population - Scotland (%)
Place of birth for the foreign-born population - Other Northern Europe (%)
Place of birth for the foreign-born population - Austria (%)
Place of birth for the foreign-born population - Belgium (%)
Place of birth for the foreign-born population - France (%)
Place of birth for the foreign-born population - Germany (%)
Place of birth for the foreign-born population - Netherlands (%)
Place of birth for the foreign-born population - Switzerland (%)
Place of birth for the foreign-born population - Other Western Europe (%)
Place of birth for the foreign-born population - Greece (%)
Place of birth for the foreign-born population - Italy (%)
Place of birth for the foreign-born population - Portugal (%)
Place of birth for the foreign-born population - Spain (%)
Place of birth for the foreign-born population - Other Southern Europe (%)
Place of birth for the foreign-born population - Albania (%)
Place of birth for the foreign-born population - Belarus (%)
Place of birth for the foreign-born population - Bosnia and Herzegovina (%)
Place of birth for the foreign-born population - Bulgaria (%)
Place of birth for the foreign-born population - Croatia (%)
Place of birth for the foreign-born population - Czechoslovakia (%)
Place of birth for the foreign-born population - Hungary (%)
Place of birth for the foreign-born population - Latvia (%)
Place of birth for the foreign-born population - Lithuania (%)
Place of birth for the foreign-born population - North Macedonia (Macedonia) (%)
Place of birth for the foreign-born population - Moldova (%)
Place of birth for the foreign-born population - Poland (%)
Place of birth for the foreign-born population - Romania (%)
Place of birth for the foreign-born population - Russia (%)
Place of birth for the foreign-born population - Serbia (%)
Place of birth for the foreign-born population - Ukraine (%)
Place of birth for the foreign-born population - Other Eastern Europe (%)
Place of birth for the foreign-born population - China (%)
Place of birth for the foreign-born population - Hong Kong (%)
Place of birth for the foreign-born population - Taiwan (%)
Place of birth for the foreign-born population - Japan (%)
Place of birth for the foreign-born population - Korea (%)
Place of birth for the foreign-born population - Other Eastern Asia (%)
Place of birth for the foreign-born population - Afghanistan (%)
Place of birth for the foreign-born population - Bangladesh (%)
Place of birth for the foreign-born population - India (%)
Place of birth for the foreign-born population - Iran (%)
Place of birth for the foreign-born population - Kazakhstan (%)
Place of birth for the foreign-born population - Nepal (%)
Place of birth for the foreign-born population - Pakistan (%)
Place of birth for the foreign-born population - Sri Lanka (%)
Place of birth for the foreign-born population - Uzbekistan (%)
Place of birth for the foreign-born population - Other South Central Asia (%)
Place of birth for the foreign-born population - Burma (%)
Place of birth for the foreign-born population - Cambodia (%)
Place of birth for the foreign-born population - Indonesia (%)
Place of birth for the foreign-born population - Laos (%)
Place of birth for the foreign-born population - Malaysia (%)
Place of birth for the foreign-born population - Philippines (%)
Place of birth for the foreign-born population - Singapore (%)
Place of birth for the foreign-born population - Thailand (%)
Place of birth for the foreign-born population - Vietnam (%)
Place of birth for the foreign-born population - Other South Eastern Asia (%)
Place of birth for the foreign-born population - Armenia (%)
Place of birth for the foreign-born population - Iraq (%)
Place of birth for the foreign-born population - Israel (%)
Place of birth for the foreign-born population - Jordan (%)
Place of birth for the foreign-born population - Kuwait (%)
Place of birth for the foreign-born population - Lebanon (%)
Place of birth for the foreign-born population - Saudi Arabia (%)
Place of birth for the foreign-born population - Syria (%)
Place of birth for the foreign-born population - Turkey (%)
Place of birth for the foreign-born population - Yemen (%)
Place of birth for the foreign-born population - Other Western Asia (%)
Place of birth for the foreign-born population - Eritrea (%)
Place of birth for the foreign-born population - Ethiopia (%)
Place of birth for the foreign-born population - Kenya (%)
Place of birth for the foreign-born population - Somalia (%)
Place of birth for the foreign-born population - Uganda (%)
Place of birth for the foreign-born population - Zimbabwe (%)
Place of birth for the foreign-born population - Other Eastern Africa (%)
Place of birth for the foreign-born population - Cameroon (%)
Place of birth for the foreign-born population - Congo (%)
Place of birth for the foreign-born population - Democratic Republic of Congo (Zaire) (%)
Place of birth for the foreign-born population - Other Middle Africa (%)
Place of birth for the foreign-born population - Egypt (%)
Place of birth for the foreign-born population - Morocco (%)
Place of birth for the foreign-born population - Sudan (%)
Place of birth for the foreign-born population - Other Northern Africa (%)
Place of birth for the foreign-born population - South Africa (%)
Place of birth for the foreign-born population - Other Southern Africa (%)
Place of birth for the foreign-born population - Cabo Verde (%)
Place of birth for the foreign-born population - Ghana (%)
Place of birth for the foreign-born population - Liberia (%)
Place of birth for the foreign-born population - Nigeria (%)
Place of birth for the foreign-born population - Senegal (%)
Place of birth for the foreign-born population - Sierra Leone (%)
Place of birth for the foreign-born population - Other Western Africa (%)
Place of birth for the foreign-born population - Australia (%)
Place of birth for the foreign-born population - New Zealand (%)
Place of birth for the foreign-born population - Fiji (%)
Place of birth for the foreign-born population - Micronesia (%)
Place of birth for the foreign-born population - Bahamas (%)
Place of birth for the foreign-born population - Barbados (%)
Place of birth for the foreign-born population - Cuba (%)
Place of birth for the foreign-born population - Dominica (%)
Place of birth for the foreign-born population - Dominican Republic (%)
Place of birth for the foreign-born population - Grenada (%)
Place of birth for the foreign-born population - Haiti (%)
Place of birth for the foreign-born population - Jamaica (%)
Place of birth for the foreign-born population - St. Vincent and the Grenadines (%)
Place of birth for the foreign-born population - Trinidad and Tobago (%)
Place of birth for the foreign-born population - West Indies (%)
Place of birth for the foreign-born population - Other Caribbean (%)
Place of birth for the foreign-born population - Belize (%)
Place of birth for the foreign-born population - Costa Rica (%)
Place of birth for the foreign-born population - El Salvador (%)
Place of birth for the foreign-born population - Guatemala (%)
Place of birth for the foreign-born population - Honduras (%)
Place of birth for the foreign-born population - Mexico (%)
Place of birth for the foreign-born population - Nicaragua (%)
Place of birth for the foreign-born population - Panama (%)
Place of birth for the foreign-born population - Other Central America (%)
Place of birth for the foreign-born population - Argentina (%)
Place of birth for the foreign-born population - Bolivia (%)
Place of birth for the foreign-born population - Brazil (%)
Place of birth for the foreign-born population - Chile (%)
Place of birth for the foreign-born population - Colombia (%)
Place of birth for the foreign-born population - Ecuador (%)
Place of birth for the foreign-born population - Guyana (%)
Place of birth for the foreign-born population - Peru (%)
Place of birth for the foreign-born population - Uruguay (%)
Place of birth for the foreign-born population - Venezuela (%)
Place of birth for the foreign-born population - Other South America (%)
Place of birth for the foreign-born population - Canada (%)
Place of birth for the foreign-born population - Other Northern America (%)
Place of birth for the foreign-born population - Other (%)
Latest news about races in Southgate, MI collected exclusively by city-data.com from local newspapers, TV, and radio stations
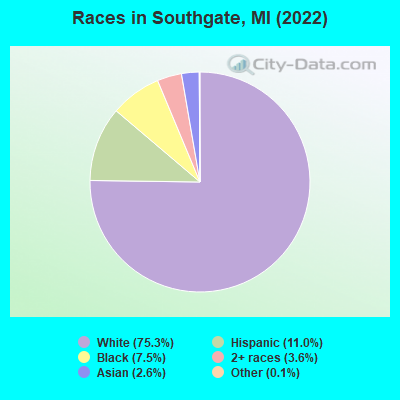
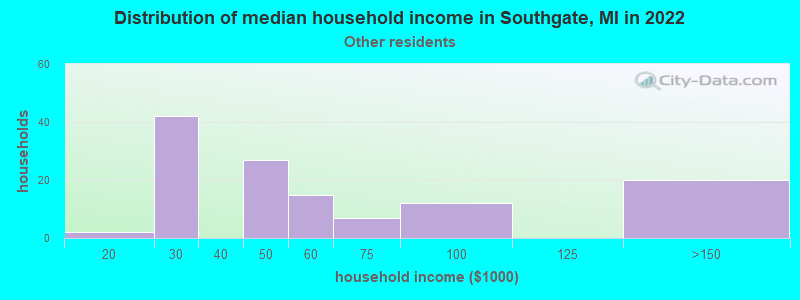
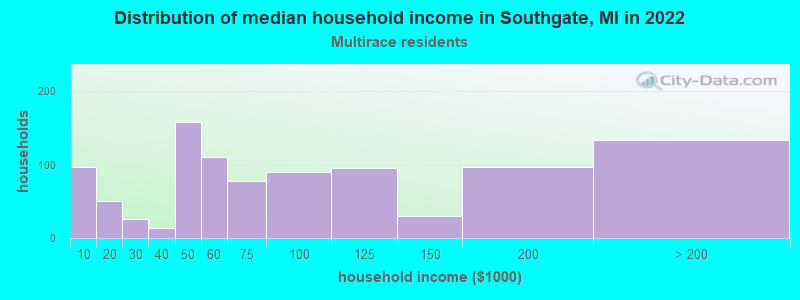
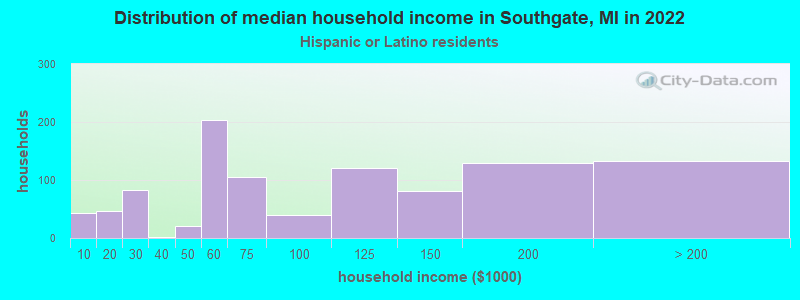
According to 2022 data, the most numerous races in Southgate, MI are White alone (22,230 residents), Black alone (2,227 residents), and Hispanic (3,252 residents). 89.9% of Southgate residents speak English at home. 6.2% of Southgate, MI residents are foreign-born (2.1% born in Europe, 1.9% born in Asia, 1.0% born in Latin America, 0.6% born in North America), which is 3.9% greater than the foreign-born rate of 6.0% across the entire state of Michigan.
Race distribution in Southgate
2000 2022
7,806,691 78.6% White alone 1,402,047 14.1% Black alone 323,877 3.3% Hispanic 175,311 1.8% Asian alone 163,487 1.6% Two or more races 53,421 0.5% American Indian alone 11,465 0.1% Other race alone 2,145 0.02% Native Hawaiian and Other
7,289,051 72.6% White alone 1,310,464 13.1% Black alone 572,405 5.7% Hispanic 450,031 4.5% Two or more races 335,732 3.3% Asian alone 45,217 0.5% Other race alone 29,011 0.3% American Indian alone 2,207 0.02% Native Hawaiian and Other
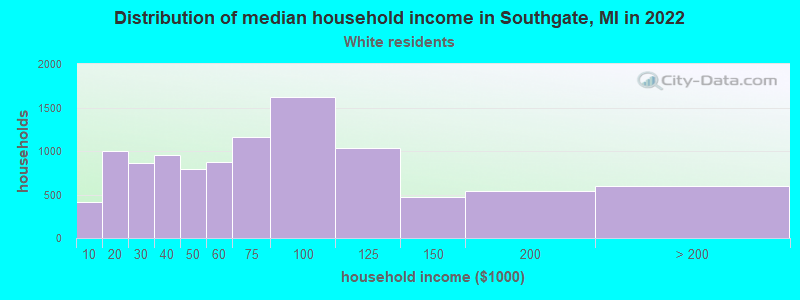
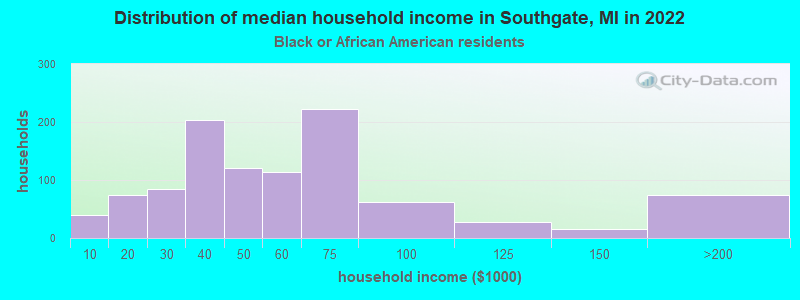
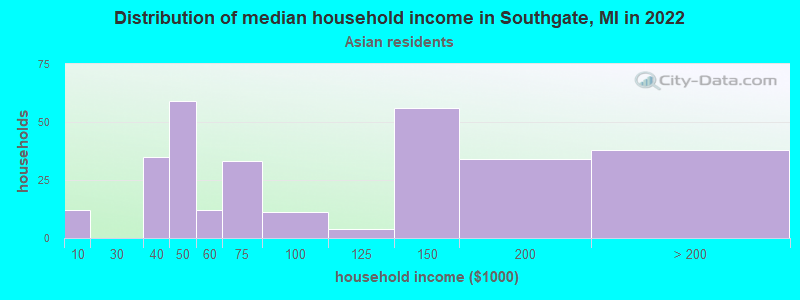
Income and house value in Southgate Median household income in 2022 $63,748 White non-Hispanic householders$48,031 Black householders$119,767 Asian householders$45,332 Some other race householders$68,645 Two or more races householders$103,285 Hispanic or Latino race householdersMedian 2022 house value $167,024 White Non-Hispanic householders$197,420 Black or African American householders$165,796 American Indian or Alaska Native householders $226,434 Asian householders$168,866 Some other race householders$155,510 Two or more races householders$182,529 Hispanic or Latino householders
Median age by race in Southgate
44.6 Median age for White residents41.3 48.6 30.6 Median age for Black or African American residents32.5 29.3 -738,693,466.6 Median age for American Indian / Alaska Native residents-795,074,757.3 -684,380,031.5 39.1 Median age for Asian residents32.7 40.9 -934,108,526.2 Median age for Native Hawaiian / Pacific Islander residents-674,772,035.8 -699,588,476.7 32.2 Median age for Other race residents31.8 31.7 26.3 Median age for Two or more races residents26.3 26.9 45.2 Median age for White alone residents42.5 49.1 29.7 Median age for Hispanic or Latino residents29.6 30.3
Owner/renter occupied households by race in Southgate
House owners and renters - White residents 7,638 74.4% Owner occupied2,622 25.6% Renter occupiedHouse owners and renters - Black or African American residents 215 20.8% Owner occupied817 79.2% Renter occupiedHouse owners and renters - American Indian / Alaska Native residents 34 100.0% Owner occupiedHouse owners and renters - Asian residents 188 66.8% Owner occupied94 33.2% Renter occupiedHouse owners and renters - Other race residents 37 29.9% Owner occupied87 70.1% Renter occupiedHouse owners and renters - Two or more races residents 672 70.2% Owner occupied286 29.8% Renter occupiedHouse owners and renters - White alone residents 7,466 74.5% Owner occupied2,550 25.5% Renter occupiedHouse owners and renters - Hispanic or Latino residents 759 75.7% Owner occupied243 24.3% Renter occupied
Language usage in Southgate
English speakers - Total 89.9% of residents of Southgate speak English at home.
3.2% of residents speak Spanish at home 633 70.7% Speak English very well262 29.3% Speak English less than very well6.7% of residents speak other language at home 1,101 59.1% Speak English very well761 40.9% Speak English less than very well
English speakers - Born in the United States 92.9% of residents of Southgate speak English at home.
4.4% of residents speak Spanish at home 103 66.0% Speak English very well53 34.0% Speak English less than very well3.0% of residents speak other language at home 64 60.4% Speak English very well42 39.6% Speak English less than very well
English speakers - Native, born elsewhere 95.1% of residents of Southgate speak English at home.
30.5% of residents speak Spanish at home 5 20.0% Speak English very well20 80.0% Speak English less than very well
English speakers - Foreign-born 18.4% of residents of Southgate speak English at home.
13.9% of residents speak Spanish at home 149 56.9% Speak English very well113 43.1% Speak English less than very well67.0% of residents speak other language at home 567 44.8% Speak English very well698 55.2% Speak English less than very well
White (Caucasian) - Speak only English Native:
98.2% (20,260)Foreign-born:
21.8% (250)
White (Caucasian) - Speak another language Native:
2.6% (534)Foreign-born:
78.4% (898)
Black or African American - Speak only English Native:
99.1% (2,011)Foreign-born:
18.3% (6)
Black or African American - Speak another language Native:
0.9% (19)Foreign-born:
79.9% (27)
Asian - Speak only English Native:
38.6% (142)Foreign-born:
22.9% (109)
Asian - Speak another language Native:
62.0% (229)Foreign-born:
78.5% (372)
Other race - Speak another language Native:
29.6% (143)Foreign-born:
100.0% (107)
Two or more races - Speak another language Native:
19.1% (497)Foreign-born:
100.0% (123)
White alone - Speak only English Native:
98.0% (19,596)Foreign-born:
22.6% (254)
White alone - Speak another language Native:
2.4% (485)Foreign-born:
77.1% (868)
Hispanic or Latino - Speak another language Native:
22.0% (603)Foreign-born:
100.0% (258)
Foreign-born residents in Southgate 1,844 residents are foreign born (2.1% Europe , 1.9% Asia , 1.0% Latin America , 0.6% North America ).
This city:
6.2%Michigan:
6.9%
Marital status for residents in Southgate Marital status - White (Caucasian) population 15 years and over
Males 38.4% Never married46.4% Now married0.8% Separated4.1% Widowed10.4% DivorcedFemales 23.5% Never married47.2% Now married1.8% Separated12.3% Widowed15.2% DivorcedWomen who gave birth in the past 12 months Now married:
87.6% (139)Unmarried:
12.4% (20)
Women who did not give birth in the past 12 months Now married:
42.5% (1,895)Unmarried:
57.5% (2,566)
Marital status - Black or African American population 15 years and over
Males 53.5% Never married35.3% Now married0.1% Separated1.4% Widowed9.6% DivorcedFemales 61.2% Never married26.3% Now married0.0% Separated4.8% Widowed7.8% DivorcedWomen who did not give birth in the past 12 months Now married:
29.4% (212)Unmarried:
70.6% (509)
Marital status - Asian population 15 years and over
Males 27.6% Never married72.4% Now married0.0% Separated0.0% Widowed0.0% DivorcedFemales 24.3% Never married61.2% Now married0.0% Separated0.0% Widowed14.5% DivorcedWomen who did not give birth in the past 12 months Now married:
62.3% (116)Unmarried:
37.7% (70)
Marital status - Other race population 15 years and over
Males 76.5% Never married16.1% Now married0.0% Separated0.0% Widowed7.4% DivorcedFemales 55.4% Never married33.3% Now married6.7% Separated2.2% Widowed2.2% DivorcedWomen who gave birth in the past 12 months Now married:
0.0% (0)Unmarried:
100.0% (57)
Women who did not give birth in the past 12 months Now married:
51.0% (135)Unmarried:
49.0% (129)
Marital status - Two or more races population 15 years and over
Males 43.0% Never married43.4% Now married0.0% Separated6.1% Widowed7.5% DivorcedFemales 47.6% Never married34.7% Now married0.0% Separated9.2% Widowed8.6% DivorcedWomen who gave birth in the past 12 months Now married:
0.0% (0)Unmarried:
100.0% (11)
Women who did not give birth in the past 12 months Now married:
34.6% (249)Unmarried:
65.4% (470)
Marital status - White alone, not Hispanic / Latino population 15 years and over
Males 37.0% Never married47.5% Now married0.5% Separated4.3% Widowed10.6% DivorcedFemales 22.4% Never married47.7% Now married1.7% Separated12.4% Widowed15.8% DivorcedWomen who gave birth in the past 12 months Now married:
95.5% (142)Unmarried:
4.5% (7)
Women who did not give birth in the past 12 months Now married:
42.7% (1,830)Unmarried:
57.3% (2,455)
Marital status - Hispanic or Latino population 15 years and over
Males 49.4% Never married38.7% Now married2.9% Separated3.6% Widowed5.5% DivorcedFemales 48.4% Never married38.1% Now married2.7% Separated7.7% Widowed3.1% DivorcedWomen who gave birth in the past 12 months Now married:
0.0% (0)Unmarried:
100.0% (69)
Women who did not give birth in the past 12 months Now married:
42.6% (375)Unmarried:
57.4% (507)
Ancestries in Southgate
1,124 8.9% Polish884 7.0% American881 7.0% Italian841 6.7% German791 6.3% Irish710 5.6% English391 3.1% Greek387 3.1% Scotch-Irish298 2.4% Hungarian245 1.9% European193 1.5% Scottish167 1.3% African143 1.1% French Canadian125 1.0% Albanian99 0.8% Dutch66 0.5% Lithuanian64 0.5% French61 0.5% Iranian59 0.5% Romanian51 0.4% Pennsylvania German49 0.4% Maltese39 0.3% British38 0.3% Eastern European35 0.3% Slovak33 0.3% Portuguese32 0.3% Armenian30 0.2% Lebanese28 0.2% Canadian28 0.2% Assyrian26 0.2% Norwegian23 0.2% Ukrainian21 0.2% Czech20 0.2% Brazilian19 0.2% Egyptian14 0.1% Welsh11 0.09% Finnish11 0.09% Belgian11 0.09% Scandinavian11 0.09% Serbian9 0.07% Croatian8 0.06% Russian4 0.03% Arab3 0.02% Czechoslovakian2 0.02% Austrian
Geographical mobility in Southgate Same house 1 year ago 20,777 91.7% White (Caucasian)1,162 51.4% Black or African American39 100.0% American Indian / Alaska Native806 95.2% Asian540 93.1% Other race2,146 72.8% Two or more races20,231 92.0% White alone, not Hispanic / Latino2,474 77.6% Hispanic or LatinoMoved within same county 1,297 5.7% White / Caucasian938 41.5% Black or African American27 4.6% Other race735 24.9% Two or more races1,291 5.9% White alone, not Hispanic / Latino561 17.6% Hispanic or LatinoMoved within same state 248 1.1% White / Caucasian50 6.0% Asian40 1.4% Two or more races203 0.9% White alone, not Hispanic / Latino79 2.5% Hispanic or LatinoMoved from different state 229 1.0% White / Caucasian67 3.0% Black or African American149 0.7% White alone, not Hispanic / Latino91 2.9% Hispanic or LatinoMoved from abroad 41 0.2% White29 1.0% Two or more races43 0.2% White alone, not Hispanic / Latino
Children Nativity (place of birth) in Southgate
Children under 6 years - Living with two parents Both parents native 922 100.0% NativeBoth parents foreign-born 54 100.0% NativeOne native, one foreign-born parent 105 100.0% NativeChildren under 6 years - Living with one parent Native parent 724 100.0% NativeForeign-born parent 7 100.0% NativeChildren 6 to 17 years - Living with two parents Both parents native 2,102 100.0% Native0 0.0% Foreign-bornBoth parents foreign-born 114 91.5% Native11 8.5% Foreign-bornOne native, one foreign-born parent 196 100.0% NativeChildren 6 to 17 years - Living with one parent Native parent 1,178 100.0% NativeForeign-born parent 82 51.4% Native77 48.6% Foreign-born
Grandparents responsible for own grandchildren in Southgate
Grandparents (30 to 59 years) White / Caucasian 98 56.0% Responsible for grandchildren77 44.0% Not responsible for grandchildrenBlack or African American 21 100.0% Responsible for grandchildrenAsian 15 100.0% Not responsible for grandchildrenTwo or more races 31 100.0% Not responsible for grandchildrenWhite alone, not Hispanic / Latino 98 54.5% Responsible for grandchildren82 45.5% Not responsible for grandchildrenHispanic or Latino 13 100.0% Not responsible for grandchildrenGrandparents (60 years and over) White / Caucasian 88 47.3% Responsible for grandchildren98 52.7% Not responsible for grandchildrenAsian 26 66.3% Responsible for grandchildren13 33.7% Not responsible for grandchildrenTwo or more races 18 100.0% Not responsible for grandchildrenWhite alone, not Hispanic / Latino 82 44.7% Responsible for grandchildren102 55.3% Not responsible for grandchildrenHispanic or Latino 7 100.0% Responsible for grandchildren