Estimated zip code population in 2022: 29,877 Zip code population in 2010: 30,047 Zip code population in 2000: 30,136
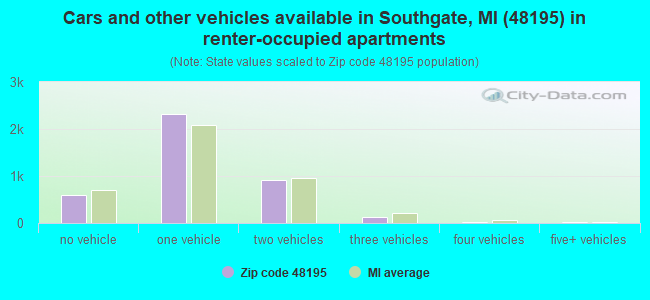
Houses and condos: 13,248 Renter-occupied apartments: 3,998
% of renters here:
31%
State:
27%
March 2022 cost of living index in zip code 48195: 95.3 (near average, U.S. average is 100)
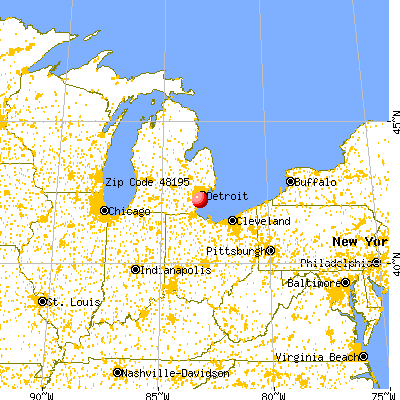
Land area: 6.8 sq. mi. Water area: 0.0 sq. mi.
Population density: 4,379 people per square mile
(average).
OSM Map
General Map
Google Map
MSN Map
OSM Map
General Map
Google Map
MSN Map
OSM Map
General Map
Google Map
MSN Map
OSM Map
General Map
Google Map
MSN Map
Please wait while loading the map...
Real estate property taxes paid for housing units in 2022:
This zip code:
1.8% ($3,008)
Michigan:
1.2% ($2,746)
Median real estate property taxes paid for housing units with mortgages in 2022: $3,067 (1.8%) Median real estate property taxes paid for housing units with no mortgage in 2022: $2,955 (1.7%)
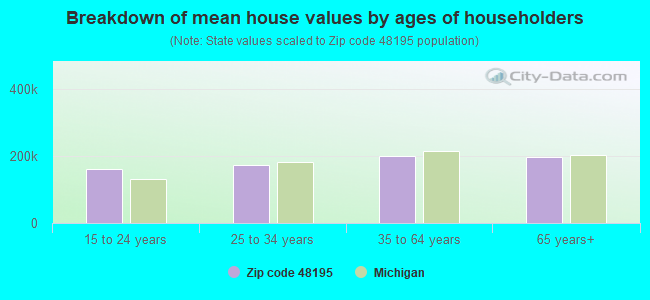
Estimated median house/condo value in 2022: $170,057
48195:
$170,057
Michigan:
$224,400
According to our research of Michigan and other state lists, there were 64 registered sex offenders living in 48195 zip code as of May 25, 2024. The ratio of all residents to sex offenders in zip code 48195 is 465 to 1. The ratio of registered sex offenders to all residents in this zip code is lower than the state average.
Median resident age:
This zip code:
40.7 years
Michigan median age:
40.3 years
Average household size:
This zip code:
2.3 people
Michigan:
2.4 people
Averages for the 2020 tax year for zip code 48195, filed in 2021:
Average Adjusted Gross Income (AGI) in 2020: $51,640 (Individual Income Tax Returns)
Here:
$51,640
State:
$68,945
Salary/wage: $48,316 (reported on 77.7% of returns)
Here:
$48,316
State:
$57,142
(% of AGI for various income ranges: 931.1% for AGIs below $25k, 3237.3% for AGIs $25k-50k, 6322.7% for AGIs $50k-75k, 9217.9% for AGIs $75k-100k, 15858.5% for AGIs $100k-200k, 49408.8% for AGIs over 200k)
Taxable interest for individuals: $920 (reported on 26.6% of returns)
This zip code:
$920
Michigan:
$1,630
(% of AGI for various income ranges: 14.7% for AGIs below $25k, 24.9% for AGIs $25k-50k, 28.5% for AGIs $50k-75k, 35.2% for AGIs $75k-100k, 76.4% for AGIs $100k-200k, 818.8% for AGIs over 200k)
Ordinary dividends: $2,499 (reported on 13.8% of returns)
Here:
$2,499
State:
$6,972
(% of AGI for various income ranges: 18.1% for AGIs below $25k, 21.3% for AGIs $25k-50k, 42.6% for AGIs $50k-75k, 85.5% for AGIs $75k-100k, 133.6% for AGIs $100k-200k, 970.0% for AGIs over 200k)
Net capital gain/loss in AGI: +$7,895 (reported on 12.0% of returns)
Here:
+$7,895
State:
+$20,064
(% of AGI for various income ranges: 5.2% for AGIs below $25k, 16.2% for AGIs $25k-50k, 53.8% for AGIs $50k-75k, 91.6% for AGIs $75k-100k, 279.2% for AGIs $100k-200k, 11423.8% for AGIs over 200k)
Profit/loss from business: +$5,910 (reported on 11.2% of returns)
Here:
+$5,910
State:
+$11,172
(% of AGI for various income ranges: 50.7% for AGIs below $25k, 56.5% for AGIs $25k-50k, 97.0% for AGIs $50k-75k, 158.0% for AGIs $75k-100k, 232.3% for AGIs $100k-200k, 446.3% for AGIs over 200k)
Taxable individual retirement arrangement distribution: $13,958 (reported on 9.3% of returns)
48195:
$13,958
Michigan:
$19,803
(% of AGI for various income ranges: 64.7% for AGIs below $25k, 90.8% for AGIs $25k-50k, 196.0% for AGIs $50k-75k, 296.3% for AGIs $75k-100k, 535.7% for AGIs $100k-200k, 2175.0% for AGIs over 200k)
Total itemized deductions: $24,820 (reported on 3.3% of returns)
Here:
$24,820
State:
$34,117
(% of AGI for various income ranges: 26.2% for AGIs below $25k, 55.9% for AGIs $25k-50k, 112.4% for AGIs $50k-75k, 256.9% for AGIs $75k-100k, 336.4% for AGIs $100k-200k, 1606.2% for AGIs over 200k)
Charity contributions: $7,425 (reported on 2.7% of returns)
Here:
$7,425
State:
$13,548
(% of AGI for various income ranges: 1.7% for AGIs below $25k, 9.3% for AGIs $25k-50k, 22.3% for AGIs $50k-75k, 63.8% for AGIs $75k-100k, 103.6% for AGIs $100k-200k, 581.2% for AGIs over 200k)
Taxes paid: $7,213 (reported on 3.3% of returns)
48195:
$7,213
State:
$7,972
(% of AGI for various income ranges: 4.1% for AGIs below $25k, 12.8% for AGIs $25k-50k, 37.1% for AGIs $50k-75k, 78.7% for AGIs $75k-100k, 104.1% for AGIs $100k-200k, 431.2% for AGIs over 200k)
Earned income credit: $1,994 (reported on 12.1% of returns)
Here:
$1,994
State:
$2,251
(% of AGI for various income ranges: 60.9% for AGIs below $25k, 46.3% for AGIs $25k-50k, 1.5% for AGIs $50k-75k)
Percentage of individuals using paid preparers for their 2020 taxes: 94.3%
Here:
94%
State:
93%
(% for various income ranges: 93.4% for AGIs below $25k, 95.2% for AGIs $25k-50k, 94.2% for AGIs $50k-75k, 95.1% for AGIs $75k-100k, 94.0% for AGIs $100k-200k, 95.2% for AGIs over 200k)
Averages for the 2012 tax year for zip code 48195, filed in 2013:
Average Adjusted Gross Income (AGI) in 2012: $43,906 (Individual Income Tax Returns)
Here:
$43,906
State:
$55,609
Salary/wage: $41,276 (reported on 81.0% of returns)
Here:
$41,276
State:
$46,782
(% of AGI for various income ranges: 65.1% for AGIs below $25k, 75.4% for AGIs $25k-50k, 78.1% for AGIs $50k-75k, 80.2% for AGIs $75k-100k, 83.0% for AGIs $100k-200k, 49.6% for AGIs over 200k)
Taxable interest for individuals: $855 (reported on 32.5% of returns)
This zip code:
$855
Michigan:
$1,491
(% of AGI for various income ranges: 1.2% for AGIs below $25k, 0.6% for AGIs $25k-50k, 0.7% for AGIs $50k-75k, 0.4% for AGIs $75k-100k, 0.4% for AGIs $100k-200k, 1.0% for AGIs over 200k)
Ordinary dividends: $2,273 (reported on 16.2% of returns)
Here:
$2,273
State:
$6,225
(% of AGI for various income ranges: 1.2% for AGIs below $25k, 0.7% for AGIs $25k-50k, 0.7% for AGIs $50k-75k, 0.6% for AGIs $75k-100k, 0.6% for AGIs $100k-200k, 3.0% for AGIs over 200k)
Net capital gain/loss in AGI: +$1,495 (reported on 10.8% of returns)
Here:
+$1,495
State:
+$9,326
(% of AGI for various income ranges: 0.3% for AGIs $50k-75k, 0.3% for AGIs $75k-100k, 0.4% for AGIs $100k-200k, 4.3% for AGIs over 200k)
Profit/loss from business: +$7,662 (reported on 9.0% of returns)
Here:
+$7,662
State:
+$11,523
(% of AGI for various income ranges: 5.0% for AGIs below $25k, 1.5% for AGIs $25k-50k, 1.1% for AGIs $50k-75k, 0.9% for AGIs $75k-100k, 0.9% for AGIs $100k-200k, 2.0% for AGIs over 200k)
Taxable individual retirement arrangement distribution: $11,575 (reported on 10.7% of returns)
48195:
$11,575
Michigan:
$15,298
(% of AGI for various income ranges: 3.4% for AGIs below $25k, 2.7% for AGIs $25k-50k, 2.4% for AGIs $50k-75k, 3.1% for AGIs $75k-100k, 3.4% for AGIs $100k-200k)
Total itemized deductions: $16,457 (21% of AGI, reported on 25.8% of returns)
Here:
$16,457
State:
$21,628
Here:
20.5% of AGI
State:
18.4% of AGI
(% of AGI for various income ranges: 6.9% for AGIs below $25k, 7.7% for AGIs $25k-50k, 9.2% for AGIs $50k-75k, 10.5% for AGIs $75k-100k, 11.9% for AGIs $100k-200k, 12.8% for AGIs over 200k)
Charity contributions: $2,404 (reported on 22.1% of returns)
Here:
$2,404
State:
$4,225
(% of AGI for various income ranges: 0.7% for AGIs below $25k, 1.0% for AGIs $25k-50k, 1.1% for AGIs $50k-75k, 1.3% for AGIs $75k-100k, 1.7% for AGIs $100k-200k, 1.2% for AGIs over 200k)
Taxes paid: $6,051 (reported on 25.8% of returns)
48195:
$6,051
State:
$8,327
(% of AGI for various income ranges: 1.6% for AGIs below $25k, 2.2% for AGIs $25k-50k, 3.2% for AGIs $50k-75k, 4.0% for AGIs $75k-100k, 5.3% for AGIs $100k-200k, 5.2% for AGIs over 200k)
Earned income credit: $1,935 (reported on 15.2% of returns)
Here:
$1,935
State:
$2,306
(% of AGI for various income ranges: 4.4% for AGIs below $25k, 0.8% for AGIs $25k-50k)
Percentage of individuals using paid preparers for their 2012 taxes: 60.7%
Here:
61%
State:
57%
(% for various income ranges: 58.6% for AGIs below $25k, 59.2% for AGIs $25k-50k, 63.6% for AGIs $50k-75k, 65.5% for AGIs $75k-100k, 64.8% for AGIs $100k-200k, 77.8% for AGIs over 200k)
Averages for the 2004 tax year for zip code 48195, filed in 2005:
Average Adjusted Gross Income (AGI) in 2004: $41,793 (Individual Income Tax Returns)
Here:
$41,793
State:
$48,204
Salary/wage: $41,289 (reported on 82.6% of returns)
Here:
$41,289
State:
$42,791
(% of AGI for various income ranges: 69.9% for AGIs below $10k, 63.4% for AGIs $10k-25k, 78.7% for AGIs $25k-50k, 85.0% for AGIs $50k-75k, 88.1% for AGIs $75k-100k, 83.2% for AGIs over 100k)
Taxable interest for individuals: $1,235 (reported on 50.6% of returns)
This zip code:
$1,235
Michigan:
$1,725
(% of AGI for various income ranges: 6.3% for AGIs below $10k, 3.4% for AGIs $10k-25k, 1.5% for AGIs $25k-50k, 1.1% for AGIs $50k-75k, 0.8% for AGIs $75k-100k, 1.4% for AGIs over 100k)
Taxable dividends: $1,636 (reported on 23.0% of returns)
Here:
$1,636
State:
$3,420
(% of AGI for various income ranges: 3.7% for AGIs below $10k, 1.8% for AGIs $10k-25k, 0.9% for AGIs $25k-50k, 0.6% for AGIs $50k-75k, 0.5% for AGIs $75k-100k, 1.0% for AGIs over 100k)
Net capital gain/loss: +$2,209 (reported on 15.1% of returns)
Here:
+$2,209
State:
+$8,532
(% of AGI for various income ranges: -1.9% for AGIs below $10k, -0.2% for AGIs $10k-25k, 0.4% for AGIs $25k-50k, 0.3% for AGIs $50k-75k, 0.5% for AGIs $75k-100k, 2.7% for AGIs over 100k)
Profit/loss from business: +$5,913 (reported on 8.2% of returns)
Here:
+$5,913
State:
+$9,547
(% of AGI for various income ranges: 2.6% for AGIs below $10k, 2.9% for AGIs $10k-25k, 1.4% for AGIs $25k-50k, 1.0% for AGIs $50k-75k, 0.6% for AGIs $75k-100k, 0.8% for AGIs over 100k)
IRA payment deduction: $2,989 (reported on 1.7% of returns)
48195:
$2,989
Michigan:
$2,875
(% of AGI for various income ranges: 0.2% for AGIs $10k-25k, 0.2% for AGIs $25k-50k, 0.1% for AGIs $50k-75k, 0.1% for AGIs $75k-100k, 0.1% for AGIs over 100k)
Self-employed pension: $11,818 (reported on 0.1% of returns)
Here:
$11,818
Michigan:
$13,826
Total itemized deductions: $15,354 (22% of AGI, reported on 37.0% of returns)
Here:
$15,354
State:
$18,509
Here:
22.3% of AGI
State:
20.7% of AGI
(% of AGI for various income ranges: 8.2% for AGIs below $10k, 8.8% for AGIs $10k-25k, 12.2% for AGIs $25k-50k, 14.8% for AGIs $50k-75k, 14.9% for AGIs $75k-100k, 14.9% for AGIs over 100k)
Charity contributions deductions: $2,078 (3% of AGI, reported on 33.9% of returns)
Here:
$2,078
State:
$3,365
Here:
2.9% of AGI
State:
3.6% of AGI
(% of AGI for various income ranges: 0.5% for AGIs below $10k, 1.1% for AGIs $10k-25k, 1.4% for AGIs $25k-50k, 1.8% for AGIs $50k-75k, 1.9% for AGIs $75k-100k, 2.1% for AGIs over 100k)
Total tax: $5,208 (reported on 77.9% of returns)
48195:
$5,208
State:
$7,691
(% of AGI for various income ranges: 1.7% for AGIs below $10k, 4.1% for AGIs $10k-25k, 7.3% for AGIs $25k-50k, 9.2% for AGIs $50k-75k, 10.5% for AGIs $75k-100k, 14.9% for AGIs over 100k)
Earned income credit: $1,413 (reported on 9.0% of returns)
Here:
$1,413
State:
$1,737
Percentage of individuals using paid preparers for their 2004 taxes: 62.8%
Here:
63%
State:
60%
(% for various income ranges: 57.1% for AGIs below $10k, 61.7% for AGIs $10k-25k, 62.5% for AGIs $25k-50k, 67.1% for AGIs $50k-75k, 65.3% for AGIs $75k-100k, 69.7% for AGIs over 100k)
Likely homosexual households (counted as self-reported same-sex unmarried-partner households)
Lesbian couples: 0.1% of all households
Gay men: 0.0% of all households
Household received Food Stamps/SNAP in the past 12 months: 1,330 Household did not receive Food Stamps/SNAP in the past 12 months: 11,438
Women who had a birth in the past 12 months: 219 (144 now married, 74 unmarried) Women who did not have a birth in the past 12 months: 6,429 (2,599 now married, 3,829 unmarried)
Housing units in zip code 48195 with a mortgage: 5,281 (266 second mortgage, 254 both second mortgage and home equity loan) Houses without a mortgage: 222
Median monthly owner costs for units with a mortgage: $1,301 Median monthly owner costs for units without a mortgage: $562
Residents with income below the poverty level in 2022:
This zip code:
9.9%
Whole state:
13.4%
Residents with income below 50% of the poverty level in 2022:
This zip code:
4.8%
Whole state:
6.9%
Median number of rooms in houses and condos:
Here:
5.9
State:
6.5
Median number of rooms in apartments:
Here:
3.8
State:
4.3
Notable locations in this zip code not listed on our city pages
Notable locations in zip code 48195: Southgate Municipal Golf Course (A), Community Emergency Medical Services Station 8 Southgate (B), Southgate Civic Center (C), Southgate Courthouse (D), Southgate Fire Department (E), Southgate Library (F), Oakwood Healthcare Center - Southgate (G). Display/hide their locations on the map
Churches in zip code 48195 include: Grace Church (A), Saint Puis Church (B), Sisters Servant of the Immaculate Heart of Mary Church (C), Downriver Praise Center (D), Catholic University Center (E). Display/hide their locations on the map
Parks in zip code 48195 include: Rotary Park (1), Kiwanis Park (2), Lions Park (3), Cobb Park (4), Auxiliary Police Park (5), Howard Park (6). Display/hide their locations on the map
3,426 married couples with children.
1,777 single-parent households (700 men, 1,077 women).
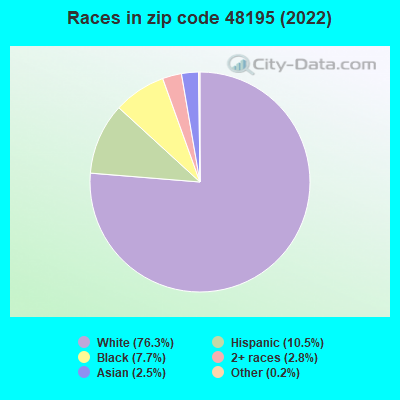
89.8% of residents of 48195 zip code speak English at home.
3.4% of residents speak Spanish at home (72% very well, 16% well, 12% not well).
4.9% of residents speak other Indo-European language at home (66% very well, 24% well, 9% not well, 1% not at all).
1.3% of residents speak Asian or Pacific Island language at home (62% very well, 14% well, 15% not well, 10% not at all).
0.6% of residents speak other language at home (75% very well, 19% well, 5% not well).
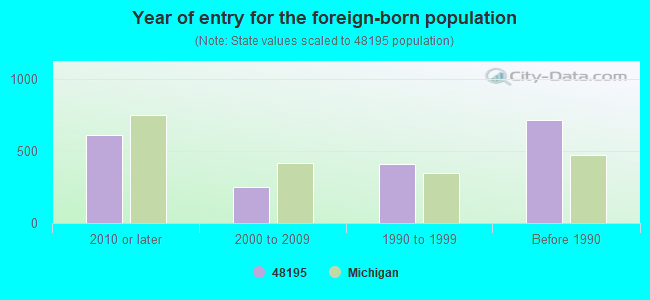
Foreign born population: 1,851 (6.2%) (63.7% of them are naturalized citizens)
Major facilities with environmental interests located in this zip code:
GERISCH MIDDLE SCHOOL (12601 MCCANN STREET in SOUTHGATE, MI)
(National Center for Education Statistics) - STATE ID-06297 Organizations: SOUTHGATE COMMUNITY SCHOOL DISTRICT (SCHOOL DISTRICT)
FORDLINE ELEMENTARY SCHOOL (14775 FORDLINE STREET in SOUTHGATE, MI)
(National Center for Education Statistics) - STATE ID-01260 Organizations: SOUTHGATE COMMUNITY SCHOOL DISTRICT (SCHOOL DISTRICT)
ALLEN ELEMENTARY SCHOOL (16500 MCCANN ROAD in SOUTHGATE, MI)
(National Center for Education Statistics) - STATE ID-05179 Organizations: SOUTHGATE COMMUNITY SCHOOL DISTRICT (SCHOOL DISTRICT)
CHORMANN ELEM SCHOOL (15500 HOWARD in SOUTHGATE, MI)
(National Center for Education Statistics) - STATE ID-00681 Organizations: SOUTHGATE COMMUNITY SCHOOL DISTRICT (SCHOOL DISTRICT)
GROGAN ELEMENTARY SCHOOL (13300 BURNS STREET in SOUTHGATE, MI)
(National Center for Education Statistics) - STATE ID-00454 Organizations: SOUTHGATE COMMUNITY SCHOOL DISTRICT (SCHOOL DISTRICT)
MI DEPT/TRANSPORTATION BRIDGE (I-75 OVER NORTHLINE RD in SOUTHGATE, MI)
(Resource Conservation and Recovery Act (tracking hazardous waste)) Organizations: MICH DEPT OF TRANSPORTATION (CONTACT/OPERATOR)
Alternative names: MIDOT BRIDGE I-75 OVER NORTHLINE RD
ALFRED D SMITH PROPERTY (14805 DIX TOLEDO in SOUTHGATE, MI)
(Resource Conservation and Recovery Act (tracking hazardous waste)) Organizations: ALFRED SMITH (CONTACT/OPERATOR)
AMOCO OIL CO 5765 (19141 GODDARD AVE in SOUTHGATE, MI)
(Resource Conservation and Recovery Act (tracking hazardous waste)) Organizations: AMOCO OIL COMPANY (CONTACT/OWNER)
AMOCO OIL CO KENS (14350 FORT in SOUTHGATE, MI)
(Resource Conservation and Recovery Act (tracking hazardous waste)) Organizations: AMOCO OIL COMPANY (CONTACT/OWNER)
ANDYS FARMERS MARKET INC (19971 NORTHLINE RD in SOUTHGATE, MI)
(Resource Conservation and Recovery Act (tracking hazardous waste))
MI DEPT/TRANSPORTATION BRIDGE (I-75 OVER GODDARD RD in SOUTHGATE, MI)
(Resource Conservation and Recovery Act (tracking hazardous waste)) Organizations: MICH DEPT OF TRANSPORTATION (CONTACT/OPERATOR)
Alternative names: MIDOT BRIDGE I-75 OVER GODDARD RD
ASC ADVANCED TECH (13400 REECK RD in SOUTHGATE, MI)
(Resource Conservation and Recovery Act (tracking hazardous waste)) Organizations: STRATTON JIM (CONTACT/OWNER)
MI DEPT/TRANSPORTATION BRIDGE (I-75 OVER ALLEN RD in SOUTHGATE, MI)
(Resource Conservation and Recovery Act (tracking hazardous waste)) Organizations: MICH DEPT OF TRANSPORTATION (CONTACT/OPERATOR)
Alternative names: MIDOT BRIDGE I-75 OVER ALLEN RD
Housing units lacking complete plumbing facilities: 0.2% Housing units lacking complete kitchen facilities: 1.0%
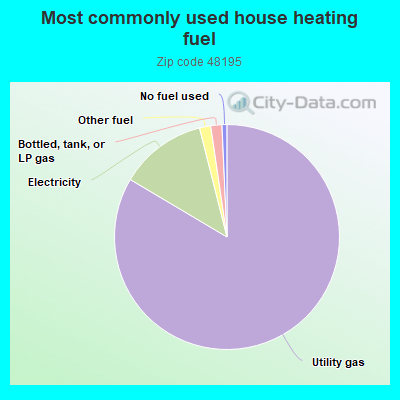
83.2%Utility gas
12.5%Electricity
1.6%Other fuel
1.6%Bottled, tank, or LP gas
0.7%No fuel used
Population in 1990: 30,771.
Place of birth for U.S.-born residents:
This state: 23,933
Northeast: 899
Midwest: 809
South: 1,717
West: 462
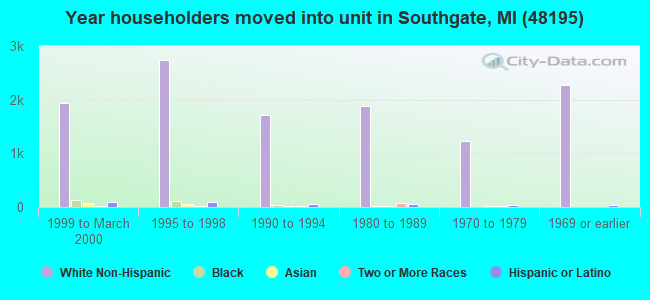
63% of the 48195 zip code residents lived in the same house 5 years ago. Out of people who lived in different houses, 81% lived in this county. Out of people who lived in different counties, 50% lived in Michigan.
89% of the 48195 zip code residents lived in the same house 1 year ago. Out of people who lived in different houses, 76% moved from this county. Out of people who lived in different houses, 8% moved from different county within same state. Out of people who lived in different houses, 11% moved from different state. Out of people who lived in different houses, 2% moved from abroad.
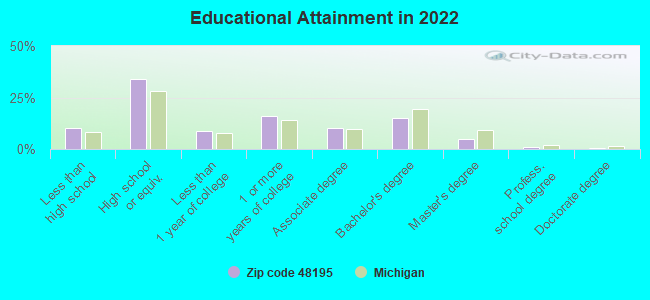
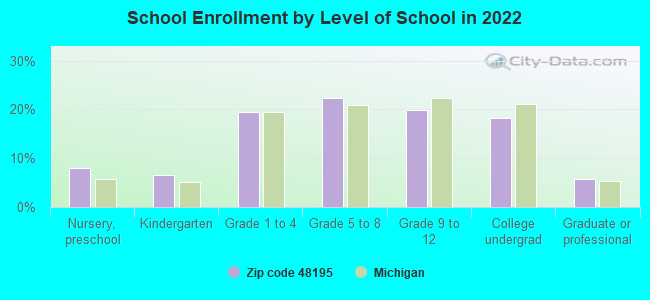
Private vs. public school enrollment:
Students in private schools in grades 1 to 8 (elementary and middle school): 600
Here:
22.5%
Michigan:
12.4%
Students in private schools in grades 9 to 12 (high school): 229
Here:
18.2%
Michigan:
9.8%
Students in private undergraduate colleges: 89
Here:
7.7%
Michigan:
14.9%
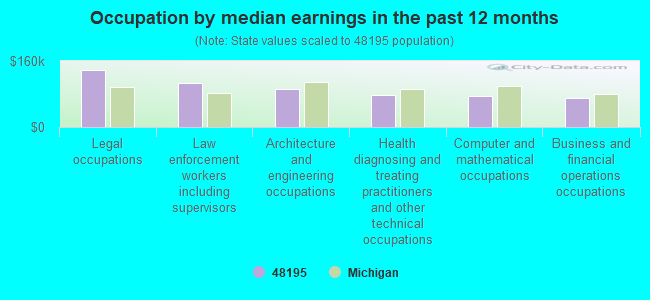
Occupation by median earnings in the past 12 months ($)
139,360Legal occupations
105,671Law enforcement workers including supervisors
91,655Architecture and engineering occupations
78,688Health diagnosing and treating practitioners and other technical occupations
74,013Computer and mathematical occupations
69,307Business and financial operations occupations
Companies with federal contracts located in this zip code:
KOOL RADIATOR SERVICE INC (15331 GODDARD RD in SOUTHGATE, MI; small business)
$16,420 with Army for Earth Moving and Excavating Equipment. Signed on 2005-12-02. Completion date: 2006-03-31.
Top industries in this zip code by the number of employees in 2005:
Other Services (except Public Administration): Commercial and Industrial Machinery and Equipment (except Automotive and Electronic) Repair and Maintenance (250-499: 1, 1-4: 3)
Health Care and Social Assistance: Offices of Physicians (except Mental Health Specialists) (20-49: 4, 10-19: 8, 5-9: 10, 1-4: 8)
People in group quarters in 2010:
88 people in nursing facilities/skilled-nursing facilities
29 people in group homes intended for adults
People in group quarters in 2000:
91 people in nursing homes
74 people in schools, hospitals, or wards for the intellectually disabled
16 people in homes for the mentally retarded
11 people in other group homes
6 people in local jails and other confinement facilities (including police lockups)
Fatal accident statistics in 2014:
Fatal accident count: 1
Vehicles involved in fatal accidents: 1
Fatal accidents caused by drunken drivers: 0
Fatalities: 1
Persons involved in fatal accidents: 1
Pedestrians involved in fatal accidents: 1
Fatal accident statistics in 2013:
Fatal accident count: 3
Vehicles involved in fatal accidents: 3
Fatal accidents caused by drunken drivers: 1
Fatalities: 3
Persons involved in fatal accidents: 8
Pedestrians involved in fatal accidents: 1
Home Mortgage Disclosure Act Aggregated Statistics For Year 2009 (Based on 14 full tracts)
A) FHA, FSA/RHS & VA Home Purchase Loans
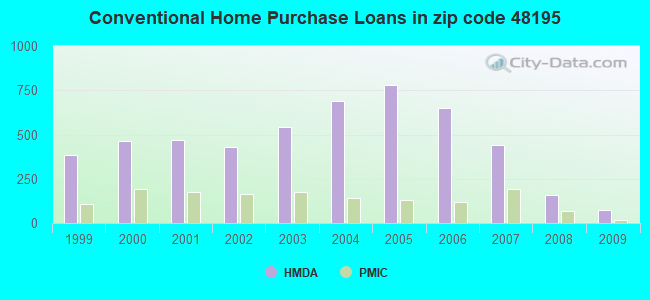
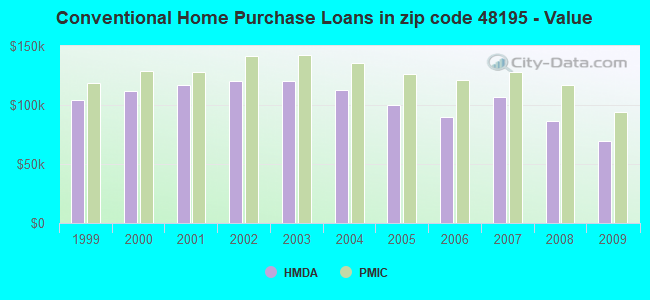
B) Conventional Home Purchase Loans
C) Refinancings
D) Home Improvement Loans
E) Loans on Dwellings For 5+ Families
F) Non-occupant Loans on < 5 Family Dwellings (A B C & D)
Number
Average Value
Number
Average Value
Number
Average Value
Number
Average Value
Number
Average Value
Number
Average Value
LOANS ORIGINATED
270
$78,053
74
$69,416
350
$107,301
32
$15,007
6
$817,745
17
$49,694
APPLICATIONS APPROVED, NOT ACCEPTED
15
$79,363
2
$45,995
34
$105,065
17
$9,274
0
$0
3
$40,997
APPLICATIONS DENIED
53
$87,422
27
$50,555
194
$124,926
71
$19,257
0
$0
8
$56,124
APPLICATIONS WITHDRAWN
32
$85,796
6
$57,618
66
$125,155
3
$64,327
0
$0
4
$52,998
FILES CLOSED FOR INCOMPLETENESS
3
$117,047
2
$55,990
15
$67,861
3
$10,000
0
$0
3
$48,660
Aggregated Statistics For Year 2008 (Based on 14 full tracts)
A) FHA, FSA/RHS & VA Home Purchase Loans
B) Conventional Home Purchase Loans
C) Refinancings
D) Home Improvement Loans
F) Non-occupant Loans on < 5 Family Dwellings (A B C & D)
G) Loans On Manufactured Home Dwelling (A B C & D)
Number
Average Value
Number
Average Value
Number
Average Value
Number
Average Value
Number
Average Value
Number
Average Value
LOANS ORIGINATED
194
$96,134
156
$86,522
364
$109,892
82
$18,421
46
$58,942
2
$112,130
APPLICATIONS APPROVED, NOT ACCEPTED
4
$57,392
10
$75,628
52
$103,967
20
$33,569
1
$71,000
4
$32,400
APPLICATIONS DENIED
39
$103,323
57
$96,350
322
$123,360
94
$29,977
26
$75,997
12
$56,067
APPLICATIONS WITHDRAWN
16
$117,106
26
$79,870
92
$120,958
10
$23,963
17
$65,133
0
$0
FILES CLOSED FOR INCOMPLETENESS
4
$94,385
9
$120,041
30
$112,452
3
$29,303
4
$89,448
0
$0
Aggregated Statistics For Year 2007 (Based on 14 full tracts)
A) FHA, FSA/RHS & VA Home Purchase Loans
B) Conventional Home Purchase Loans
C) Refinancings
D) Home Improvement Loans
E) Loans on Dwellings For 5+ Families
F) Non-occupant Loans on < 5 Family Dwellings (A B C & D)
G) Loans On Manufactured Home Dwelling (A B C & D)
Number
Average Value
Number
Average Value
Number
Average Value
Number
Average Value
Number
Average Value
Number
Average Value
Number
Average Value
LOANS ORIGINATED
86
$130,482
442
$106,412
746
$103,303
166
$40,269
0
$0
87
$88,823
2
$11,910
APPLICATIONS APPROVED, NOT ACCEPTED
0
$0
64
$110,518
110
$103,743
32
$34,015
0
$0
12
$94,526
9
$46,558
APPLICATIONS DENIED
7
$111,284
121
$105,942
647
$115,723
163
$20,942
1
$6,470,000
38
$83,301
10
$45,132
APPLICATIONS WITHDRAWN
14
$120,529
38
$127,678
218
$119,337
5
$44,800
0
$0
9
$92,199
0
$0
FILES CLOSED FOR INCOMPLETENESS
1
$132,000
12
$144,843
89
$127,488
7
$51,539
0
$0
5
$203,178
0
$0
Aggregated Statistics For Year 2006 (Based on 14 full tracts)
A) FHA, FSA/RHS & VA Home Purchase Loans
B) Conventional Home Purchase Loans
C) Refinancings
D) Home Improvement Loans
E) Loans on Dwellings For 5+ Families
F) Non-occupant Loans on < 5 Family Dwellings (A B C & D)
G) Loans On Manufactured Home Dwelling (A B C & D)
Number
Average Value
Number
Average Value
Number
Average Value
Number
Average Value
Number
Average Value
Number
Average Value
Number
Average Value
LOANS ORIGINATED
56
$131,810
650
$89,621
1,050
$96,175
234
$28,131
8
$4,015,305
70
$89,936
4
$31,950
APPLICATIONS APPROVED, NOT ACCEPTED
5
$154,600
101
$118,827
223
$107,612
47
$37,556
0
$0
9
$78,346
7
$34,099
APPLICATIONS DENIED
6
$167,048
197
$134,353
763
$119,319
182
$43,069
0
$0
34
$95,991
8
$21,489
APPLICATIONS WITHDRAWN
5
$88,848
74
$85,686
346
$133,541
20
$90,024
0
$0
15
$118,142
0
$0
FILES CLOSED FOR INCOMPLETENESS
2
$104,190
26
$97,740
135
$120,745
1
$30,000
0
$0
2
$103,835
0
$0
Aggregated Statistics For Year 2005 (Based on 14 full tracts)
A) FHA, FSA/RHS & VA Home Purchase Loans
B) Conventional Home Purchase Loans
C) Refinancings
D) Home Improvement Loans
E) Loans on Dwellings For 5+ Families
F) Non-occupant Loans on < 5 Family Dwellings (A B C & D)
G) Loans On Manufactured Home Dwelling (A B C & D)
Number
Average Value
Number
Average Value
Number
Average Value
Number
Average Value
Number
Average Value
Number
Average Value
Number
Average Value
LOANS ORIGINATED
62
$139,269
778
$100,223
1,379
$106,980
186
$38,627
2
$4,499,100
97
$79,237
2
$19,970
APPLICATIONS APPROVED, NOT ACCEPTED
5
$152,174
142
$103,458
265
$105,438
34
$35,535
0
$0
23
$89,813
16
$56,044
APPLICATIONS DENIED
13
$119,088
181
$91,783
897
$117,064
149
$34,545
0
$0
37
$77,771
28
$40,658
APPLICATIONS WITHDRAWN
6
$129,535
94
$126,515
508
$125,165
58
$128,505
0
$0
15
$129,298
0
$0
FILES CLOSED FOR INCOMPLETENESS
0
$0
38
$104,681
266
$134,406
5
$94,784
0
$0
3
$119,037
0
$0
Aggregated Statistics For Year 2004 (Based on 14 full tracts)
A) FHA, FSA/RHS & VA Home Purchase Loans
B) Conventional Home Purchase Loans
C) Refinancings
D) Home Improvement Loans
F) Non-occupant Loans on < 5 Family Dwellings (A B C & D)
G) Loans On Manufactured Home Dwelling (A B C & D)
Number
Average Value
Number
Average Value
Number
Average Value
Number
Average Value
Number
Average Value
Number
Average Value
LOANS ORIGINATED
136
$128,026
688
$112,902
1,599
$112,871
237
$47,105
75
$97,203
2
$18,970
APPLICATIONS APPROVED, NOT ACCEPTED
8
$145,379
77
$104,560
292
$111,603
29
$29,119
17
$96,220
0
$0
APPLICATIONS DENIED
6
$110,942
117
$106,077
642
$127,054
130
$29,617
32
$98,621
15
$60,379
APPLICATIONS WITHDRAWN
19
$132,621
59
$112,232
513
$120,787
24
$61,367
10
$98,959
0
$0
FILES CLOSED FOR INCOMPLETENESS
6
$133,323
11
$155,345
152
$132,693
8
$72,615
4
$118,630
0
$0
Aggregated Statistics For Year 2003 (Based on 14 full tracts)
A) FHA, FSA/RHS & VA Home Purchase Loans
B) Conventional Home Purchase Loans
C) Refinancings
D) Home Improvement Loans
E) Loans on Dwellings For 5+ Families
F) Non-occupant Loans on < 5 Family Dwellings (A B C & D)
Number
Average Value
Number
Average Value
Number
Average Value
Number
Average Value
Number
Average Value
Number
Average Value
LOANS ORIGINATED
221
$128,937
540
$119,969
3,577
$108,747
212
$23,048
4
$663,935
56
$82,231
APPLICATIONS APPROVED, NOT ACCEPTED
10
$133,839
61
$115,286
373
$114,499
42
$18,958
0
$0
16
$71,302
APPLICATIONS DENIED
11
$135,415
111
$104,052
693
$119,113
156
$23,582
0
$0
21
$65,559
APPLICATIONS WITHDRAWN
8
$146,760
58
$128,311
566
$117,144
13
$34,379
0
$0
13
$102,324
FILES CLOSED FOR INCOMPLETENESS
10
$138,279
16
$139,183
115
$120,892
9
$60,970
0
$0
5
$70,110
Aggregated Statistics For Year 2002 (Based on 10 full tracts)
A) FHA, FSA/RHS & VA Home Purchase Loans
B) Conventional Home Purchase Loans
C) Refinancings
D) Home Improvement Loans
E) Loans on Dwellings For 5+ Families
F) Non-occupant Loans on < 5 Family Dwellings (A B C & D)
Number
Average Value
Number
Average Value
Number
Average Value
Number
Average Value
Number
Average Value
Number
Average Value
LOANS ORIGINATED
179
$126,163
428
$120,015
1,830
$103,714
199
$18,339
0
$0
63
$77,790
APPLICATIONS APPROVED, NOT ACCEPTED
5
$125,450
55
$98,164
240
$105,497
19
$14,833
2
$609,025
10
$84,633
APPLICATIONS DENIED
12
$109,218
45
$104,593
402
$96,718
140
$11,603
0
$0
9
$125,956
APPLICATIONS WITHDRAWN
10
$130,690
32
$126,228
348
$108,224
10
$27,093
0
$0
9
$93,038
FILES CLOSED FOR INCOMPLETENESS
10
$124,210
4
$54,448
112
$104,981
0
$0
0
$0
0
$0
Aggregated Statistics For Year 2001 (Based on 10 full tracts)
A) FHA, FSA/RHS & VA Home Purchase Loans
B) Conventional Home Purchase Loans
C) Refinancings
D) Home Improvement Loans
F) Non-occupant Loans on < 5 Family Dwellings (A B C & D)
Number
Average Value
Number
Average Value
Number
Average Value
Number
Average Value
Number
Average Value
LOANS ORIGINATED
222
$116,405
467
$116,653
1,912
$99,547
286
$21,607
30
$75,456
APPLICATIONS APPROVED, NOT ACCEPTED
7
$122,331
32
$87,713
180
$81,202
72
$18,599
8
$56,339
APPLICATIONS DENIED
11
$115,120
73
$61,795
428
$89,686
187
$16,044
14
$53,052
APPLICATIONS WITHDRAWN
17
$103,515
38
$120,811
253
$95,354
16
$26,176
4
$92,985
FILES CLOSED FOR INCOMPLETENESS
5
$111,776
2
$164,720
77
$94,819
1
$87,000
0
$0
Aggregated Statistics For Year 2000 (Based on 10 full tracts)
A) FHA, FSA/RHS & VA Home Purchase Loans
B) Conventional Home Purchase Loans
C) Refinancings
D) Home Improvement Loans
F) Non-occupant Loans on < 5 Family Dwellings (A B C & D)
Number
Average Value
Number
Average Value
Number
Average Value
Number
Average Value
Number
Average Value
LOANS ORIGINATED
170
$107,456
461
$112,172
541
$78,380
296
$13,806
18
$53,009
APPLICATIONS APPROVED, NOT ACCEPTED
1
$125,000
37
$62,980
120
$81,182
101
$23,124
2
$68,470
APPLICATIONS DENIED
6
$114,943
84
$66,382
238
$75,342
160
$18,554
3
$30,667
APPLICATIONS WITHDRAWN
4
$111,750
40
$107,095
148
$68,658
17
$34,076
3
$31,303
FILES CLOSED FOR INCOMPLETENESS
3
$107,723
10
$109,424
49
$97,356
0
$0
0
$0
Aggregated Statistics For Year 1999 (Based on 7 full tracts)
A) FHA, FSA/RHS & VA Home Purchase Loans
B) Conventional Home Purchase Loans
C) Refinancings
D) Home Improvement Loans
F) Non-occupant Loans on < 5 Family Dwellings (A B C & D)
2002 - 2018 National Fire Incident Reporting System (NFIRS) incidents
Based on the data from the years 2002 - 2018 the average number of fire incidents per year is 57. The highest number of fires - 87 took place in 2004, and the least - 7 in 2006. The data has a growing trend.
When looking into fire subcategories, the most incidents belonged to: Structure Fires (35.7%), and Outside Fires (34.9%).
Fire incident types reported to NFIRS in Zip Code 48195


 Nearest zip codes: 48193, 48192, 48146, 48101, 48180, 48183.


 Based on the data from the years 2002 - 2018 the average number of fire incidents per year is 57. The highest number of fires - 87 took place in 2004, and the least - 7 in 2006. The data has a growing trend.
 When looking into fire subcategories, the most incidents belonged to: Structure Fires (35.7%), and Outside Fires (34.9%).