Races in Salt Lake City, Utah (UT) Detailed Stats
Data:
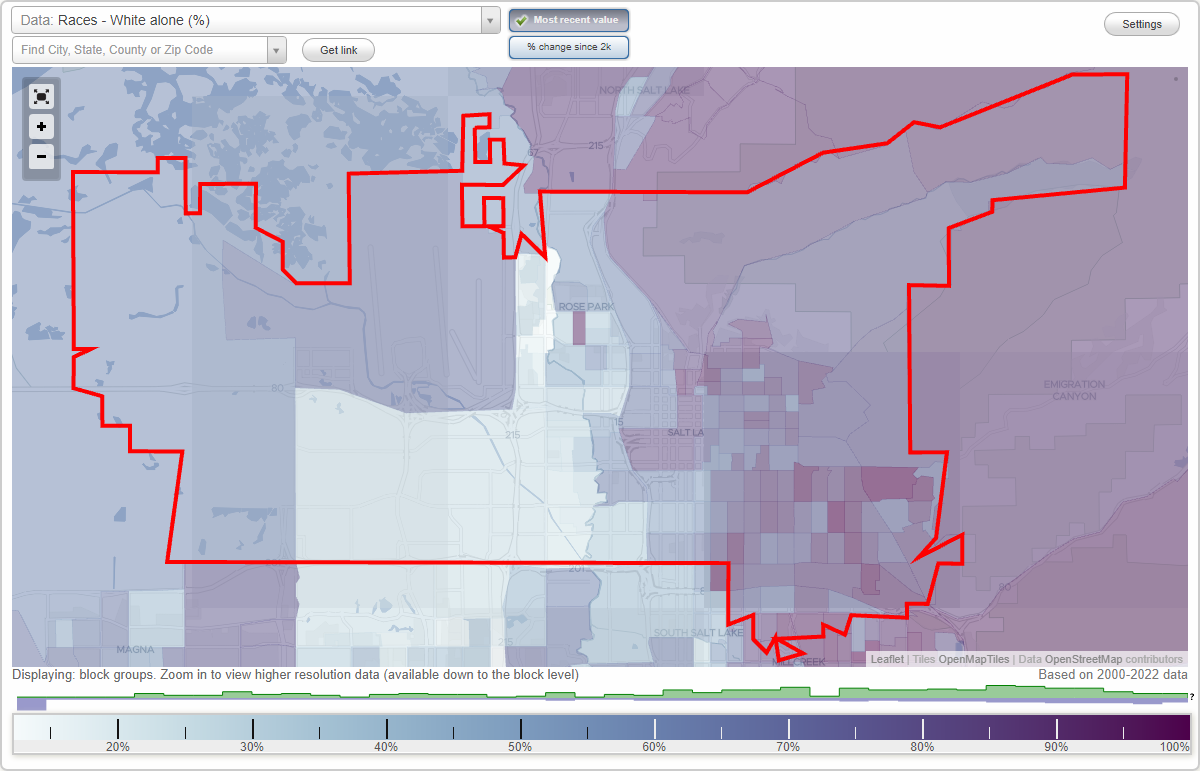
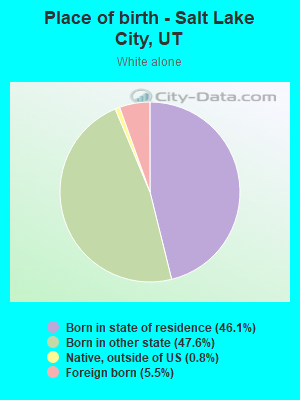
Races - White alone (%)
Races - White alone (% change since 2000)
Races - Black alone (%)
Races - Black alone (% change since 2000)
Races - American Indian alone (%)
Races - American Indian alone (% change since 2000)
Races - Asian alone (%)
Races - Asian alone (% change since 2000)
Races - Hispanic (%)
Races - Hispanic (% change since 2000)
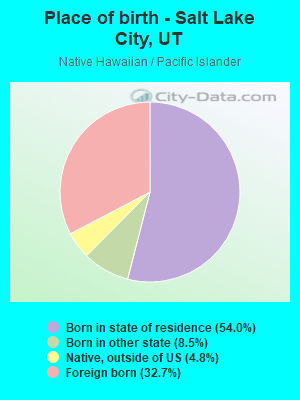
Races - Native Hawaiian and Other Pacific Islander alone (%)
Races - Native Hawaiian and Other Pacific Islander alone (% change since 2000)
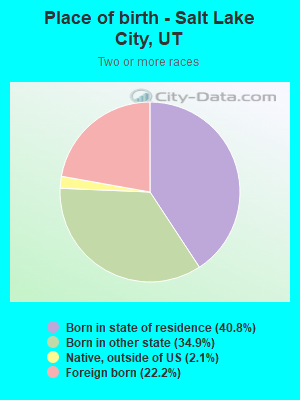
Races - Two or more races(%)
Races - Two or more races(% change since 2000)
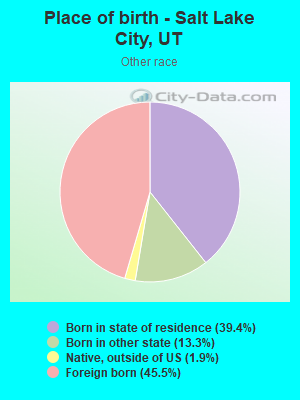
Races - Other race alone (%)
Races - Other race alone (% change since 2000)
Racial diversity
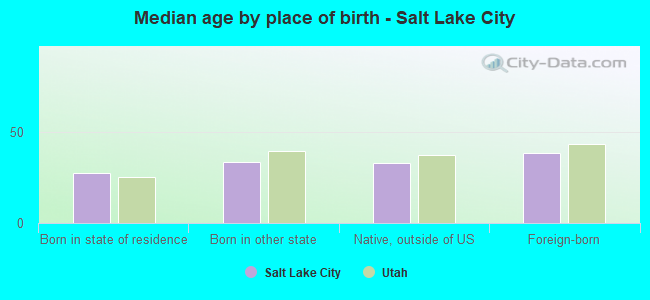
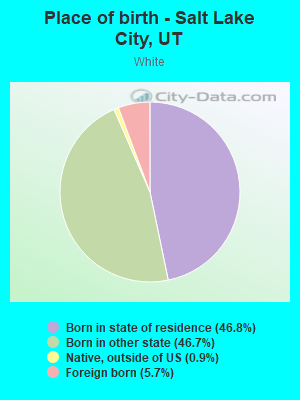
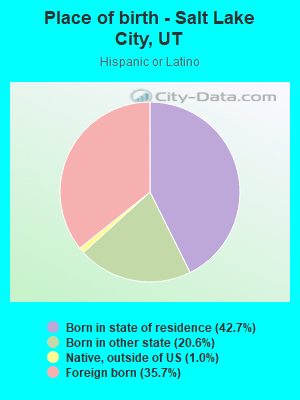
Place of birth - Born in state of residence (%)
Place of birth - Born in state of residence (%) - White
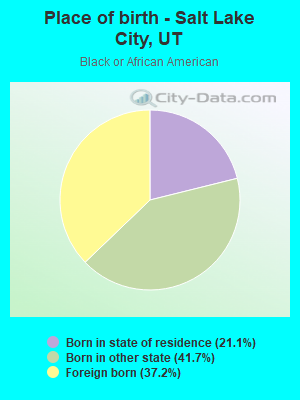
Place of birth - Born in state of residence (%) - Black or African American
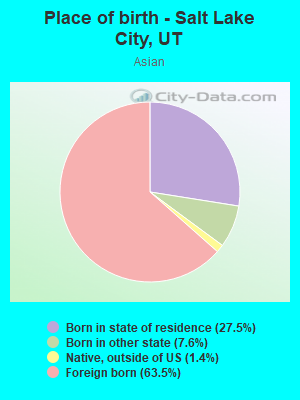
Place of birth - Born in state of residence (%) - Asian
Place of birth - Born in state of residence (%) - Hispanic or Latino
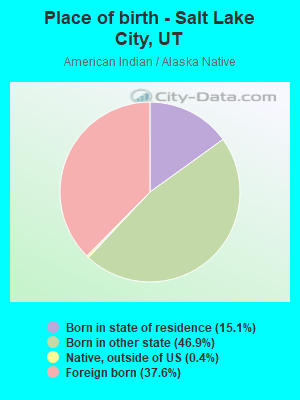
Place of birth - Born in state of residence (%) - American Indian and Alaska Native
Place of birth - Born in state of residence (%) - Multirace
Place of birth - Born in state of residence (%) - Other Race
Place of birth - Born in other state (%)
Place of birth - Born in other state (%) - White
Place of birth - Born in other state (%) - Black or African American
Place of birth - Born in other state (%) - Asian
Place of birth - Born in other state (%) - Hispanic or Latino
Place of birth - Born in other state (%) - American Indian and Alaska Native
Place of birth - Born in other state (%) - Multirace
Place of birth - Born in other state (%) - Other Race
Place of birth - Native, outside of US (%)
Place of birth - Native, outside of US (%) - White
Place of birth - Native, outside of US (%) - Black or African American
Place of birth - Native, outside of US (%) - Asian
Place of birth - Native, outside of US (%) - Hispanic or Latino
Place of birth - Native, outside of US (%) - American Indian and Alaska Native
Place of birth - Native, outside of US (%) - Multirace
Place of birth - Native, outside of US (%) - Other Race
Place of birth - Foreign born (%)
Place of birth - Foreign born (%) - White
Place of birth - Foreign born (%) - Black or African American
Place of birth - Foreign born (%) - Asian
Place of birth - Foreign born (%) - Hispanic or Latino
Place of birth - Foreign born (%) - American Indian and Alaska Native
Place of birth - Foreign born (%) - Multirace
Place of birth - Foreign born (%) - Other Race
Residents speaking English at home (%)
Residents speaking English at home - Born in the United States (%)
Residents speaking English at home - Native, born elsewhere (%)
Residents speaking English at home - Foreign born (%)
Residents speaking Spanish at home (%)
Residents speaking Spanish at home - Born in the United States (%)
Residents speaking Spanish at home - Native, born elsewhere (%)
Residents speaking Spanish at home - Foreign born (%)
Residents speaking other language at home (%)
Residents speaking other language at home - Born in the United States (%)
Residents speaking other language at home - Native, born elsewhere (%)
Residents speaking other language at home - Foreign born (%)
Marital status - Never married (%)
Marital status - Now married (%)
Marital status - Separated (%)
Marital status - Widowed (%)
Marital status - Divorced (%)
Ancestries Reported - Arab (%)
Ancestries Reported - Czech (%)
Ancestries Reported - Danish (%)
Ancestries Reported - Dutch (%)
Ancestries Reported - English (%)
Ancestries Reported - French (%)
Ancestries Reported - French Canadian (%)
Ancestries Reported - German (%)
Ancestries Reported - Greek (%)
Ancestries Reported - Hungarian (%)
Ancestries Reported - Irish (%)
Ancestries Reported - Italian (%)
Ancestries Reported - Lithuanian (%)
Ancestries Reported - Norwegian (%)
Ancestries Reported - Polish (%)
Ancestries Reported - Portuguese (%)
Ancestries Reported - Russian (%)
Ancestries Reported - Scotch-Irish (%)
Ancestries Reported - Scottish (%)
Ancestries Reported - Slovak (%)
Ancestries Reported - Subsaharan African (%)
Ancestries Reported - Swedish (%)
Ancestries Reported - Swiss (%)
Ancestries Reported - Ukrainian (%)
Ancestries Reported - United States (%)
Ancestries Reported - Welsh (%)
Ancestries Reported - West Indian (%)
Ancestries Reported - Other (%)
Geographical mobility - Same house 1 year ago (%)
Geographical mobility - Same house 1 year ago (%) - White
Geographical mobility - Same house 1 year ago (%) - Black or African American
Geographical mobility - Same house 1 year ago (%) - Asian
Geographical mobility - Same house 1 year ago (%) - Hispanic or Latino
Geographical mobility - Same house 1 year ago (%) - American Indian and Alaska Native
Geographical mobility - Same house 1 year ago (%) - Multirace
Geographical mobility - Same house 1 year ago (%) - Other Race
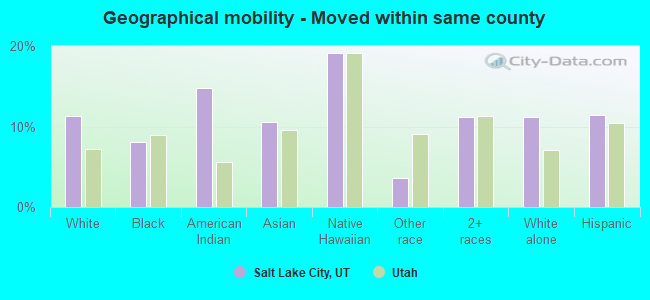
Geographical mobility - Moved within same county (%)
Geographical mobility - Moved within same county (%) - White
Geographical mobility - Moved within same county (%) - Black or African American
Geographical mobility - Moved within same county (%) - Asian
Geographical mobility - Moved within same county (%) - Hispanic or Latino
Geographical mobility - Moved within same county (%) - American Indian and Alaska Native
Geographical mobility - Moved within same county (%) - Multirace
Geographical mobility - Moved within same county (%) - Other Race
Geographical mobility - Moved from different county within same state (%)
Geographical mobility - Moved from different county within same state (%) - White
Geographical mobility - Moved from different county within same state (%) - Black or African American
Geographical mobility - Moved from different county within same state (%) - Asian
Geographical mobility - Moved from different county within same state (%) - Hispanic or Latino
Geographical mobility - Moved from different county within same state (%) - American Indian and Alaska Native
Geographical mobility - Moved from different county within same state (%) - Multirace
Geographical mobility - Moved from different county within same state (%) - Other Race
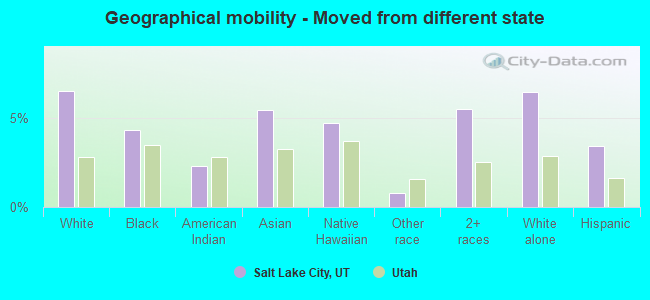
Geographical mobility - Moved from different state (%)
Geographical mobility - Moved from different state (%) - White
Geographical mobility - Moved from different state (%) - Black or African American
Geographical mobility - Moved from different state (%) - Asian
Geographical mobility - Moved from different state (%) - Hispanic or Latino
Geographical mobility - Moved from different state (%) - American Indian and Alaska Native
Geographical mobility - Moved from different state (%) - Multirace
Geographical mobility - Moved from different state (%) - Other Race
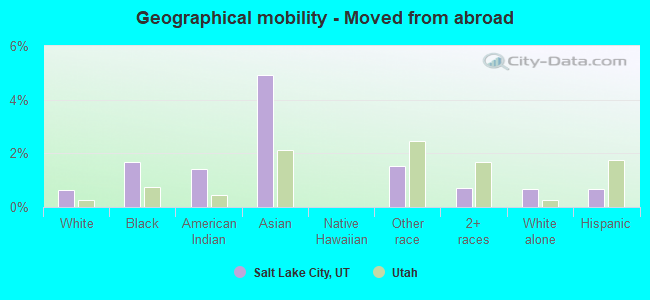
Geographical mobility - Moved from abroad (%)
Geographical mobility - Moved from abroad (%) - White
Geographical mobility - Moved from abroad (%) - Black or African American
Geographical mobility - Moved from abroad (%) - Asian
Geographical mobility - Moved from abroad (%) - Hispanic or Latino
Geographical mobility - Moved from abroad (%) - American Indian and Alaska Native
Geographical mobility - Moved from abroad (%) - Multirace
Geographical mobility - Moved from abroad (%) - Other Race
Place of birth for the foreign-born population - Ireland (%)
Place of birth for the foreign-born population - Denmark (%)
Place of birth for the foreign-born population - Norway (%)
Place of birth for the foreign-born population - Sweden (%)
Place of birth for the foreign-born population - United Kingdom (%)
Place of birth for the foreign-born population - England (%)
Place of birth for the foreign-born population - Scotland (%)
Place of birth for the foreign-born population - Other Northern Europe (%)
Place of birth for the foreign-born population - Austria (%)
Place of birth for the foreign-born population - Belgium (%)
Place of birth for the foreign-born population - France (%)
Place of birth for the foreign-born population - Germany (%)
Place of birth for the foreign-born population - Netherlands (%)
Place of birth for the foreign-born population - Switzerland (%)
Place of birth for the foreign-born population - Other Western Europe (%)
Place of birth for the foreign-born population - Greece (%)
Place of birth for the foreign-born population - Italy (%)
Place of birth for the foreign-born population - Portugal (%)
Place of birth for the foreign-born population - Spain (%)
Place of birth for the foreign-born population - Other Southern Europe (%)
Place of birth for the foreign-born population - Albania (%)
Place of birth for the foreign-born population - Belarus (%)
Place of birth for the foreign-born population - Bosnia and Herzegovina (%)
Place of birth for the foreign-born population - Bulgaria (%)
Place of birth for the foreign-born population - Croatia (%)
Place of birth for the foreign-born population - Czechoslovakia (%)
Place of birth for the foreign-born population - Hungary (%)
Place of birth for the foreign-born population - Latvia (%)
Place of birth for the foreign-born population - Lithuania (%)
Place of birth for the foreign-born population - North Macedonia (Macedonia) (%)
Place of birth for the foreign-born population - Moldova (%)
Place of birth for the foreign-born population - Poland (%)
Place of birth for the foreign-born population - Romania (%)
Place of birth for the foreign-born population - Russia (%)
Place of birth for the foreign-born population - Serbia (%)
Place of birth for the foreign-born population - Ukraine (%)
Place of birth for the foreign-born population - Other Eastern Europe (%)
Place of birth for the foreign-born population - China (%)
Place of birth for the foreign-born population - Hong Kong (%)
Place of birth for the foreign-born population - Taiwan (%)
Place of birth for the foreign-born population - Japan (%)
Place of birth for the foreign-born population - Korea (%)
Place of birth for the foreign-born population - Other Eastern Asia (%)
Place of birth for the foreign-born population - Afghanistan (%)
Place of birth for the foreign-born population - Bangladesh (%)
Place of birth for the foreign-born population - India (%)
Place of birth for the foreign-born population - Iran (%)
Place of birth for the foreign-born population - Kazakhstan (%)
Place of birth for the foreign-born population - Nepal (%)
Place of birth for the foreign-born population - Pakistan (%)
Place of birth for the foreign-born population - Sri Lanka (%)
Place of birth for the foreign-born population - Uzbekistan (%)
Place of birth for the foreign-born population - Other South Central Asia (%)
Place of birth for the foreign-born population - Burma (%)
Place of birth for the foreign-born population - Cambodia (%)
Place of birth for the foreign-born population - Indonesia (%)
Place of birth for the foreign-born population - Laos (%)
Place of birth for the foreign-born population - Malaysia (%)
Place of birth for the foreign-born population - Philippines (%)
Place of birth for the foreign-born population - Singapore (%)
Place of birth for the foreign-born population - Thailand (%)
Place of birth for the foreign-born population - Vietnam (%)
Place of birth for the foreign-born population - Other South Eastern Asia (%)
Place of birth for the foreign-born population - Armenia (%)
Place of birth for the foreign-born population - Iraq (%)
Place of birth for the foreign-born population - Israel (%)
Place of birth for the foreign-born population - Jordan (%)
Place of birth for the foreign-born population - Kuwait (%)
Place of birth for the foreign-born population - Lebanon (%)
Place of birth for the foreign-born population - Saudi Arabia (%)
Place of birth for the foreign-born population - Syria (%)
Place of birth for the foreign-born population - Turkey (%)
Place of birth for the foreign-born population - Yemen (%)
Place of birth for the foreign-born population - Other Western Asia (%)
Place of birth for the foreign-born population - Eritrea (%)
Place of birth for the foreign-born population - Ethiopia (%)
Place of birth for the foreign-born population - Kenya (%)
Place of birth for the foreign-born population - Somalia (%)
Place of birth for the foreign-born population - Uganda (%)
Place of birth for the foreign-born population - Zimbabwe (%)
Place of birth for the foreign-born population - Other Eastern Africa (%)
Place of birth for the foreign-born population - Cameroon (%)
Place of birth for the foreign-born population - Congo (%)
Place of birth for the foreign-born population - Democratic Republic of Congo (Zaire) (%)
Place of birth for the foreign-born population - Other Middle Africa (%)
Place of birth for the foreign-born population - Egypt (%)
Place of birth for the foreign-born population - Morocco (%)
Place of birth for the foreign-born population - Sudan (%)
Place of birth for the foreign-born population - Other Northern Africa (%)
Place of birth for the foreign-born population - South Africa (%)
Place of birth for the foreign-born population - Other Southern Africa (%)
Place of birth for the foreign-born population - Cabo Verde (%)
Place of birth for the foreign-born population - Ghana (%)
Place of birth for the foreign-born population - Liberia (%)
Place of birth for the foreign-born population - Nigeria (%)
Place of birth for the foreign-born population - Senegal (%)
Place of birth for the foreign-born population - Sierra Leone (%)
Place of birth for the foreign-born population - Other Western Africa (%)
Place of birth for the foreign-born population - Australia (%)
Place of birth for the foreign-born population - New Zealand (%)
Place of birth for the foreign-born population - Fiji (%)
Place of birth for the foreign-born population - Micronesia (%)
Place of birth for the foreign-born population - Bahamas (%)
Place of birth for the foreign-born population - Barbados (%)
Place of birth for the foreign-born population - Cuba (%)
Place of birth for the foreign-born population - Dominica (%)
Place of birth for the foreign-born population - Dominican Republic (%)
Place of birth for the foreign-born population - Grenada (%)
Place of birth for the foreign-born population - Haiti (%)
Place of birth for the foreign-born population - Jamaica (%)
Place of birth for the foreign-born population - St. Vincent and the Grenadines (%)
Place of birth for the foreign-born population - Trinidad and Tobago (%)
Place of birth for the foreign-born population - West Indies (%)
Place of birth for the foreign-born population - Other Caribbean (%)
Place of birth for the foreign-born population - Belize (%)
Place of birth for the foreign-born population - Costa Rica (%)
Place of birth for the foreign-born population - El Salvador (%)
Place of birth for the foreign-born population - Guatemala (%)
Place of birth for the foreign-born population - Honduras (%)
Place of birth for the foreign-born population - Mexico (%)
Place of birth for the foreign-born population - Nicaragua (%)
Place of birth for the foreign-born population - Panama (%)
Place of birth for the foreign-born population - Other Central America (%)
Place of birth for the foreign-born population - Argentina (%)
Place of birth for the foreign-born population - Bolivia (%)
Place of birth for the foreign-born population - Brazil (%)
Place of birth for the foreign-born population - Chile (%)
Place of birth for the foreign-born population - Colombia (%)
Place of birth for the foreign-born population - Ecuador (%)
Place of birth for the foreign-born population - Guyana (%)
Place of birth for the foreign-born population - Peru (%)
Place of birth for the foreign-born population - Uruguay (%)
Place of birth for the foreign-born population - Venezuela (%)
Place of birth for the foreign-born population - Other South America (%)
Place of birth for the foreign-born population - Canada (%)
Place of birth for the foreign-born population - Other Northern America (%)
Place of birth for the foreign-born population - Other (%)
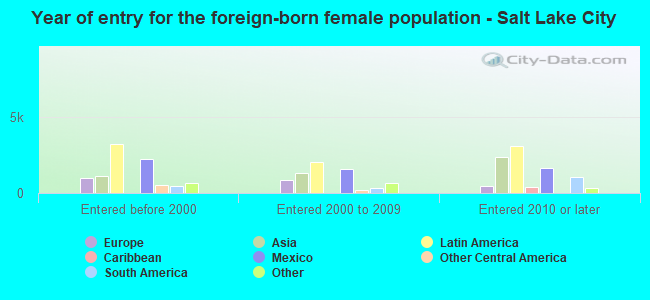
According to 2022 data, the most numerous races in Salt Lake City, UT are White alone (131,313 residents), Hispanic (40,911 residents), and Two or more races (11,157 residents). 74.7% of Salt Lake City residents speak English at home. 16.2% of Salt Lake City, UT residents are foreign-born (7.3% born in Latin America, 4.2% born in Asia, 1.8% born in Europe), which is 50.6% greater than the foreign-born rate of 8.0% across the entire state of Utah.
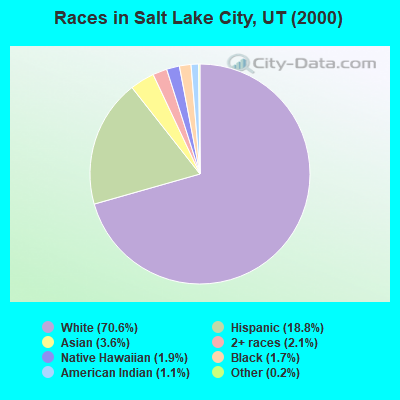
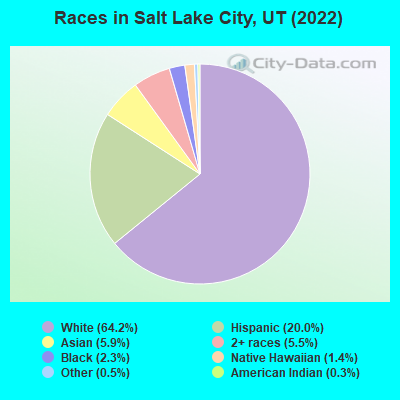
Race distribution in Salt Lake City
2000 2022
128,377 70.6% White alone 34,254 18.8% Hispanic 6,498 3.6% Asian alone 3,853 2.1% Two or more races 3,393 1.9% Native Hawaiian and Other 3,108 1.7% Black alone 1,966 1.1% American Indian alone 294 0.2% Other race alone
131,313 64.2% White alone 40,911 20.0% Hispanic 12,143 5.9% Asian alone 11,157 5.5% Two or more races 4,644 2.3% Black alone 2,892 1.4% Native Hawaiian and Other 927 0.5% Other race alone 666 0.3% American Indian alone
2000 2022
1,904,265 85.3% White alone 201,559 9.0% Hispanic 36,483 1.6% Asian alone 31,308 1.4% Two or more races 26,663 1.2% American Indian alone 14,806 0.7% Native Hawaiian and Other 16,137 0.7% Black alone 1,948 0.09% Other race alone
2,557,466 75.6% White alone 512,086 15.1% Hispanic 119,308 3.5% Two or more races 82,388 2.4% Asian alone 36,978 1.1% Native Hawaiian and Other 34,873 1.0% Black alone 22,803 0.7% American Indian alone 14,898 0.4% Other race alone
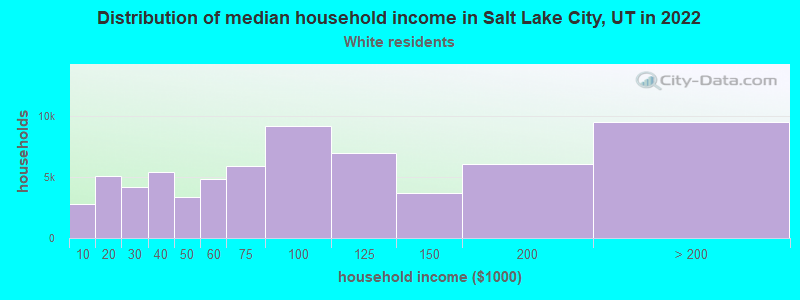
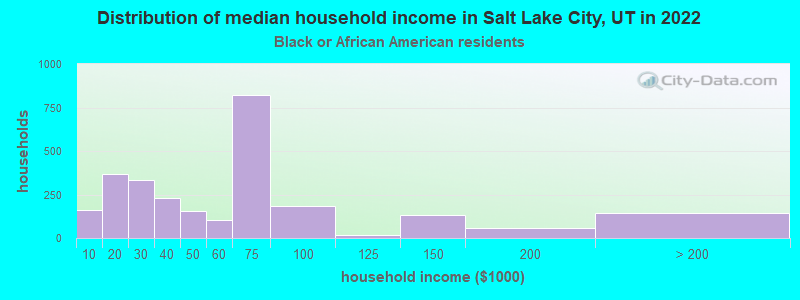
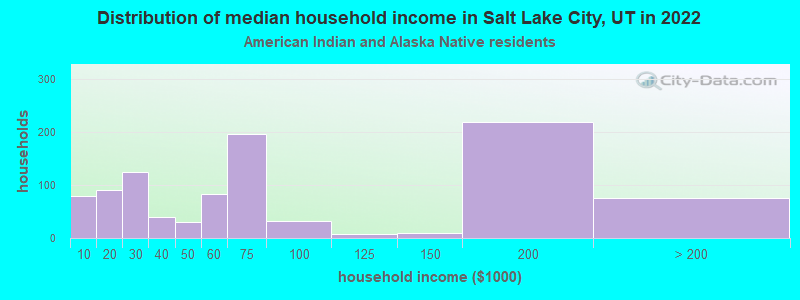
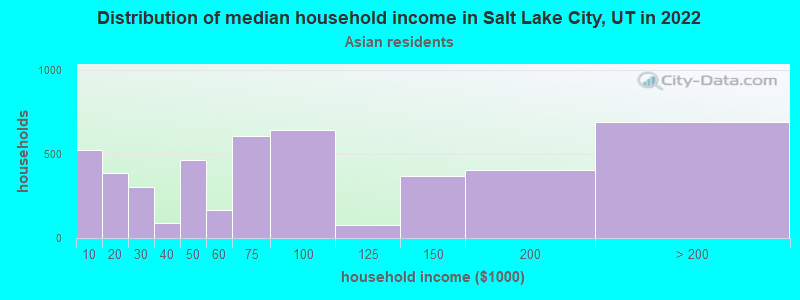
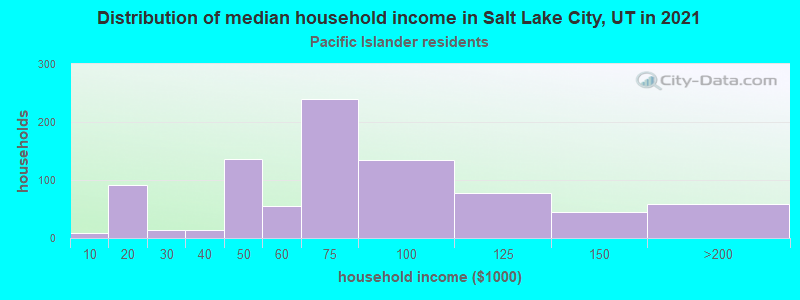
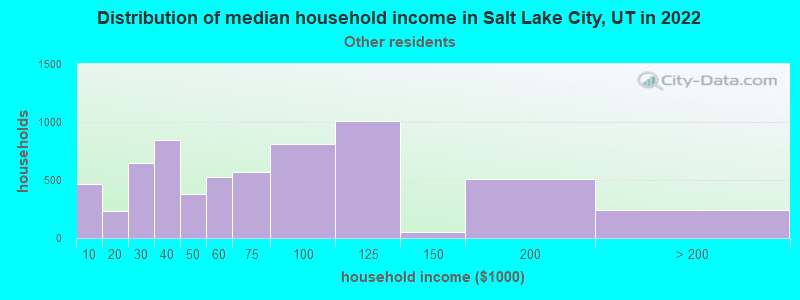
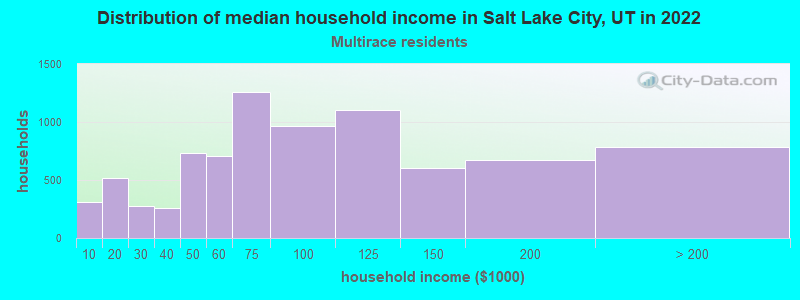
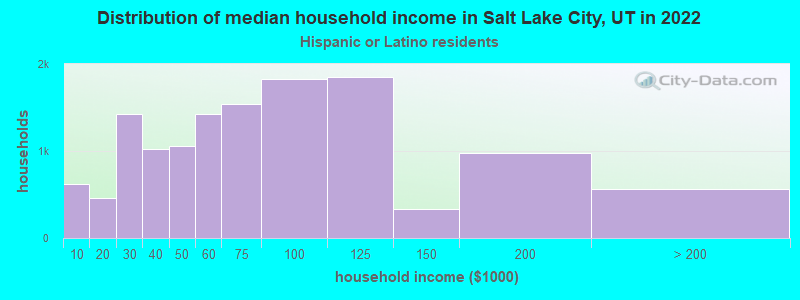
Income and house value in Salt Lake City Median household income in 2022 $80,035 White non-Hispanic householders$46,822 Black householders$69,895 American Indian and Alaska Native householders$70,259 Asian householders$69,727 Native Hawaiian and other Pacific Islander householders$65,987 Some other race householders$75,477 Two or more races householders$68,147 Hispanic or Latino race householdersMedian 2022 house value $601,001 White Non-Hispanic householders$422,844 Black or African American householders$432,085 American Indian or Alaska Native householders $543,710 Asian householders$419,148 Native Hawaiian and other Pacific Islander householders$423,583 Some other race householders$528,555 Two or more races householders$439,107 Hispanic or Latino householders
Median age by race in Salt Lake City
33.5 Median age for White residents35.1 32.1 32.2 Median age for Black or African American residents29.0 32.2 31.9 Median age for American Indian / Alaska Native residents25.9 42.1 30.8 Median age for Asian residents31.2 30.6 36.2 Median age for Native Hawaiian / Pacific Islander residents36.2 41.2 28.8 Median age for Other race residents28.8 28.7 25.1 Median age for Two or more races residents27.0 22.6 34.8 Median age for White alone residents35.8 33.4 25.6 Median age for Hispanic or Latino residents27.4 24.4
Owner/renter occupied households by race in Salt Lake City
House owners and renters - White residents 32,801 48.8% Owner occupied34,423 51.2% Renter occupiedHouse owners and renters - Black or African American residents 101 4.8% Owner occupied2,004 95.2% Renter occupiedHouse owners and renters - American Indian / Alaska Native residents 334 32.4% Owner occupied698 67.6% Renter occupiedHouse owners and renters - Asian residents 1,398 29.6% Owner occupied3,331 70.4% Renter occupiedHouse owners and renters - Native Hawaiian / Pacific Islander residents 310 35.8% Owner occupied557 64.2% Renter occupiedHouse owners and renters - Other race residents 2,798 44.4% Owner occupied3,497 55.6% Renter occupiedHouse owners and renters - Two or more races residents 3,033 37.1% Owner occupied5,142 62.9% Renter occupiedHouse owners and renters - White alone residents 31,691 49.1% Owner occupied32,850 50.9% Renter occupiedHouse owners and renters - Hispanic or Latino residents 5,378 41.0% Owner occupied7,726 59.0% Renter occupied
Language usage in Salt Lake City
English speakers - Total 74.7% of residents of Salt Lake City speak English at home.
14.0% of residents speak Spanish at home 18,156 66.0% Speak English very well9,372 34.0% Speak English less than very well11.3% of residents speak other language at home 15,743 70.9% Speak English very well6,448 29.1% Speak English less than very well
English speakers - Born in the United States 91.2% of residents of Salt Lake City speak English at home.
5.9% of residents speak Spanish at home 4,549 97.0% Speak English very well142 3.0% Speak English less than very well2.9% of residents speak other language at home 2,202 96.1% Speak English very well90 3.9% Speak English less than very well
English speakers - Native, born elsewhere 72.1% of residents of Salt Lake City speak English at home.
17.1% of residents speak Spanish at home 353 87.8% Speak English very well49 12.2% Speak English less than very well10.8% of residents speak other language at home 204 80.6% Speak English very well49 19.4% Speak English less than very well
English speakers - Foreign-born 14.8% of residents of Salt Lake City speak English at home.
40.5% of residents speak Spanish at home 4,964 36.4% Speak English very well8,663 63.6% Speak English less than very well44.8% of residents speak other language at home 9,097 60.3% Speak English very well5,981 39.7% Speak English less than very well
White (Caucasian) - Speak only English Native:
94.4% (120,023)Foreign-born:
25.1% (1,981)
White (Caucasian) - Speak another language Native:
5.6% (7,078)Foreign-born:
74.9% (5,917)
Black or African American - Speak only English Native:
64.2% (2,444)Foreign-born:
27.6% (505)
Black or African American - Speak another language Native:
39.8% (1,516)Foreign-born:
73.2% (1,336)
American Indian / Alaska Native - Speak only English Native:
56.6% (1,024)Foreign-born:
1.9% (23)
American Indian / Alaska Native - Speak another language Native:
42.8% (775)Foreign-born:
92.7% (1,096)
Asian - Speak only English Native:
41.1% (1,578)Foreign-born:
10.2% (785)
Asian - Speak another language Native:
58.9% (2,264)Foreign-born:
89.8% (6,922)
Native Hawaiian / Pacific Islander - Speak only English Native:
58.8% (1,286)Foreign-born:
8.9% (119)
Native Hawaiian / Pacific Islander - Speak another language Native:
41.3% (903)Foreign-born:
95.7% (1,272)
Other race - Speak only English Native:
26.7% (2,419)Foreign-born:
8.7% (710)
Other race - Speak another language Native:
73.3% (6,631)Foreign-born:
91.3% (7,421)
Two or more races - Speak only English Native:
79.4% (13,089)Foreign-born:
11.6% (640)
Two or more races - Speak another language Native:
20.6% (3,405)Foreign-born:
88.4% (4,883)
White alone - Speak only English Native:
95.5% (115,748)Foreign-born:
27.6% (1,981)
White alone - Speak another language Native:
4.5% (5,402)Foreign-born:
72.4% (5,190)
Hispanic or Latino - Speak only English Native:
49.5% (11,266)Foreign-born:
6.4% (936)
Hispanic or Latino - Speak another language Native:
50.5% (11,472)Foreign-born:
93.6% (13,678)
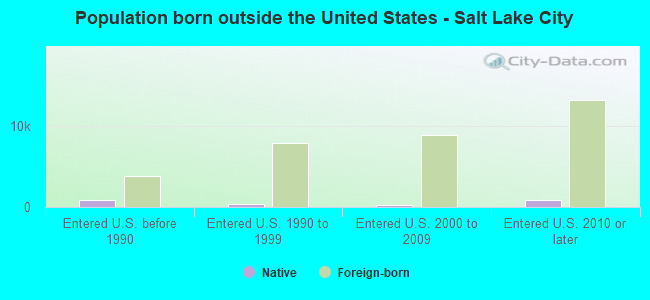
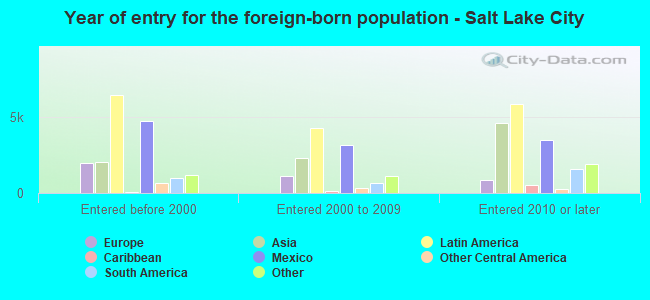
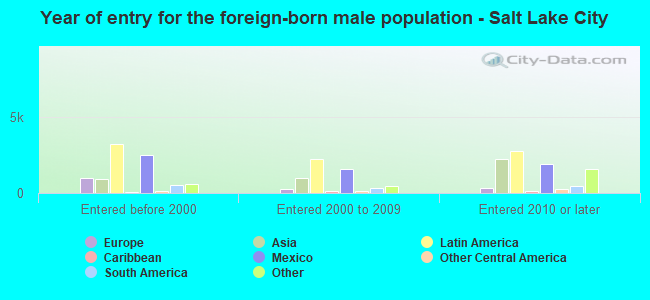
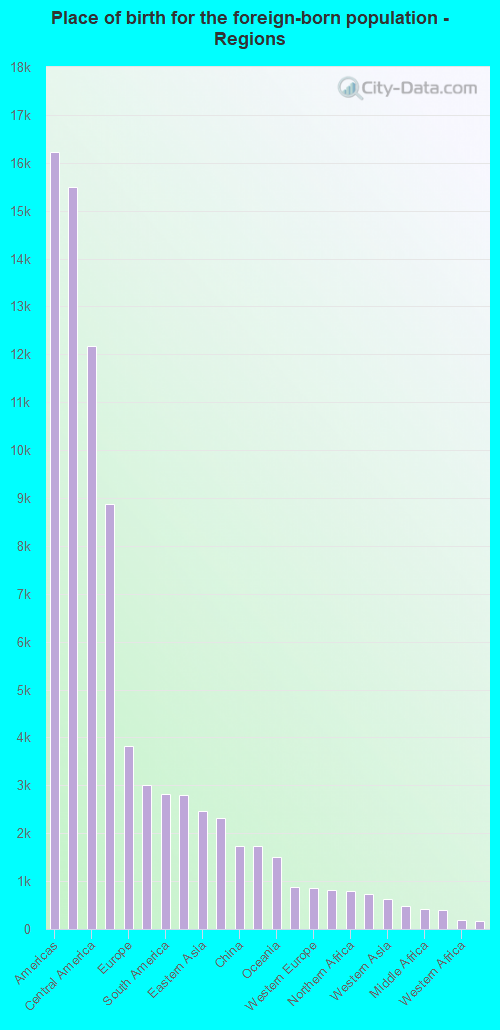
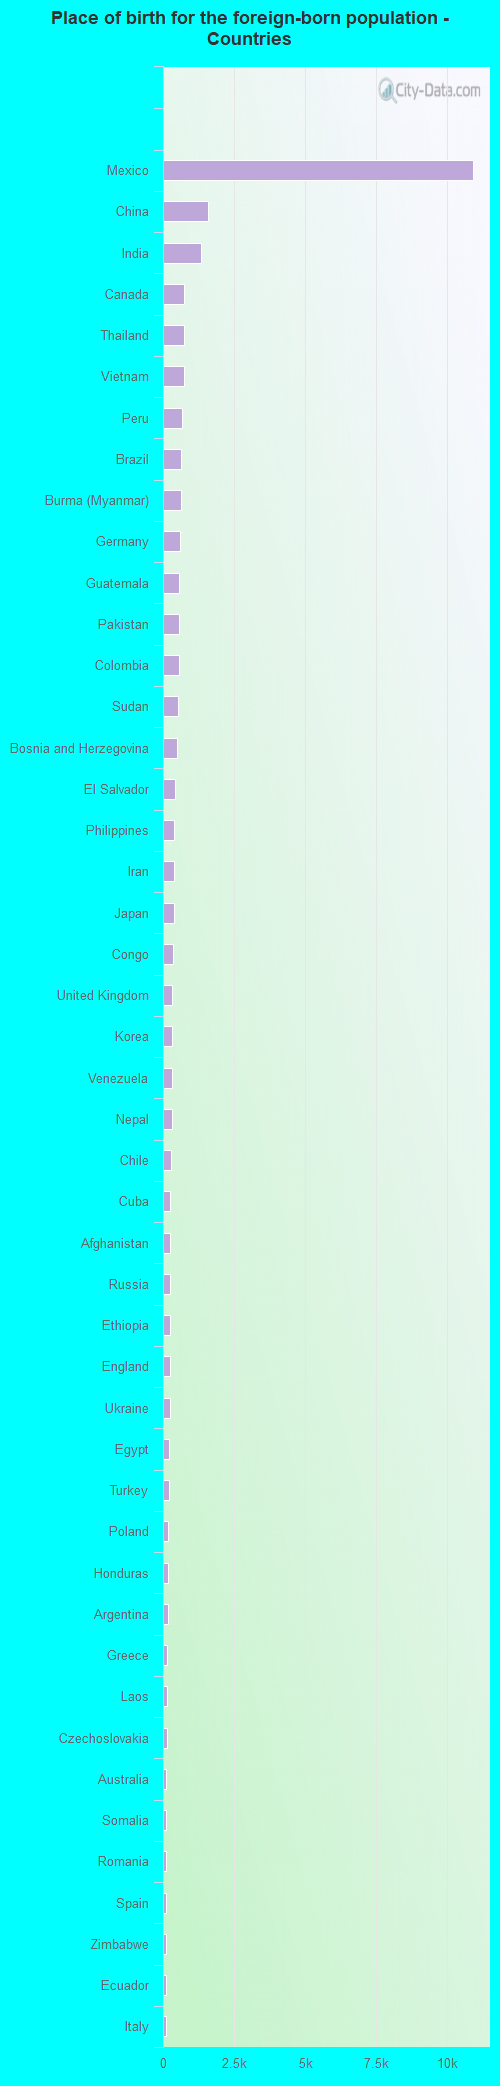
Foreign-born residents in Salt Lake City 32,774 residents are foreign born (7.3% Latin America , 4.2% Asia , 1.8% Europe ).
Marital status for residents in Salt Lake City Marital status - White (Caucasian) population 15 years and over
Males 47.8% Never married41.2% Now married0.4% Separated1.8% Widowed8.8% DivorcedFemales 42.0% Never married39.0% Now married1.9% Separated4.0% Widowed13.1% DivorcedWomen who gave birth in the past 12 months Now married:
95.6% (1,037)Unmarried:
4.4% (48)
Women who did not give birth in the past 12 months Now married:
33.1% (14,222)Unmarried:
66.9% (28,699)
Marital status - Black or African American population 15 years and over
Males 63.5% Never married25.9% Now married3.8% Separated1.8% Widowed5.0% DivorcedFemales 48.5% Never married37.7% Now married0.0% Separated0.1% Widowed13.8% DivorcedWomen who gave birth in the past 12 months Now married:
75.8% (134)Unmarried:
24.2% (43)
Women who did not give birth in the past 12 months Now married:
32.8% (404)Unmarried:
67.2% (827)
Marital status - American Indian / Alaska Native population 15 years and over
Males 49.0% Never married37.7% Now married1.2% Separated0.0% Widowed12.1% DivorcedFemales 41.8% Never married37.7% Now married4.4% Separated5.0% Widowed11.0% DivorcedWomen who did not give birth in the past 12 months Now married:
45.0% (516)Unmarried:
55.0% (631)
Marital status - Asian population 15 years and over
Males 42.6% Never married51.1% Now married0.0% Separated0.0% Widowed6.3% DivorcedFemales 43.2% Never married48.0% Now married0.0% Separated4.7% Widowed4.1% DivorcedWomen who gave birth in the past 12 months Now married:
100.0% (97)Unmarried:
0.0% (0)
Women who did not give birth in the past 12 months Now married:
46.8% (1,906)Unmarried:
53.2% (2,171)
Marital status - Native Hawaiian / Pacific Islander population 15 years and over
Males 26.6% Never married62.0% Now married0.1% Separated0.0% Widowed11.3% DivorcedFemales 35.5% Never married51.9% Now married3.8% Separated6.4% Widowed2.5% DivorcedWomen who gave birth in the past 12 months Now married:
75.2% (94)Unmarried:
24.8% (31)
Women who did not give birth in the past 12 months Now married:
41.2% (375)Unmarried:
58.8% (535)
Marital status - Other race population 15 years and over
Males 59.9% Never married24.7% Now married9.3% Separated0.0% Widowed6.2% DivorcedFemales 43.3% Never married39.6% Now married7.8% Separated6.0% Widowed3.3% DivorcedWomen who gave birth in the past 12 months Now married:
100.0% (252)Unmarried:
0.0% (0)
Women who did not give birth in the past 12 months Now married:
34.4% (1,294)Unmarried:
65.6% (2,464)
Marital status - Two or more races population 15 years and over
Males 51.6% Never married33.9% Now married0.0% Separated3.6% Widowed11.0% DivorcedFemales 49.7% Never married36.8% Now married0.5% Separated3.2% Widowed9.9% DivorcedWomen who gave birth in the past 12 months Now married:
68.8% (110)Unmarried:
31.2% (50)
Women who did not give birth in the past 12 months Now married:
36.7% (2,365)Unmarried:
63.3% (4,081)
Marital status - White alone, not Hispanic / Latino population 15 years and over
Males 47.7% Never married41.2% Now married0.4% Separated1.7% Widowed9.0% DivorcedFemales 41.7% Never married38.3% Now married2.0% Separated4.1% Widowed13.9% DivorcedWomen who gave birth in the past 12 months Now married:
100.0% (1,037)Unmarried:
0.0% (0)
Women who did not give birth in the past 12 months Now married:
31.6% (12,493)Unmarried:
68.4% (27,104)
Marital status - Hispanic or Latino population 15 years and over
Males 52.7% Never married32.0% Now married5.2% Separated2.5% Widowed7.6% DivorcedFemales 45.1% Never married41.8% Now married3.3% Separated4.3% Widowed5.5% DivorcedWomen who gave birth in the past 12 months Now married:
78.7% (362)Unmarried:
21.3% (98)
Women who did not give birth in the past 12 months Now married:
41.6% (4,717)Unmarried:
58.4% (6,626)
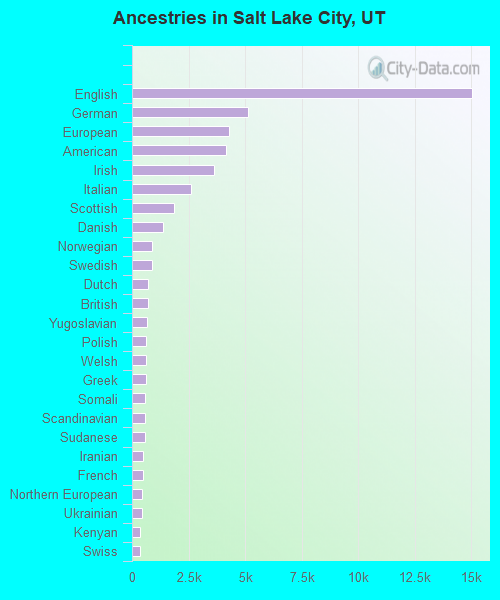
Ancestries in Salt Lake City
15,036 14.0% English5,109 4.7% German4,277 4.0% European4,169 3.9% American3,638 3.4% Irish2,601 2.4% Italian1,875 1.7% Scottish1,370 1.3% Danish904 0.8% Norwegian903 0.8% Swedish726 0.7% Dutch708 0.7% British674 0.6% Yugoslavian641 0.6% Polish616 0.6% Welsh609 0.6% Greek570 0.5% Somali558 0.5% Scandinavian555 0.5% Sudanese492 0.5% Iranian478 0.4% French451 0.4% Northern European442 0.4% Ukrainian356 0.3% Kenyan355 0.3% Swiss350 0.3% Egyptian311 0.3% Lebanese301 0.3% Russian295 0.3% Scotch-Irish277 0.3% African275 0.3% Ethiopian257 0.2% Eastern European234 0.2% Brazilian195 0.2% French Canadian173 0.2% Canadian170 0.2% Haitian156 0.1% Austrian155 0.1% Afghan143 0.1% Serbian134 0.1% Nigerian115 0.1% Czech104 0.10% Finnish99 0.09% Belgian97 0.09% Romanian94 0.09% Slovak88 0.08% Slavic77 0.07% Portuguese76 0.07% Armenian76 0.07% South African60 0.06% Ugandan47 0.04% Cajun45 0.04% Lithuanian43 0.04% Palestinian41 0.04% Croatian35 0.03% New Zealander35 0.03% Zimbabwean34 0.03% Guyanese34 0.03% Arab32 0.03% Turkish31 0.03% Ghanaian31 0.03% Jordanian30 0.03% Basque23 0.02% Iraqi18 0.02% Bulgarian17 0.02% Trinidadian and Tobagonian16 0.01% Albanian16 0.01% Maltese16 0.01% West Indian11 0.01% Australian11 0.01% Moroccan10 0.01% Syrian9 0.01% Czechoslovakian7 0.01% Latvian
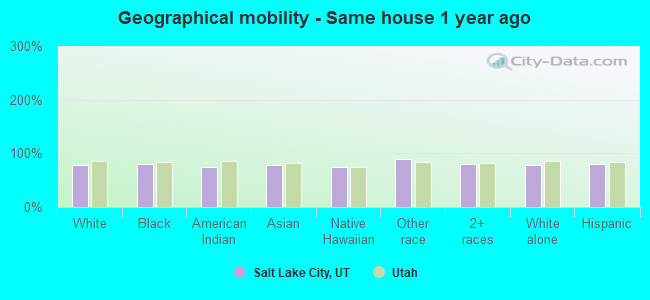
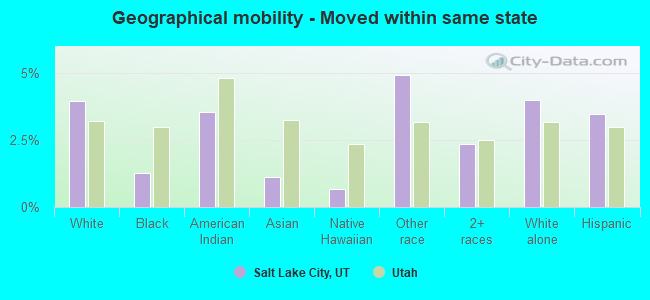
Geographical mobility in Salt Lake City Same house 1 year ago 107,445 77.7% White (Caucasian)4,906 80.4% Black or African American1,827 74.3% American Indian / Alaska Native9,211 78.0% Asian2,845 74.7% Native Hawaiian / Pacific Islander15,571 89.2% Other race19,601 80.2% Two or more races101,625 77.7% White alone, not Hispanic / Latino32,411 81.0% Hispanic or LatinoMoved within same county 15,570 11.3% White / Caucasian491 8.0% Black or African American364 14.8% American Indian / Alaska Native1,247 10.6% Asian727 19.1% Native Hawaiian / Pacific Islander627 3.6% Other race2,746 11.2% Two or more races14,626 11.2% White alone, not Hispanic / Latino4,595 11.5% Hispanic or LatinoMoved within same state 5,439 3.9% White / Caucasian78 1.3% Black or African American87 3.6% American Indian / Alaska Native134 1.1% Asian26 0.7% Native Hawaiian / Pacific Islander858 4.9% Other race575 2.4% Two or more races5,197 4.0% White alone, not Hispanic / Latino1,380 3.4% Hispanic or LatinoMoved from different state 8,969 6.5% White / Caucasian261 4.3% Black or African American56 2.3% American Indian / Alaska Native642 5.4% Asian180 4.7% Native Hawaiian / Pacific Islander133 0.8% Other race1,345 5.5% Two or more races8,380 6.4% White alone, not Hispanic / Latino1,372 3.4% Hispanic or LatinoMoved from abroad 883 0.6% White103 1.7% Black or African American35 1.4% American Indian / Alaska Native582 4.9% Asian270 1.5% Other race170 0.7% Two or more races883 0.7% White alone, not Hispanic / Latino270 0.7% Hispanic or Latino
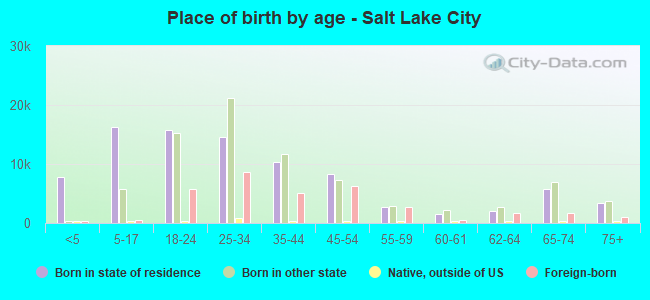
Children Nativity (place of birth) in Salt Lake City
Children under 6 years - Living with two parents Both parents native 5,064 100.0% NativeBoth parents foreign-born 935 100.0% NativeOne native, one foreign-born parent 1,442 100.0% NativeChildren under 6 years - Living with one parent Native parent 1,306 100.0% NativeForeign-born parent 1,025 100.0% NativeChildren 6 to 17 years - Living with two parents Both parents native 7,624 98.3% Native129 1.7% Foreign-bornBoth parents foreign-born 2,437 87.4% Native352 12.6% Foreign-bornOne native, one foreign-born parent 1,224 100.0% NativeChildren 6 to 17 years - Living with one parent Native parent 4,709 100.0% NativeForeign-born parent 2,493 50.0% Native2,493 50.0% Foreign-born
Place of birth for residents in Salt Lake City 16,227 Americas15,486 Latin America12,183 Central America8,882 Asia3,826 Europe2,997 South Central Asia2,813 South America2,794 South Eastern Asia2,456 Eastern Asia2,328 Africa1,741 China1,734 Eastern Europe1,509 Oceania877 Eastern Africa864 Western Europe823 Northern Europe791 Northern Africa740 Northern America634 Western Asia489 Caribbean426 Middle Africa403 Southern Europe194 Western Africa177 Australia and New Zealand Subregion34 Southern Africa10,927 Mexico1,576 China1,339 India740 Canada737 Thailand733 Vietnam667 Peru625 Brazil617 Burma (Myanmar)595 Germany572 Guatemala567 Pakistan566 Colombia541 Sudan504 Bosnia and Herzegovina406 El Salvador400 Philippines391 Iran380 Japan336 Congo334 United Kingdom330 Korea321 Venezuela317 Nepal295 Chile258 Cuba249 Afghanistan248 Russia247 Ethiopia243 England234 Ukraine219 Egypt210 Turkey173 Poland167 Honduras159 Argentina150 Greece137 Laos127 Czechoslovakia118 Australia112 Somalia110 Romania110 Spain103 Zimbabwe103 Ecuador100 Italy93 Dominican Republic92 Switzerland86 Costa Rica86 Malaysia84 Taiwan83 Haiti80 Croatia79 Hong Kong77 Eritrea70 Netherlands68 Saudi Arabia67 Democratic Republic of Congo (Zaire)63 Uganda61 Denmark60 Kuwait60 Iraq59 New Zealand58 Bangladesh57 Ireland56 Serbia56 Armenia50 France48 Nigeria46 Kenya45 Ghana44 Lebanon42 Sweden42 Moldova41 Georgia39 Bolivia37 Scotland37 Syria37 Sri Lanka34 Jamaica34 South Africa34 Belgium33 Guyana31 Indonesia29 Kazakhstan28 Cambodia27 Bulgaria25 Portugal23 Liberia22 Morocco21 Israel21 Singapore20 Norway20 Austria19 Barbados13 Belarus11 Jordan8 Algeria
Grandparents responsible for own grandchildren in Salt Lake City
Grandparents (30 to 59 years) White / Caucasian 71 19.8% Responsible for grandchildren287 80.2% Not responsible for grandchildrenBlack or African American 27 100.0% Not responsible for grandchildrenAsian 7 26.9% Responsible for grandchildren18 73.1% Not responsible for grandchildrenNative Hawaiian / Pacific Islander 103 53.0% Responsible for grandchildren92 47.0% Not responsible for grandchildrenOther race 62 11.4% Responsible for grandchildren484 88.6% Not responsible for grandchildrenTwo or more races 16 66.1% Responsible for grandchildren8 33.9% Not responsible for grandchildrenWhite alone, not Hispanic / Latino 51 17.7% Responsible for grandchildren240 82.3% Not responsible for grandchildrenHispanic or Latino 105 17.2% Responsible for grandchildren505 82.8% Not responsible for grandchildrenGrandparents (60 years and over) White / Caucasian 187 29.1% Responsible for grandchildren456 70.9% Not responsible for grandchildrenAsian 6 6.4% Responsible for grandchildren87 93.6% Not responsible for grandchildrenNative Hawaiian / Pacific Islander 76 100.0% Not responsible for grandchildrenOther race 81 17.6% Responsible for grandchildren378 82.4% Not responsible for grandchildrenTwo or more races 232 100.0% Not responsible for grandchildrenWhite alone, not Hispanic / Latino 184 29.4% Responsible for grandchildren443 70.6% Not responsible for grandchildrenHispanic or Latino 145 23.3% Responsible for grandchildren478 76.7% Not responsible for grandchildren
Zip codes: 84101 , 84102 , 84103 , 84104 , 84105 , 84111 , 84112 , 84113 , 84115 , 84116 , 84119 , 84128 , 84144 , 84180.