Estimated zip code population in 2022: 33,212 Zip code population in 2010: 27,983 Zip code population in 2000: 20,620
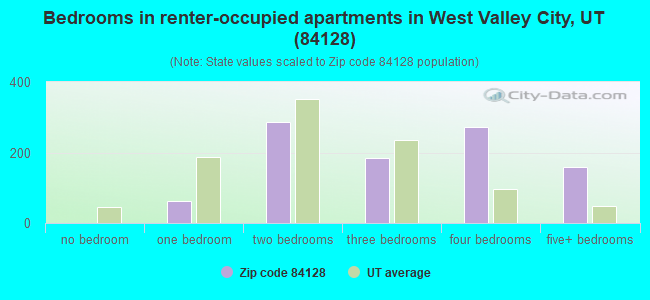
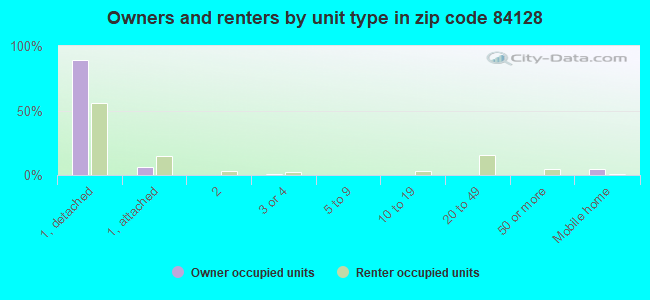
Houses and condos: 8,945 Renter-occupied apartments: 950
% of renters here:
11%
State:
29%
March 2022 cost of living index in zip code 84128: 92.8 (less than average, U.S. average is 100)
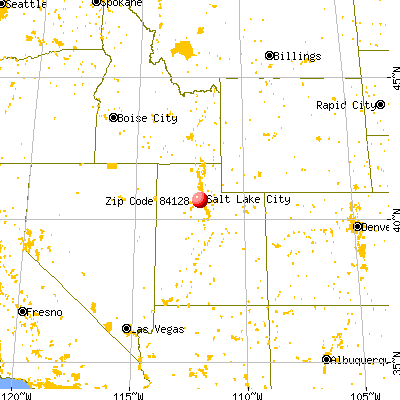
Land area: 10.2 sq. mi. Water area: 0.0 sq. mi.
Population density: 3,247 people per square mile
(average).
OSM Map
General Map
Google Map
MSN Map
OSM Map
General Map
Google Map
MSN Map
OSM Map
General Map
Google Map
MSN Map
OSM Map
General Map
Google Map
MSN Map
Please wait while loading the map...
Real estate property taxes paid for housing units in 2022:
This zip code:
0.6% ($2,449)
Utah:
0.5% ($2,376)
Median real estate property taxes paid for housing units with mortgages in 2022: $2,439 (0.6%) Median real estate property taxes paid for housing units with no mortgage in 2022: $2,488 (0.6%)
Business Search- 14 Million verified businesses
Males: 15,597
(47.0%)
Females: 17,612
(53.0%)
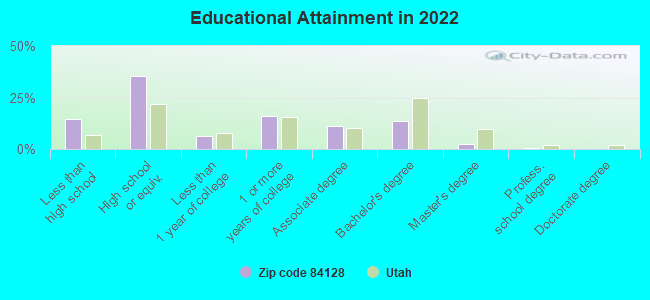
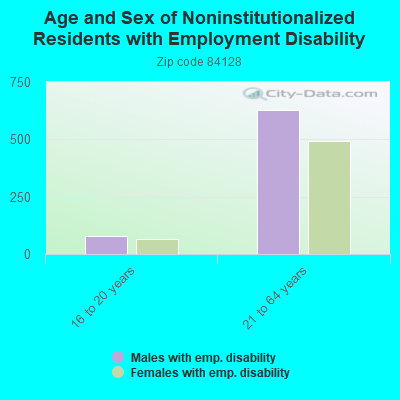
For population 25 years and over in 84128:
High school or higher: 84.4%
Bachelor's degree or higher: 16.4%
Graduate or professional degree: 3.1%
Unemployed: 4.2%
Mean travel time to work (commute): 23.9 minutes
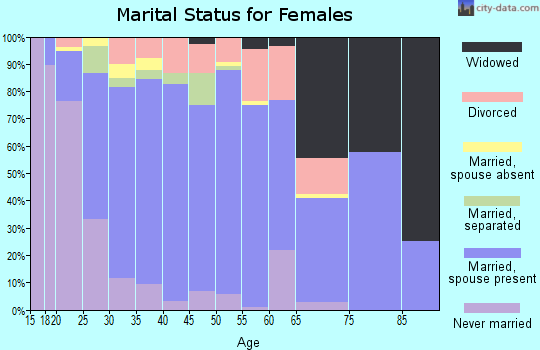
For population 15 years and over in 84128:
Never married: 30.3%
Now married: 57.3%
Separated: 3.2%
Widowed: 1.9%
Divorced: 7.3%
Zip code 84128 compared to state average:
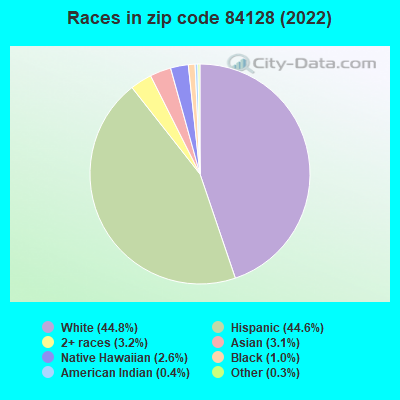
Hispanic race population percentage significantly above state average.
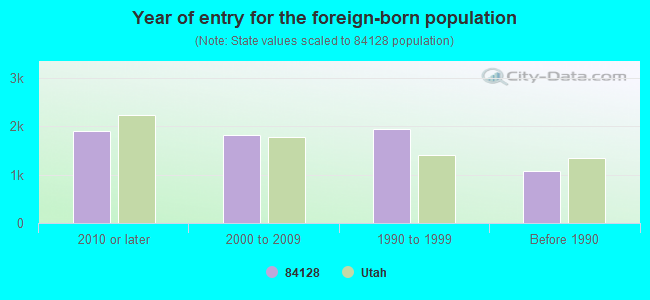
Foreign-born population percentage significantly above state average.
Renting percentage significantly below state average.
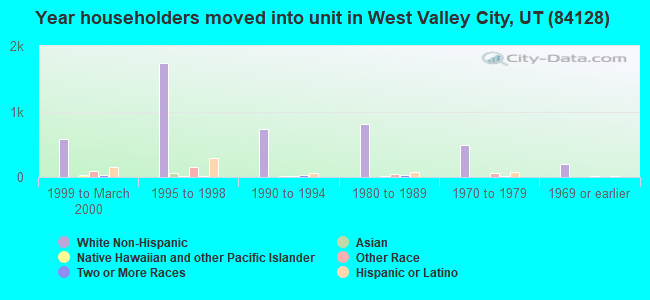
Length of stay since moving in significantly above state average.
Percentage of population with a bachelor's degree or higher significantly below state average.
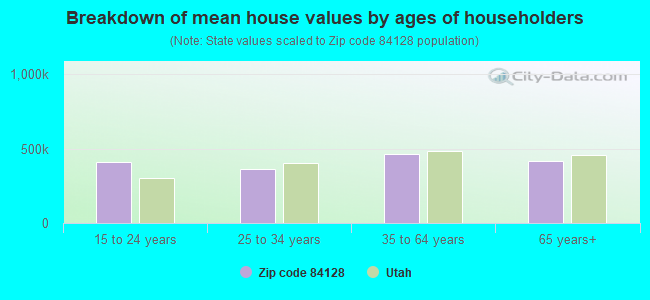
Estimated median house/condo value in 2022: $421,243
84128:
$421,243
Utah:
$499,500
According to our research of Utah and other state lists, there were 68 registered sex offenders living in 84128 zip code as of May 09, 2024. The ratio of all residents to sex offenders in zip code 84128 is 397 to 1. The ratio of registered sex offenders to all residents in this zip code is near the state average.
Median resident age:
This zip code:
31.3 years
Utah median age:
32.1 years
Average household size:
This zip code:
3.8 people
Utah:
3.0 people
Averages for the 2020 tax year for zip code 84128, filed in 2021:
Average Adjusted Gross Income (AGI) in 2020: $52,769 (Individual Income Tax Returns)
Here:
$52,769
State:
$81,660
Salary/wage: $48,931 (reported on 91.0% of returns)
Here:
$48,931
State:
$63,027
(% of AGI for various income ranges: 1318.8% for AGIs below $25k, 3964.7% for AGIs $25k-50k, 7408.6% for AGIs $50k-75k, 10822.0% for AGIs $75k-100k, 20531.7% for AGIs $100k-200k, 54927.5% for AGIs over 200k)
Taxable interest for individuals: $564 (reported on 16.6% of returns)
This zip code:
$564
Utah:
$2,255
(% of AGI for various income ranges: 5.4% for AGIs below $25k, 6.6% for AGIs $25k-50k, 15.2% for AGIs $50k-75k, 11.9% for AGIs $75k-100k, 31.3% for AGIs $100k-200k, 652.5% for AGIs over 200k)
Ordinary dividends: $1,361 (reported on 6.4% of returns)
Here:
$1,361
State:
$7,362
(% of AGI for various income ranges: 2.7% for AGIs below $25k, 6.3% for AGIs $25k-50k, 14.0% for AGIs $50k-75k, 17.2% for AGIs $75k-100k, 29.1% for AGIs $100k-200k, 597.5% for AGIs over 200k)
Net capital gain/loss in AGI: +$16,991 (reported on 6.2% of returns)
Here:
+$16,991
State:
+$43,433
(% of AGI for various income ranges: 2.4% for AGIs below $25k, 5.5% for AGIs $25k-50k, 15.1% for AGIs $50k-75k, 42.3% for AGIs $75k-100k, 223.3% for AGIs $100k-200k, 30675.0% for AGIs over 200k)
Profit/loss from business: +$8,826 (reported on 12.8% of returns)
Here:
+$8,826
State:
+$9,957
(% of AGI for various income ranges: 133.7% for AGIs below $25k, 97.1% for AGIs $25k-50k, 151.7% for AGIs $50k-75k, 148.3% for AGIs $75k-100k, 283.5% for AGIs $100k-200k, 4087.5% for AGIs over 200k)
Taxable individual retirement arrangement distribution: $14,698 (reported on 3.6% of returns)
84128:
$14,698
Utah:
$21,167
(% of AGI for various income ranges: 22.4% for AGIs below $25k, 32.8% for AGIs $25k-50k, 58.2% for AGIs $50k-75k, 108.9% for AGIs $75k-100k, 400.2% for AGIs $100k-200k)
Total itemized deductions: $25,634 (reported on 7.5% of returns)
Here:
$25,634
State:
$41,056
(% of AGI for various income ranges: 22.4% for AGIs below $25k, 103.1% for AGIs $25k-50k, 312.4% for AGIs $50k-75k, 441.8% for AGIs $75k-100k, 1179.8% for AGIs $100k-200k, 5580.0% for AGIs over 200k)
Charity contributions: $8,962 (reported on 5.3% of returns)
Here:
$8,962
State:
$22,261
(% of AGI for various income ranges: 1.8% for AGIs below $25k, 11.3% for AGIs $25k-50k, 47.3% for AGIs $50k-75k, 89.6% for AGIs $75k-100k, 413.1% for AGIs $100k-200k, 2387.5% for AGIs over 200k)
Taxes paid: $6,619 (reported on 7.5% of returns)
84128:
$6,619
State:
$7,985
(% of AGI for various income ranges: 3.4% for AGIs below $25k, 22.0% for AGIs $25k-50k, 76.6% for AGIs $50k-75k, 121.0% for AGIs $75k-100k, 340.7% for AGIs $100k-200k, 1240.0% for AGIs over 200k)
Earned income credit: $2,326 (reported on 15.7% of returns)
Here:
$2,326
State:
$2,169
(% of AGI for various income ranges: 87.2% for AGIs below $25k, 67.7% for AGIs $25k-50k, 2.3% for AGIs $50k-75k)
Percentage of individuals using paid preparers for their 2020 taxes: 93.6%
Here:
94%
State:
94%
(% for various income ranges: 92.2% for AGIs below $25k, 93.7% for AGIs $25k-50k, 94.8% for AGIs $50k-75k, 94.5% for AGIs $75k-100k, 94.0% for AGIs $100k-200k, 92.3% for AGIs over 200k)
Averages for the 2012 tax year for zip code 84128, filed in 2013:
Average Adjusted Gross Income (AGI) in 2012: $42,723 (Individual Income Tax Returns)
Here:
$42,723
State:
$60,327
Salary/wage: $40,626 (reported on 93.6% of returns)
Here:
$40,626
State:
$48,762
(% of AGI for various income ranges: 86.6% for AGIs below $25k, 91.3% for AGIs $25k-50k, 90.3% for AGIs $50k-75k, 90.9% for AGIs $75k-100k, 88.6% for AGIs $100k-200k, 51.6% for AGIs over 200k)
Taxable interest for individuals: $349 (reported on 22.2% of returns)
This zip code:
$349
Utah:
$1,534
(% of AGI for various income ranges: 0.3% for AGIs below $25k, 0.1% for AGIs $25k-50k, 0.2% for AGIs $50k-75k, 0.2% for AGIs $75k-100k, 0.1% for AGIs $100k-200k, 0.9% for AGIs over 200k)
Ordinary dividends: $815 (reported on 6.0% of returns)
Here:
$815
State:
$5,711
(% of AGI for various income ranges: 0.1% for AGIs below $25k, 0.1% for AGIs $25k-50k, 0.2% for AGIs $100k-200k)
Net capital gain/loss in AGI: +$3,222 (reported on 4.1% of returns)
Here:
+$3,222
State:
+$23,734
(% of AGI for various income ranges: 1.7% for AGIs $100k-200k)
Profit/loss from business: +$6,646 (reported on 11.8% of returns)
Here:
+$6,646
State:
+$8,845
(% of AGI for various income ranges: 5.9% for AGIs below $25k, 1.5% for AGIs $25k-50k, 1.4% for AGIs $50k-75k, 1.0% for AGIs $75k-100k, 1.3% for AGIs $100k-200k)
Taxable individual retirement arrangement distribution: $10,466 (reported on 3.7% of returns)
84128:
$10,466
Utah:
$15,565
(% of AGI for various income ranges: 0.7% for AGIs below $25k, 0.6% for AGIs $25k-50k, 0.9% for AGIs $50k-75k, 1.0% for AGIs $75k-100k, 1.6% for AGIs $100k-200k)
Total itemized deductions: $17,949 (26% of AGI, reported on 35.6% of returns)
Here:
$17,949
State:
$25,197
Here:
26.1% of AGI
State:
22.4% of AGI
(% of AGI for various income ranges: 6.5% for AGIs below $25k, 12.4% for AGIs $25k-50k, 18.0% for AGIs $50k-75k, 17.9% for AGIs $75k-100k, 17.4% for AGIs $100k-200k, 11.5% for AGIs over 200k)
Charity contributions: $3,885 (reported on 28.0% of returns)
Here:
$3,885
State:
$8,502
(% of AGI for various income ranges: 0.6% for AGIs below $25k, 1.3% for AGIs $25k-50k, 3.1% for AGIs $50k-75k, 3.2% for AGIs $75k-100k, 3.9% for AGIs $100k-200k, 4.5% for AGIs over 200k)
Taxes paid: $4,614 (reported on 35.4% of returns)
84128:
$4,614
State:
$7,001
(% of AGI for various income ranges: 1.0% for AGIs below $25k, 2.5% for AGIs $25k-50k, 4.4% for AGIs $50k-75k, 5.1% for AGIs $75k-100k, 5.4% for AGIs $100k-200k, 4.7% for AGIs over 200k)
Earned income credit: $2,444 (reported on 21.8% of returns)
Here:
$2,444
State:
$2,259
(% of AGI for various income ranges: 7.3% for AGIs below $25k, 1.5% for AGIs $25k-50k)
Percentage of individuals using paid preparers for their 2012 taxes: 53.0%
Here:
53%
State:
51%
(% for various income ranges: 52.8% for AGIs below $25k, 56.1% for AGIs $25k-50k, 52.4% for AGIs $50k-75k, 47.4% for AGIs $75k-100k, 47.0% for AGIs $100k-200k, 100.0% for AGIs over 200k)
Averages for the 2004 tax year for zip code 84128, filed in 2005:
Average Adjusted Gross Income (AGI) in 2004: $36,699 (Individual Income Tax Returns)
Here:
$36,699
State:
$45,498
Salary/wage: $35,722 (reported on 94.8% of returns)
Here:
$35,722
State:
$38,975
(% of AGI for various income ranges: 108.2% for AGIs below $10k, 91.1% for AGIs $10k-25k, 93.6% for AGIs $25k-50k, 92.2% for AGIs $50k-75k, 92.0% for AGIs $75k-100k, 85.0% for AGIs over 100k)
Taxable interest for individuals: $293 (reported on 34.3% of returns)
This zip code:
$293
Utah:
$1,445
(% of AGI for various income ranges: 0.9% for AGIs below $10k, 0.5% for AGIs $10k-25k, 0.2% for AGIs $25k-50k, 0.2% for AGIs $50k-75k, 0.3% for AGIs $75k-100k, 0.5% for AGIs over 100k)
Taxable dividends: $508 (reported on 8.5% of returns)
Here:
$508
State:
$3,152
(% of AGI for various income ranges: 0.6% for AGIs below $10k, 0.2% for AGIs $10k-25k, 0.1% for AGIs $25k-50k, 0.1% for AGIs $50k-75k, 0.1% for AGIs $75k-100k, 0.2% for AGIs over 100k)
Net capital gain/loss: +$1,880 (reported on 6.4% of returns)
Here:
+$1,880
State:
+$14,059
(% of AGI for various income ranges: -0.8% for AGIs below $10k, 0.1% for AGIs $10k-25k, 0.0% for AGIs $25k-50k, 0.3% for AGIs $50k-75k, 0.5% for AGIs $75k-100k, 2.2% for AGIs over 100k)
Profit/loss from business: +$3,280 (reported on 12.0% of returns)
Here:
+$3,280
State:
+$6,903
(% of AGI for various income ranges: 0.9% for AGIs below $10k, 1.8% for AGIs $10k-25k, 1.0% for AGIs $25k-50k, 1.0% for AGIs $50k-75k, 0.8% for AGIs $75k-100k, 1.0% for AGIs over 100k)
IRA payment deduction: $1,586 (reported on 1.4% of returns)
84128:
$1,586
Utah:
$2,970
(% of AGI for various income ranges: 0.0% for AGIs $10k-25k, 0.1% for AGIs $25k-50k, 0.1% for AGIs $50k-75k, 0.1% for AGIs $75k-100k)
Total itemized deductions: $15,273 (28% of AGI, reported on 44.1% of returns)
Here:
$15,273
State:
$20,312
Here:
27.9% of AGI
State:
24.9% of AGI
(% of AGI for various income ranges: 7.3% for AGIs below $10k, 8.8% for AGIs $10k-25k, 18.8% for AGIs $25k-50k, 21.3% for AGIs $50k-75k, 20.2% for AGIs $75k-100k, 17.7% for AGIs over 100k)
Charity contributions deductions: $2,947 (5% of AGI, reported on 38.1% of returns)
Here:
$2,947
State:
$6,250
Here:
5.2% of AGI
State:
7.4% of AGI
(% of AGI for various income ranges: 0.4% for AGIs below $10k, 0.9% for AGIs $10k-25k, 2.7% for AGIs $25k-50k, 3.7% for AGIs $50k-75k, 3.8% for AGIs $75k-100k, 4.6% for AGIs over 100k)
Total tax: $3,224 (reported on 68.0% of returns)
84128:
$3,224
State:
$6,523
(% of AGI for various income ranges: 2.1% for AGIs below $10k, 3.2% for AGIs $10k-25k, 4.3% for AGIs $25k-50k, 6.1% for AGIs $50k-75k, 8.3% for AGIs $75k-100k, 13.2% for AGIs over 100k)
Earned income credit: $1,805 (reported on 16.3% of returns)
Here:
$1,805
State:
$1,703
Percentage of individuals using paid preparers for their 2004 taxes: 52.1%
Here:
52%
State:
53%
(% for various income ranges: 43.6% for AGIs below $10k, 54.9% for AGIs $10k-25k, 54.9% for AGIs $25k-50k, 51.3% for AGIs $50k-75k, 50.4% for AGIs $75k-100k, 52.1% for AGIs over 100k)
Likely homosexual households (counted as self-reported same-sex unmarried-partner households)
Lesbian couples: 0.2% of all households
Gay men: 0.1% of all households
Household received Food Stamps/SNAP in the past 12 months: 306 Household did not receive Food Stamps/SNAP in the past 12 months: 8,561
Women who had a birth in the past 12 months: 258 (177 now married, 74 unmarried) Women who did not have a birth in the past 12 months: 8,534 (4,086 now married, 4,450 unmarried)
Housing units in zip code 84128 with a mortgage: 6,333 (739 second mortgage, 6 home equity loan, 590 both second mortgage and home equity loan) Houses without a mortgage: 334
Median monthly owner costs for units with a mortgage: $1,656 Median monthly owner costs for units without a mortgage: $483
Residents with income below the poverty level in 2022:
This zip code:
5.5%
Whole state:
8.2%
Residents with income below 50% of the poverty level in 2022:
This zip code:
3.2%
Whole state:
4.3%
Median number of rooms in houses and condos:
Here:
7.3
State:
7.6
Median number of rooms in apartments:
Here:
6.1
State:
4.3
Notable locations in this zip code not listed on our city pages
Size of family households: 1,781 2-persons, 1,615 3-persons, 1,722 4-persons, 1,301 5-persons, 474 6-persons, 731 7-or-more-persons
Size of nonfamily households: 811 1-person, 254 2-persons, 156 3-persons
7,024 married couples with children.
1,186 single-parent households (558 men, 628 women).
58.9% of residents of 84128 zip code speak English at home.
36.0% of residents speak Spanish at home (61% very well, 18% well, 16% not well, 5% not at all).
1.1% of residents speak other Indo-European language at home (43% very well, 20% well, 36% not well).
3.9% of residents speak Asian or Pacific Island language at home (66% very well, 18% well, 12% not well, 4% not at all).
0.4% of residents speak other language at home (100% very well).
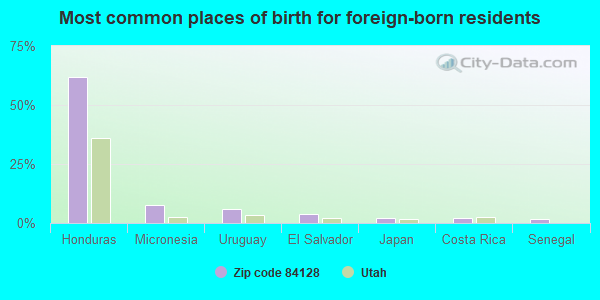
Foreign born population: 6,466 (19.5%) (34.9% of them are naturalized citizens)
Facilities with environmental interests located in this zip code:
HILLSIDE ELEM SCH (4283 S 6000 W in WEST VALLEY CITY, UT)
COMPLIANCE ACTIVITY (Tracking inspections of insecticide, fungicide, and rodenticide, and toxic substances) (National Center for Education Statistics) - STATE ID-12 130 Organizations: GRANITE SCHOOL DISTRICT (SCHOOL DISTRICT)
Alternative names: HILLSIDE ELEMENTARY SCHOOL
HUNTER JR HIGH (6131 W 3785 S in WEST VALLEY CITY, UT)
COMPLIANCE ACTIVITY (Tracking inspections of insecticide, fungicide, and rodenticide, and toxic substances) (National Center for Education Statistics) - STATE ID-12 418 Organizations: GRANITE SCHOOL DISTRICT (SCHOOL DISTRICT)
Alternative names: HUNTER JUNIOR HIGH SCHOOL
GODFREY TRUCKING INCORPORATED (6173 WEST 2100 SOUTH in WEST VALLEY, UT)
TRANSPORTER (Resource Conservation and Recovery Act (tracking hazardous waste)) Organizations: R. SCOTT GODFREY (CONTACT/OWNER)
, RICHARD M GODFREY (CONTACT/OWNER)
Alternative names: GODFREY TRUCKING SPECIALIZED DIV, RICHARD M GODFREY TRUCKING
ANIL SINGH PROPERTY #1 (6436 WEST 4100 SOUTH in SALT LAKE CITY, UT)
ENFORCEMENT/COMPLIANCE ACTIVITY (Integrated Compliance Information System)
HUNTER 29-17-35 WARD HOUSE (3745 S. 6400 WEST in WEST VALLEY CITY, UT)
COMPLIANCE ACTIVITY (Tracking inspections of insecticide, fungicide, and rodenticide, and toxic substances)
KERSEY CREEK JUNK YARD (2090 SOUTH 7200 WEST in SALT LAKE CITY, UT)
SUPERFUND (Superfund database)
Housing units lacking complete plumbing facilities: 0.1% Housing units lacking complete kitchen facilities: 0.7%
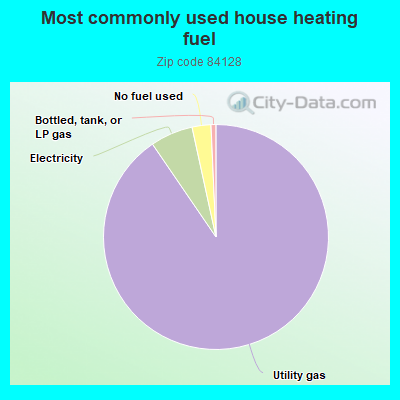
90.1%Utility gas
6.1%Electricity
2.7%No fuel used
0.7%Bottled, tank, or LP gas
Place of birth for U.S.-born residents:
This state: 19,771
Northeast: 554
Midwest: 650
South: 609
West: 4,891
52% of the 84128 zip code residents lived in the same house 5 years ago. Out of people who lived in different houses, 78% lived in this county. Out of people who lived in different counties, 50% lived in Utah.
93% of the 84128 zip code residents lived in the same house 1 year ago. Out of people who lived in different houses, 62% moved from this county. Out of people who lived in different houses, 15% moved from different county within same state. Out of people who lived in different houses, 17% moved from different state. Out of people who lived in different houses, 11% moved from abroad.
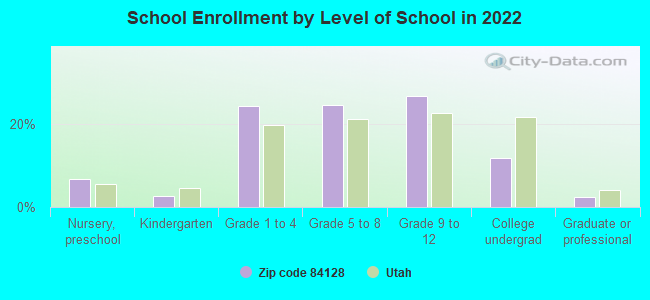
Private vs. public school enrollment:
Students in private schools in grades 1 to 8 (elementary and middle school): 123
Here:
2.4%
Utah:
7.2%
Students in private schools in grades 9 to 12 (high school): 7
Here:
0.2%
Utah:
5.3%
Students in private undergraduate colleges: 197
Here:
15.4%
Utah:
26.7%
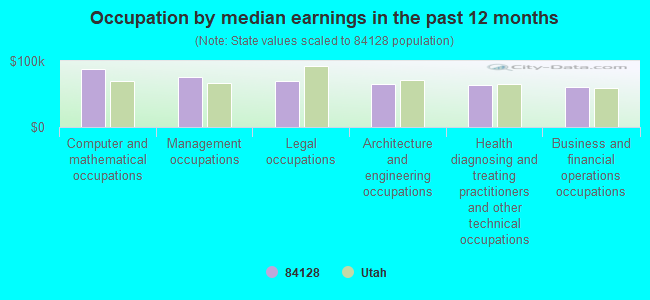
Occupation by median earnings in the past 12 months ($)
87,974Computer and mathematical occupations
76,372Management occupations
69,569Legal occupations
65,185Architecture and engineering occupations
63,945Health diagnosing and treating practitioners and other technical occupations
60,833Business and financial operations occupations
Companies with federal contracts located in this zip code:
CIRTRAN CORPORATION (4125 SOUTH 6000 WEST in SALT LAKE CITY, UT; small business)
$14,570 with Air Force for Electrical Hardware and Supplies. Signed on 2006-04-27. Completion date: 2006-09-29.
OSBORN SPECIALTY SEWING, INC (7095 W 3500 S in SALT LAKE CITY, UT; small business)
$6,207 with U.S. Special Operations Command for Taps, Dies, and Collets; Hand and Machine. Signed on 2006-05-30. Completion date: 2006-06-30.
Top industries in this zip code by the number of employees in 2005:
Accommodation and Food Services: Full-Service Restaurants (10-19: 2, 5-9: 1)
Other Services (except Public Administration): Commercial and Industrial Machinery and Equipment (except Automotive and Electronic) Repair and Maintenance (20-49: 1, 1-4: 1)
Fatal accident statistics in 2013:
Fatal accident count: 2
Vehicles involved in fatal accidents: 2
Fatal accidents caused by drunken drivers: 0
Fatalities: 2
Persons involved in fatal accidents: 2
Pedestrians involved in fatal accidents: 1
Fatal accident statistics in 2012:
Fatal accident count: 1
Vehicles involved in fatal accidents: 2
Fatal accidents caused by drunken drivers: 0
Fatalities: 2
Persons involved in fatal accidents: 5
Pedestrians involved in fatal accidents: 0
Home Mortgage Disclosure Act Aggregated Statistics For Year 2009 (Based on 6 full and 2 partial tracts)
A) FHA, FSA/RHS & VA Home Purchase Loans
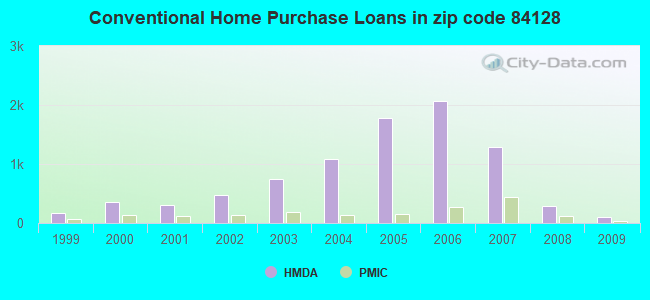
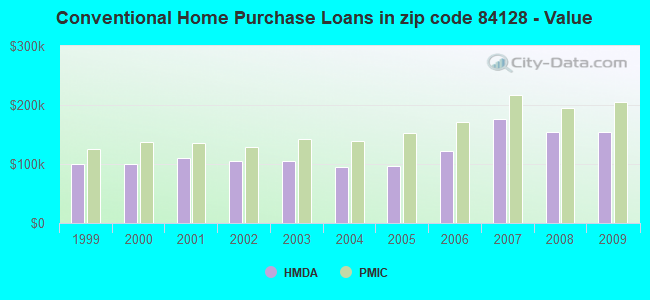
B) Conventional Home Purchase Loans
C) Refinancings
D) Home Improvement Loans
F) Non-occupant Loans on < 5 Family Dwellings (A B C & D)
G) Loans On Manufactured Home Dwelling (A B C & D)
Number
Average Value
Number
Average Value
Number
Average Value
Number
Average Value
Number
Average Value
Number
Average Value
LOANS ORIGINATED
392
$176,155
108
$154,388
1,763
$172,162
29
$50,708
50
$129,564
12
$92,388
APPLICATIONS APPROVED, NOT ACCEPTED
31
$167,806
10
$109,241
219
$185,698
6
$44,165
6
$150,378
4
$19,945
APPLICATIONS DENIED
55
$188,353
47
$135,858
548
$175,258
31
$52,864
34
$143,094
10
$22,676
APPLICATIONS WITHDRAWN
42
$181,818
14
$156,264
302
$183,057
17
$62,851
10
$130,387
4
$37,948
FILES CLOSED FOR INCOMPLETENESS
4
$164,690
2
$99,860
78
$178,155
2
$147,335
0
$0
2
$32,955
Aggregated Statistics For Year 2008 (Based on 6 full and 2 partial tracts)
A) FHA, FSA/RHS & VA Home Purchase Loans
B) Conventional Home Purchase Loans
C) Refinancings
D) Home Improvement Loans
F) Non-occupant Loans on < 5 Family Dwellings (A B C & D)
G) Loans On Manufactured Home Dwelling (A B C & D)
Number
Average Value
Number
Average Value
Number
Average Value
Number
Average Value
Number
Average Value
Number
Average Value
LOANS ORIGINATED
322
$200,545
284
$153,479
1,387
$176,173
91
$94,372
94
$153,331
50
$45,616
APPLICATIONS APPROVED, NOT ACCEPTED
15
$176,518
69
$175,834
208
$179,124
27
$108,413
18
$196,788
10
$59,089
APPLICATIONS DENIED
47
$192,830
150
$174,209
793
$185,155
175
$97,757
82
$136,540
30
$70,067
APPLICATIONS WITHDRAWN
66
$207,635
23
$195,269
361
$181,084
38
$133,566
26
$166,215
2
$34,950
FILES CLOSED FOR INCOMPLETENESS
3
$275,493
6
$179,710
54
$176,118
10
$134,236
2
$160,165
0
$0
Aggregated Statistics For Year 2007 (Based on 6 full and 2 partial tracts)
A) FHA, FSA/RHS & VA Home Purchase Loans
B) Conventional Home Purchase Loans
C) Refinancings
D) Home Improvement Loans
E) Loans on Dwellings For 5+ Families
F) Non-occupant Loans on < 5 Family Dwellings (A B C & D)
G) Loans On Manufactured Home Dwelling (A B C & D)
Number
Average Value
Number
Average Value
Number
Average Value
Number
Average Value
Number
Average Value
Number
Average Value
Number
Average Value
LOANS ORIGINATED
114
$209,485
1,296
$175,968
1,655
$155,340
177
$78,367
4
$2,902,930
232
$159,208
14
$34,631
APPLICATIONS APPROVED, NOT ACCEPTED
10
$289,795
253
$158,419
334
$162,246
31
$89,532
0
$0
41
$146,689
4
$33,952
APPLICATIONS DENIED
45
$200,772
595
$173,665
1,018
$160,027
248
$80,273
0
$0
130
$153,491
14
$30,665
APPLICATIONS WITHDRAWN
24
$216,114
158
$183,039
374
$161,167
37
$91,839
0
$0
31
$159,241
0
$0
FILES CLOSED FOR INCOMPLETENESS
0
$0
62
$182,714
103
$160,421
12
$120,767
0
$0
2
$197,110
0
$0
Aggregated Statistics For Year 2006 (Based on 6 full and 2 partial tracts)
A) FHA, FSA/RHS & VA Home Purchase Loans
B) Conventional Home Purchase Loans
C) Refinancings
D) Home Improvement Loans
F) Non-occupant Loans on < 5 Family Dwellings (A B C & D)
G) Loans On Manufactured Home Dwelling (A B C & D)
Number
Average Value
Number
Average Value
Number
Average Value
Number
Average Value
Number
Average Value
Number
Average Value
LOANS ORIGINATED
138
$168,014
2,066
$121,506
1,480
$120,612
192
$58,435
401
$113,951
4
$94,198
APPLICATIONS APPROVED, NOT ACCEPTED
8
$211,995
321
$111,436
280
$118,033
28
$54,369
59
$100,840
2
$171,155
APPLICATIONS DENIED
16
$136,967
708
$117,020
826
$127,857
206
$53,074
109
$112,122
24
$63,902
APPLICATIONS WITHDRAWN
14
$154,136
312
$104,660
417
$136,924
37
$96,277
65
$91,466
0
$0
FILES CLOSED FOR INCOMPLETENESS
4
$184,402
85
$106,943
147
$146,351
0
$0
22
$101,519
0
$0
Aggregated Statistics For Year 2005 (Based on 6 full and 2 partial tracts)
A) FHA, FSA/RHS & VA Home Purchase Loans
B) Conventional Home Purchase Loans
C) Refinancings
D) Home Improvement Loans
F) Non-occupant Loans on < 5 Family Dwellings (A B C & D)
G) Loans On Manufactured Home Dwelling (A B C & D)
Number
Average Value
Number
Average Value
Number
Average Value
Number
Average Value
Number
Average Value
Number
Average Value
LOANS ORIGINATED
228
$152,664
1,776
$95,766
1,306
$108,983
117
$52,617
321
$94,739
26
$45,363
APPLICATIONS APPROVED, NOT ACCEPTED
10
$130,221
193
$92,127
274
$104,656
15
$21,618
51
$104,972
6
$69,237
APPLICATIONS DENIED
27
$152,381
534
$91,182
923
$109,917
188
$47,983
108
$92,000
38
$56,219
APPLICATIONS WITHDRAWN
9
$141,392
345
$91,571
518
$131,263
56
$126,058
69
$84,728
10
$43,287
FILES CLOSED FOR INCOMPLETENESS
4
$172,395
78
$74,773
273
$137,679
6
$12,633
10
$56,143
0
$0
Aggregated Statistics For Year 2004 (Based on 6 full and 2 partial tracts)
A) FHA, FSA/RHS & VA Home Purchase Loans
B) Conventional Home Purchase Loans
C) Refinancings
D) Home Improvement Loans
F) Non-occupant Loans on < 5 Family Dwellings (A B C & D)
G) Loans On Manufactured Home Dwelling (A B C & D)
Number
Average Value
Number
Average Value
Number
Average Value
Number
Average Value
Number
Average Value
Number
Average Value
LOANS ORIGINATED
355
$142,792
1,087
$95,246
1,311
$114,800
74
$48,366
160
$97,501
10
$99,974
APPLICATIONS APPROVED, NOT ACCEPTED
14
$133,044
295
$101,180
345
$117,476
15
$39,732
26
$111,309
14
$58,634
APPLICATIONS DENIED
48
$134,185
377
$89,346
891
$118,155
133
$27,562
112
$81,681
36
$73,342
APPLICATIONS WITHDRAWN
26
$136,171
154
$90,173
560
$127,585
21
$55,602
28
$106,539
2
$91,870
FILES CLOSED FOR INCOMPLETENESS
2
$173,220
26
$116,569
147
$126,670
0
$0
2
$96,865
4
$115,955
Aggregated Statistics For Year 2003 (Based on 6 full and 2 partial tracts)
A) FHA, FSA/RHS & VA Home Purchase Loans
B) Conventional Home Purchase Loans
C) Refinancings
D) Home Improvement Loans
F) Non-occupant Loans on < 5 Family Dwellings (A B C & D)
Number
Average Value
Number
Average Value
Number
Average Value
Number
Average Value
Number
Average Value
LOANS ORIGINATED
580
$136,496
739
$104,717
2,898
$116,003
55
$31,946
138
$98,382
APPLICATIONS APPROVED, NOT ACCEPTED
18
$140,492
73
$114,437
401
$116,945
14
$27,891
31
$113,918
APPLICATIONS DENIED
55
$133,041
192
$98,557
816
$110,188
91
$24,636
44
$104,595
APPLICATIONS WITHDRAWN
47
$127,312
53
$112,633
569
$121,693
10
$27,138
26
$96,098
FILES CLOSED FOR INCOMPLETENESS
6
$154,922
34
$121,074
124
$124,683
2
$24,965
20
$86,132
Aggregated Statistics For Year 2002 (Based on 6 full tracts)
A) FHA, FSA/RHS & VA Home Purchase Loans
B) Conventional Home Purchase Loans
C) Refinancings
D) Home Improvement Loans
F) Non-occupant Loans on < 5 Family Dwellings (A B C & D)
Number
Average Value
Number
Average Value
Number
Average Value
Number
Average Value
Number
Average Value
LOANS ORIGINATED
562
$135,204
482
$104,240
2,137
$112,788
60
$28,973
116
$104,119
APPLICATIONS APPROVED, NOT ACCEPTED
8
$148,662
70
$92,754
265
$116,112
22
$23,905
10
$79,345
APPLICATIONS DENIED
62
$137,986
154
$87,246
598
$104,371
46
$15,198
16
$79,801
APPLICATIONS WITHDRAWN
38
$131,984
46
$107,373
472
$118,551
14
$65,201
14
$78,891
FILES CLOSED FOR INCOMPLETENESS
14
$133,083
38
$125,223
118
$115,606
0
$0
4
$59,208
Aggregated Statistics For Year 2001 (Based on 6 full tracts)
A) FHA, FSA/RHS & VA Home Purchase Loans
B) Conventional Home Purchase Loans
C) Refinancings
D) Home Improvement Loans
F) Non-occupant Loans on < 5 Family Dwellings (A B C & D)
Number
Average Value
Number
Average Value
Number
Average Value
Number
Average Value
Number
Average Value
LOANS ORIGINATED
544
$134,624
303
$110,964
1,872
$110,347
80
$20,694
66
$108,782
APPLICATIONS APPROVED, NOT ACCEPTED
20
$131,245
42
$105,350
207
$106,919
18
$18,277
8
$125,156
APPLICATIONS DENIED
58
$124,061
152
$72,948
737
$94,000
102
$14,363
18
$101,624
APPLICATIONS WITHDRAWN
26
$131,398
46
$96,380
514
$113,273
16
$39,214
16
$118,481
FILES CLOSED FOR INCOMPLETENESS
10
$132,737
8
$95,401
185
$118,297
4
$14,980
2
$155,235
Aggregated Statistics For Year 2000 (Based on 6 full tracts)
A) FHA, FSA/RHS & VA Home Purchase Loans
B) Conventional Home Purchase Loans
C) Refinancings
D) Home Improvement Loans
F) Non-occupant Loans on < 5 Family Dwellings (A B C & D)
Number
Average Value
Number
Average Value
Number
Average Value
Number
Average Value
Number
Average Value
LOANS ORIGINATED
502
$131,385
353
$100,254
520
$86,192
96
$25,256
38
$91,799
APPLICATIONS APPROVED, NOT ACCEPTED
14
$92,052
80
$81,944
102
$79,643
54
$24,198
6
$86,573
APPLICATIONS DENIED
66
$118,399
205
$77,589
458
$78,763
114
$28,257
24
$98,202
APPLICATIONS WITHDRAWN
24
$126,544
58
$106,166
275
$92,805
6
$38,602
16
$114,758
FILES CLOSED FOR INCOMPLETENESS
6
$134,145
18
$114,282
179
$106,920
2
$14,980
8
$107,285
Aggregated Statistics For Year 1999 (Based on 3 full tracts)
A) FHA, FSA/RHS & VA Home Purchase Loans
B) Conventional Home Purchase Loans
C) Refinancings
D) Home Improvement Loans
F) Non-occupant Loans on < 5 Family Dwellings (A B C & D)
2002 - 2018 National Fire Incident Reporting System (NFIRS) incidents
Based on the data from the years 2002 - 2018 the average number of fire incidents per year is 39. The highest number of fires - 68 took place in 2007, and the least - 0 in 2005. The data has a rising trend.
When looking into fire subcategories, the most incidents belonged to: Outside Fires (48.0%), and Structure Fires (31.2%).
Fire incident types reported to NFIRS in Zip Code 84128


 Nearest zip codes: 84120, 84118, 84104, 84081, 84119, 84084.


 Based on the data from the years 2002 - 2018 the average number of fire incidents per year is 39. The highest number of fires - 68 took place in 2007, and the least - 0 in 2005. The data has a rising trend.
 When looking into fire subcategories, the most incidents belonged to: Outside Fires (48.0%), and Structure Fires (31.2%).