Races in Rock, Wisconsin (WI) Detailed Stats
Ancestries, Foreign-born residents, place of birth
2.0% of Rock, WI residents are foreign-born (0.8% born in Europe, 0.8% born in Latin America, 0.2% born in Asia), which is 149.1% less than the foreign-born rate of 5.0% across the entire state of Wisconsin.
Race distribution in Rock

- 3,15594.5%White alone
- 702.1%Hispanic
- 421.3%Two or more races
- 401.2%Black alone
- 130.4%Asian alone
- 100.3%American Indian alone
- 60.2%Native Hawaiian and Other
Pacific Islander alone - 20.06%Other race alone

2000
2022
-
- 4,681,63087.3%White alone
- 300,2455.6%Black alone
- 192,9213.6%Hispanic
- 87,9951.6%Asian alone
- 51,9211.0%Two or more races
- 43,9800.8%American Indian alone
- 3,6370.07%Other race alone
- 1,3460.03%Native Hawaiian and Other
Pacific Islander alone

-
- 4,654,03179.0%White alone
- 447,0227.6%Hispanic
- 345,6785.9%Black alone
- 217,5323.7%Two or more races
- 172,2422.9%Asian alone
- 33,7620.6%American Indian alone
- 19,6800.3%Other race alone
- 2,5920.04%Native Hawaiian and Other
Pacific Islander alone

Income and house value in Rock
- Median household income in 2022
- $68,945White non-Hispanic householders
- $81,520Some other race householders
- $76,312Two or more races householders
- $74,371Hispanic or Latino race householders
- Median 2022 house value
- $243,424White Non-Hispanic householders
- $181,500Some other race householders
- $181,500Hispanic or Latino householders
Household income for White non-Hispanic householders

Household income for Two or more races householders

Household income for Hispanic or Latino race householders

Foreign-born residents in Rock
67 residents are foreign born (0.8% Europe, 0.8% Latin America, 0.2% Asia).
| This city: | 2.0% |
| Wisconsin: | 3.6% |
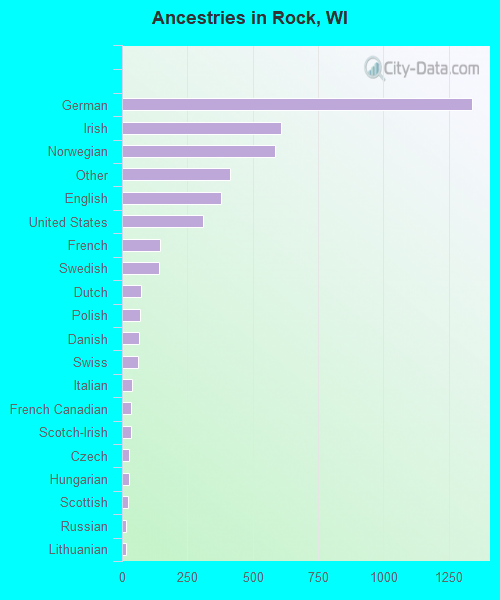
Ancestries in Rock

- 1,33830.3%German
- 60813.8%Irish
- 58613.3%Norwegian
- 4149.4%Other
- 3808.6%English
- 3107.0%United States
- 1463.3%French
- 1433.2%Swedish
- 731.7%Dutch
- 691.6%Polish
- 651.5%Danish
- 601.4%Swiss
- 400.9%Italian
- 350.8%French Canadian
- 350.8%Scotch-Irish
- 280.6%Czech
- 250.6%Hungarian
- 220.5%Scottish
- 170.4%Russian
- 150.3%Lithuanian
- 110.2%Welsh
Zip codes: 54449.