Races in Omaha, Nebraska (NE) Detailed Stats
Data:
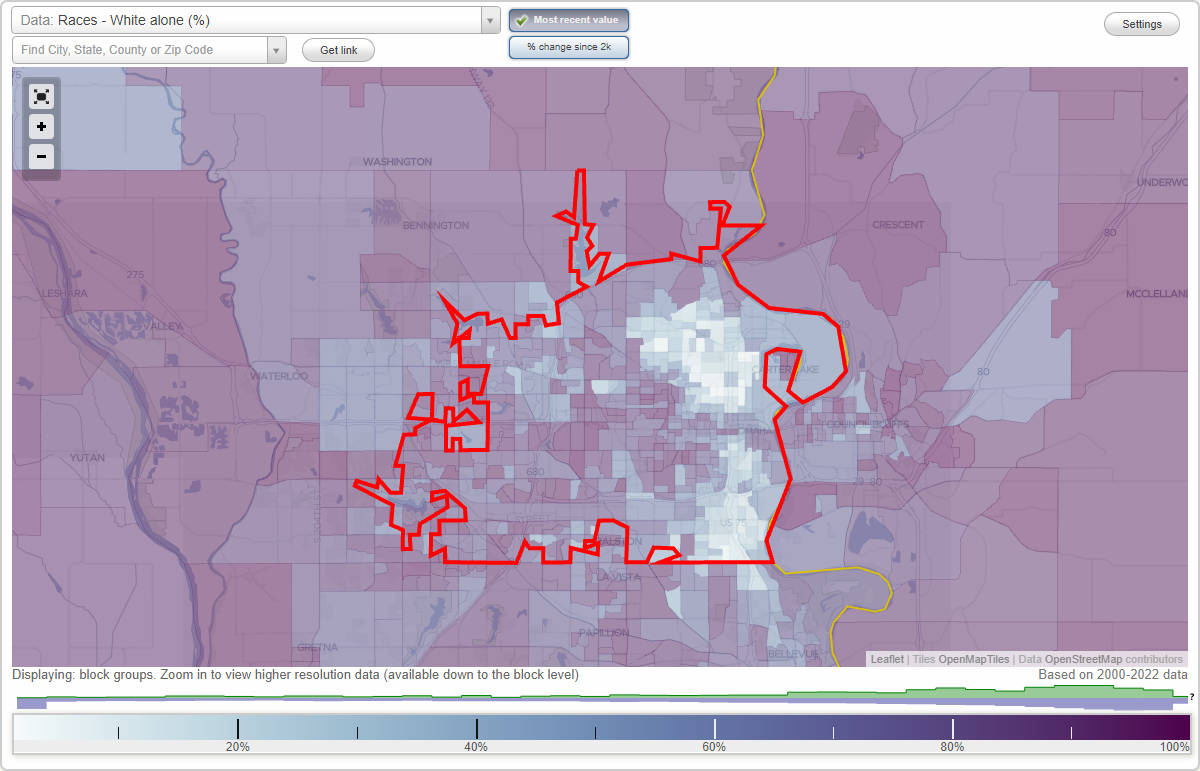
Races - White alone (%)
Races - White alone (% change since 2000)
Races - Black alone (%)
Races - Black alone (% change since 2000)
Races - American Indian alone (%)
Races - American Indian alone (% change since 2000)
Races - Asian alone (%)
Races - Asian alone (% change since 2000)
Races - Hispanic (%)
Races - Hispanic (% change since 2000)
Races - Native Hawaiian and Other Pacific Islander alone (%)
Races - Native Hawaiian and Other Pacific Islander alone (% change since 2000)
Races - Two or more races(%)
Races - Two or more races(% change since 2000)
Races - Other race alone (%)
Races - Other race alone (% change since 2000)
Racial diversity
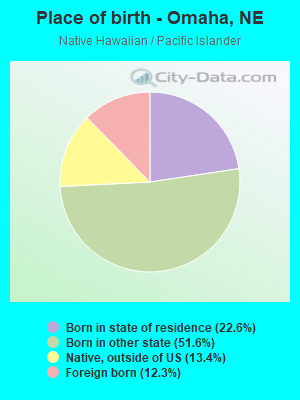
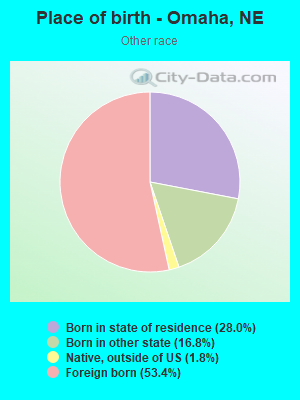
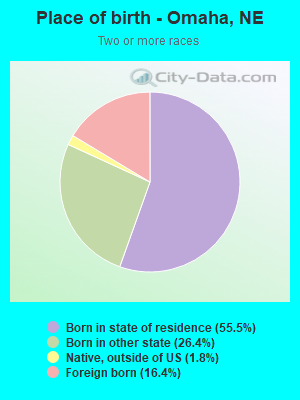
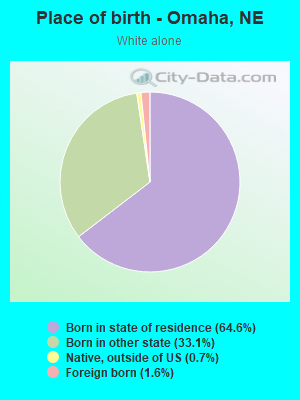
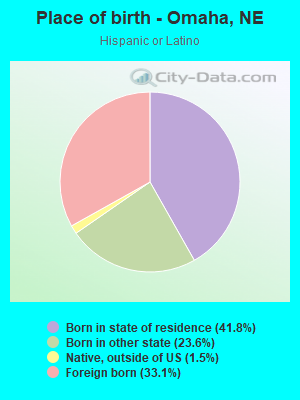
Place of birth - Born in state of residence (%)
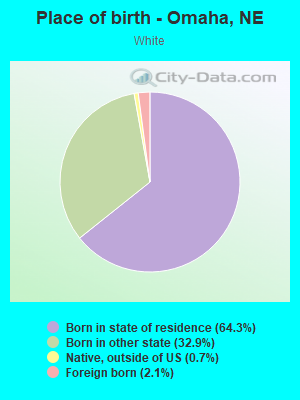
Place of birth - Born in state of residence (%) - White
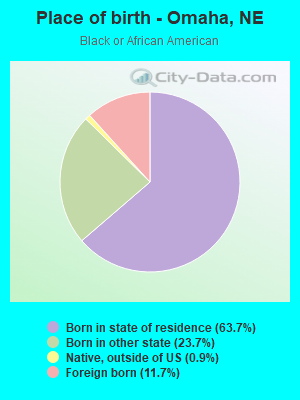
Place of birth - Born in state of residence (%) - Black or African American
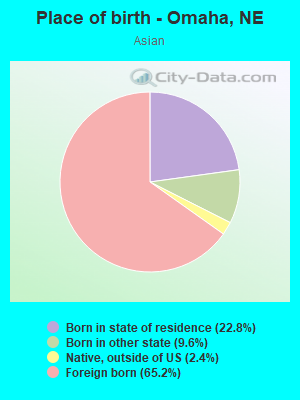
Place of birth - Born in state of residence (%) - Asian
Place of birth - Born in state of residence (%) - Hispanic or Latino
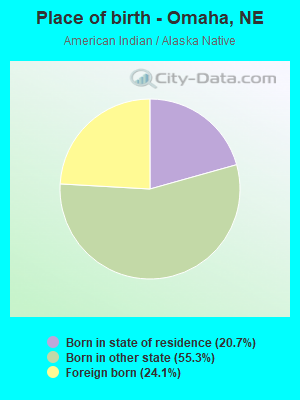
Place of birth - Born in state of residence (%) - American Indian and Alaska Native
Place of birth - Born in state of residence (%) - Multirace
Place of birth - Born in state of residence (%) - Other Race
Place of birth - Born in other state (%)
Place of birth - Born in other state (%) - White
Place of birth - Born in other state (%) - Black or African American
Place of birth - Born in other state (%) - Asian
Place of birth - Born in other state (%) - Hispanic or Latino
Place of birth - Born in other state (%) - American Indian and Alaska Native
Place of birth - Born in other state (%) - Multirace
Place of birth - Born in other state (%) - Other Race
Place of birth - Native, outside of US (%)
Place of birth - Native, outside of US (%) - White
Place of birth - Native, outside of US (%) - Black or African American
Place of birth - Native, outside of US (%) - Asian
Place of birth - Native, outside of US (%) - Hispanic or Latino
Place of birth - Native, outside of US (%) - American Indian and Alaska Native
Place of birth - Native, outside of US (%) - Multirace
Place of birth - Native, outside of US (%) - Other Race
Place of birth - Foreign born (%)
Place of birth - Foreign born (%) - White
Place of birth - Foreign born (%) - Black or African American
Place of birth - Foreign born (%) - Asian
Place of birth - Foreign born (%) - Hispanic or Latino
Place of birth - Foreign born (%) - American Indian and Alaska Native
Place of birth - Foreign born (%) - Multirace
Place of birth - Foreign born (%) - Other Race
Residents speaking English at home (%)
Residents speaking English at home - Born in the United States (%)
Residents speaking English at home - Native, born elsewhere (%)
Residents speaking English at home - Foreign born (%)
Residents speaking Spanish at home (%)
Residents speaking Spanish at home - Born in the United States (%)
Residents speaking Spanish at home - Native, born elsewhere (%)
Residents speaking Spanish at home - Foreign born (%)
Residents speaking other language at home (%)
Residents speaking other language at home - Born in the United States (%)
Residents speaking other language at home - Native, born elsewhere (%)
Residents speaking other language at home - Foreign born (%)
Marital status - Never married (%)
Marital status - Now married (%)
Marital status - Separated (%)
Marital status - Widowed (%)
Marital status - Divorced (%)
Ancestries Reported - Arab (%)
Ancestries Reported - Czech (%)
Ancestries Reported - Danish (%)
Ancestries Reported - Dutch (%)
Ancestries Reported - English (%)
Ancestries Reported - French (%)
Ancestries Reported - French Canadian (%)
Ancestries Reported - German (%)
Ancestries Reported - Greek (%)
Ancestries Reported - Hungarian (%)
Ancestries Reported - Irish (%)
Ancestries Reported - Italian (%)
Ancestries Reported - Lithuanian (%)
Ancestries Reported - Norwegian (%)
Ancestries Reported - Polish (%)
Ancestries Reported - Portuguese (%)
Ancestries Reported - Russian (%)
Ancestries Reported - Scotch-Irish (%)
Ancestries Reported - Scottish (%)
Ancestries Reported - Slovak (%)
Ancestries Reported - Subsaharan African (%)
Ancestries Reported - Swedish (%)
Ancestries Reported - Swiss (%)
Ancestries Reported - Ukrainian (%)
Ancestries Reported - United States (%)
Ancestries Reported - Welsh (%)
Ancestries Reported - West Indian (%)
Ancestries Reported - Other (%)
Geographical mobility - Same house 1 year ago (%)
Geographical mobility - Same house 1 year ago (%) - White
Geographical mobility - Same house 1 year ago (%) - Black or African American
Geographical mobility - Same house 1 year ago (%) - Asian
Geographical mobility - Same house 1 year ago (%) - Hispanic or Latino
Geographical mobility - Same house 1 year ago (%) - American Indian and Alaska Native
Geographical mobility - Same house 1 year ago (%) - Multirace
Geographical mobility - Same house 1 year ago (%) - Other Race
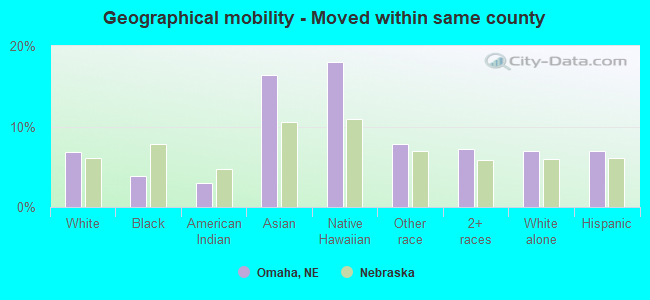
Geographical mobility - Moved within same county (%)
Geographical mobility - Moved within same county (%) - White
Geographical mobility - Moved within same county (%) - Black or African American
Geographical mobility - Moved within same county (%) - Asian
Geographical mobility - Moved within same county (%) - Hispanic or Latino
Geographical mobility - Moved within same county (%) - American Indian and Alaska Native
Geographical mobility - Moved within same county (%) - Multirace
Geographical mobility - Moved within same county (%) - Other Race
Geographical mobility - Moved from different county within same state (%)
Geographical mobility - Moved from different county within same state (%) - White
Geographical mobility - Moved from different county within same state (%) - Black or African American
Geographical mobility - Moved from different county within same state (%) - Asian
Geographical mobility - Moved from different county within same state (%) - Hispanic or Latino
Geographical mobility - Moved from different county within same state (%) - American Indian and Alaska Native
Geographical mobility - Moved from different county within same state (%) - Multirace
Geographical mobility - Moved from different county within same state (%) - Other Race
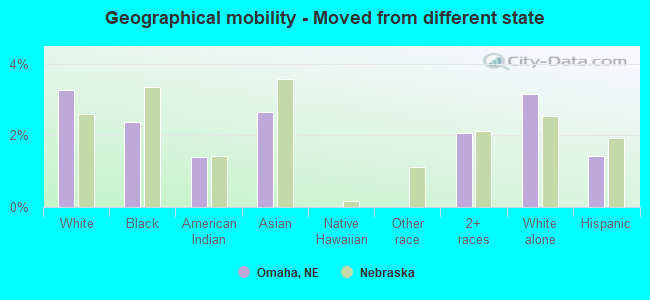
Geographical mobility - Moved from different state (%)
Geographical mobility - Moved from different state (%) - White
Geographical mobility - Moved from different state (%) - Black or African American
Geographical mobility - Moved from different state (%) - Asian
Geographical mobility - Moved from different state (%) - Hispanic or Latino
Geographical mobility - Moved from different state (%) - American Indian and Alaska Native
Geographical mobility - Moved from different state (%) - Multirace
Geographical mobility - Moved from different state (%) - Other Race
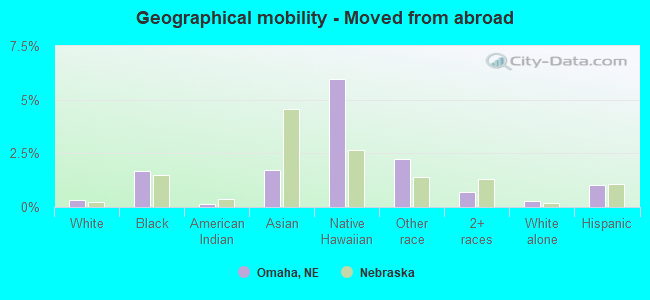
Geographical mobility - Moved from abroad (%)
Geographical mobility - Moved from abroad (%) - White
Geographical mobility - Moved from abroad (%) - Black or African American
Geographical mobility - Moved from abroad (%) - Asian
Geographical mobility - Moved from abroad (%) - Hispanic or Latino
Geographical mobility - Moved from abroad (%) - American Indian and Alaska Native
Geographical mobility - Moved from abroad (%) - Multirace
Geographical mobility - Moved from abroad (%) - Other Race
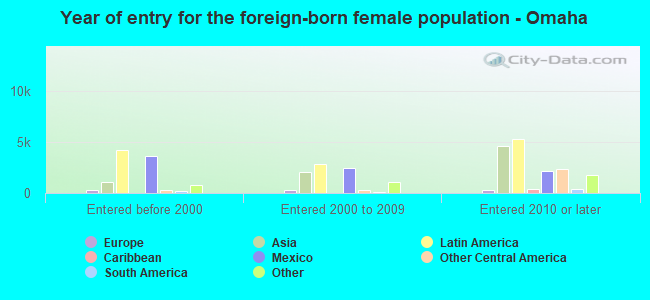
Place of birth for the foreign-born population - Ireland (%)
Place of birth for the foreign-born population - Denmark (%)
Place of birth for the foreign-born population - Norway (%)
Place of birth for the foreign-born population - Sweden (%)
Place of birth for the foreign-born population - United Kingdom (%)
Place of birth for the foreign-born population - England (%)
Place of birth for the foreign-born population - Scotland (%)
Place of birth for the foreign-born population - Other Northern Europe (%)
Place of birth for the foreign-born population - Austria (%)
Place of birth for the foreign-born population - Belgium (%)
Place of birth for the foreign-born population - France (%)
Place of birth for the foreign-born population - Germany (%)
Place of birth for the foreign-born population - Netherlands (%)
Place of birth for the foreign-born population - Switzerland (%)
Place of birth for the foreign-born population - Other Western Europe (%)
Place of birth for the foreign-born population - Greece (%)
Place of birth for the foreign-born population - Italy (%)
Place of birth for the foreign-born population - Portugal (%)
Place of birth for the foreign-born population - Spain (%)
Place of birth for the foreign-born population - Other Southern Europe (%)
Place of birth for the foreign-born population - Albania (%)
Place of birth for the foreign-born population - Belarus (%)
Place of birth for the foreign-born population - Bosnia and Herzegovina (%)
Place of birth for the foreign-born population - Bulgaria (%)
Place of birth for the foreign-born population - Croatia (%)
Place of birth for the foreign-born population - Czechoslovakia (%)
Place of birth for the foreign-born population - Hungary (%)
Place of birth for the foreign-born population - Latvia (%)
Place of birth for the foreign-born population - Lithuania (%)
Place of birth for the foreign-born population - North Macedonia (Macedonia) (%)
Place of birth for the foreign-born population - Moldova (%)
Place of birth for the foreign-born population - Poland (%)
Place of birth for the foreign-born population - Romania (%)
Place of birth for the foreign-born population - Russia (%)
Place of birth for the foreign-born population - Serbia (%)
Place of birth for the foreign-born population - Ukraine (%)
Place of birth for the foreign-born population - Other Eastern Europe (%)
Place of birth for the foreign-born population - China (%)
Place of birth for the foreign-born population - Hong Kong (%)
Place of birth for the foreign-born population - Taiwan (%)
Place of birth for the foreign-born population - Japan (%)
Place of birth for the foreign-born population - Korea (%)
Place of birth for the foreign-born population - Other Eastern Asia (%)
Place of birth for the foreign-born population - Afghanistan (%)
Place of birth for the foreign-born population - Bangladesh (%)
Place of birth for the foreign-born population - India (%)
Place of birth for the foreign-born population - Iran (%)
Place of birth for the foreign-born population - Kazakhstan (%)
Place of birth for the foreign-born population - Nepal (%)
Place of birth for the foreign-born population - Pakistan (%)
Place of birth for the foreign-born population - Sri Lanka (%)
Place of birth for the foreign-born population - Uzbekistan (%)
Place of birth for the foreign-born population - Other South Central Asia (%)
Place of birth for the foreign-born population - Burma (%)
Place of birth for the foreign-born population - Cambodia (%)
Place of birth for the foreign-born population - Indonesia (%)
Place of birth for the foreign-born population - Laos (%)
Place of birth for the foreign-born population - Malaysia (%)
Place of birth for the foreign-born population - Philippines (%)
Place of birth for the foreign-born population - Singapore (%)
Place of birth for the foreign-born population - Thailand (%)
Place of birth for the foreign-born population - Vietnam (%)
Place of birth for the foreign-born population - Other South Eastern Asia (%)
Place of birth for the foreign-born population - Armenia (%)
Place of birth for the foreign-born population - Iraq (%)
Place of birth for the foreign-born population - Israel (%)
Place of birth for the foreign-born population - Jordan (%)
Place of birth for the foreign-born population - Kuwait (%)
Place of birth for the foreign-born population - Lebanon (%)
Place of birth for the foreign-born population - Saudi Arabia (%)
Place of birth for the foreign-born population - Syria (%)
Place of birth for the foreign-born population - Turkey (%)
Place of birth for the foreign-born population - Yemen (%)
Place of birth for the foreign-born population - Other Western Asia (%)
Place of birth for the foreign-born population - Eritrea (%)
Place of birth for the foreign-born population - Ethiopia (%)
Place of birth for the foreign-born population - Kenya (%)
Place of birth for the foreign-born population - Somalia (%)
Place of birth for the foreign-born population - Uganda (%)
Place of birth for the foreign-born population - Zimbabwe (%)
Place of birth for the foreign-born population - Other Eastern Africa (%)
Place of birth for the foreign-born population - Cameroon (%)
Place of birth for the foreign-born population - Congo (%)
Place of birth for the foreign-born population - Democratic Republic of Congo (Zaire) (%)
Place of birth for the foreign-born population - Other Middle Africa (%)
Place of birth for the foreign-born population - Egypt (%)
Place of birth for the foreign-born population - Morocco (%)
Place of birth for the foreign-born population - Sudan (%)
Place of birth for the foreign-born population - Other Northern Africa (%)
Place of birth for the foreign-born population - South Africa (%)
Place of birth for the foreign-born population - Other Southern Africa (%)
Place of birth for the foreign-born population - Cabo Verde (%)
Place of birth for the foreign-born population - Ghana (%)
Place of birth for the foreign-born population - Liberia (%)
Place of birth for the foreign-born population - Nigeria (%)
Place of birth for the foreign-born population - Senegal (%)
Place of birth for the foreign-born population - Sierra Leone (%)
Place of birth for the foreign-born population - Other Western Africa (%)
Place of birth for the foreign-born population - Australia (%)
Place of birth for the foreign-born population - New Zealand (%)
Place of birth for the foreign-born population - Fiji (%)
Place of birth for the foreign-born population - Micronesia (%)
Place of birth for the foreign-born population - Bahamas (%)
Place of birth for the foreign-born population - Barbados (%)
Place of birth for the foreign-born population - Cuba (%)
Place of birth for the foreign-born population - Dominica (%)
Place of birth for the foreign-born population - Dominican Republic (%)
Place of birth for the foreign-born population - Grenada (%)
Place of birth for the foreign-born population - Haiti (%)
Place of birth for the foreign-born population - Jamaica (%)
Place of birth for the foreign-born population - St. Vincent and the Grenadines (%)
Place of birth for the foreign-born population - Trinidad and Tobago (%)
Place of birth for the foreign-born population - West Indies (%)
Place of birth for the foreign-born population - Other Caribbean (%)
Place of birth for the foreign-born population - Belize (%)
Place of birth for the foreign-born population - Costa Rica (%)
Place of birth for the foreign-born population - El Salvador (%)
Place of birth for the foreign-born population - Guatemala (%)
Place of birth for the foreign-born population - Honduras (%)
Place of birth for the foreign-born population - Mexico (%)
Place of birth for the foreign-born population - Nicaragua (%)
Place of birth for the foreign-born population - Panama (%)
Place of birth for the foreign-born population - Other Central America (%)
Place of birth for the foreign-born population - Argentina (%)
Place of birth for the foreign-born population - Bolivia (%)
Place of birth for the foreign-born population - Brazil (%)
Place of birth for the foreign-born population - Chile (%)
Place of birth for the foreign-born population - Colombia (%)
Place of birth for the foreign-born population - Ecuador (%)
Place of birth for the foreign-born population - Guyana (%)
Place of birth for the foreign-born population - Peru (%)
Place of birth for the foreign-born population - Uruguay (%)
Place of birth for the foreign-born population - Venezuela (%)
Place of birth for the foreign-born population - Other South America (%)
Place of birth for the foreign-born population - Canada (%)
Place of birth for the foreign-born population - Other Northern America (%)
Place of birth for the foreign-born population - Other (%)
Latest news about races in Omaha, NE collected exclusively by city-data.com from local newspapers, TV, and radio stations
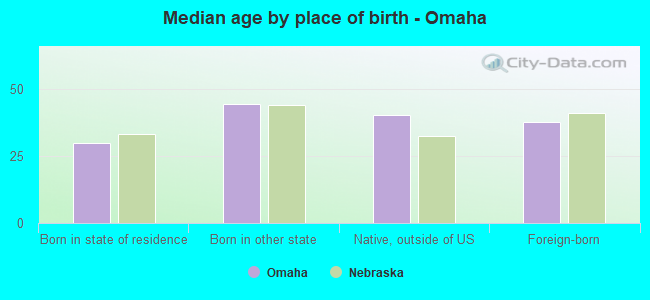
According to 2022 data, the most numerous races in Omaha, NE are White alone (310,005 residents), Hispanic (75,546 residents), and Black alone (54,563 residents). 83.4% of Omaha residents speak English at home. 10.9% of Omaha, NE residents are foreign-born (5.0% born in Latin America, 3.3% born in Asia, 1.5% born in Africa), which is 35.6% greater than the foreign-born rate of 7.0% across the entire state of Nebraska.
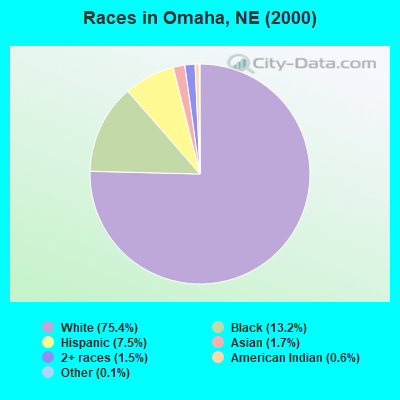
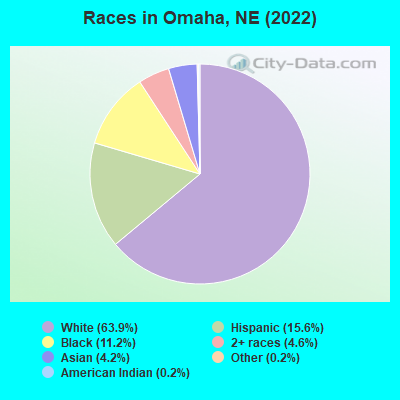
Race distribution in Omaha
2000 2022
293,876 75.4% White alone 51,427 13.2% Black alone 29,397 7.5% Hispanic 6,685 1.7% Asian alone 5,744 1.5% Two or more races 2,238 0.6% American Indian alone 448 0.1% Other race alone 192 0.05% Native Hawaiian and Other
310,005 63.9% White alone 75,546 15.6% Hispanic 54,563 11.2% Black alone 22,495 4.6% Two or more races 20,221 4.2% Asian alone 947 0.2% American Indian alone 971 0.2% Other race alone 398 0.08% Native Hawaiian and Other
2000 2022
1,494,494 87.3% White alone 94,425 5.5% Hispanic 67,537 3.9% Black alone 21,677 1.3% Asian alone 17,696 1.0% Two or more races 13,460 0.8% American Indian alone 1,327 0.08% Other race alone 647 0.04% Native Hawaiian and Other
1,492,005 75.8% White alone 241,898 12.3% Hispanic 89,520 4.5% Black alone 76,499 3.9% Two or more races 49,261 2.5% Asian alone 10,249 0.5% American Indian alone 7,425 0.4% Other race alone 1,066 0.05% Native Hawaiian and Other
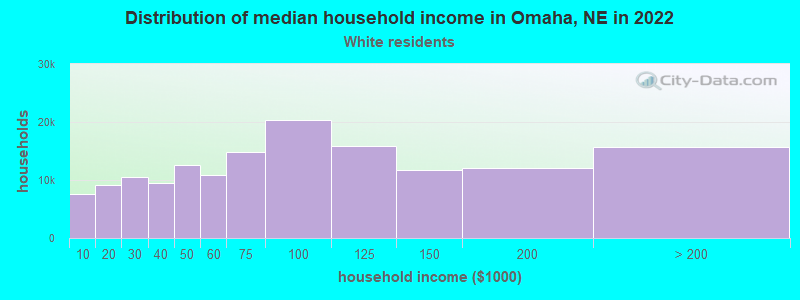
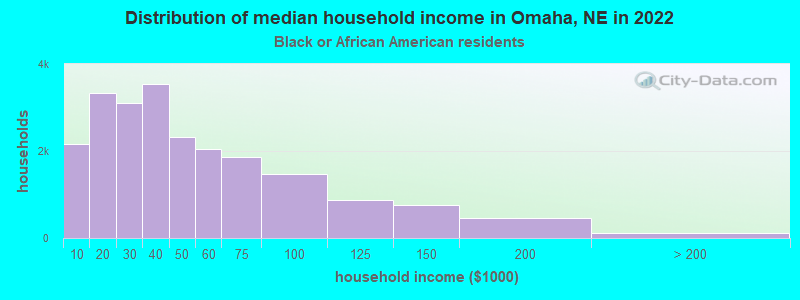
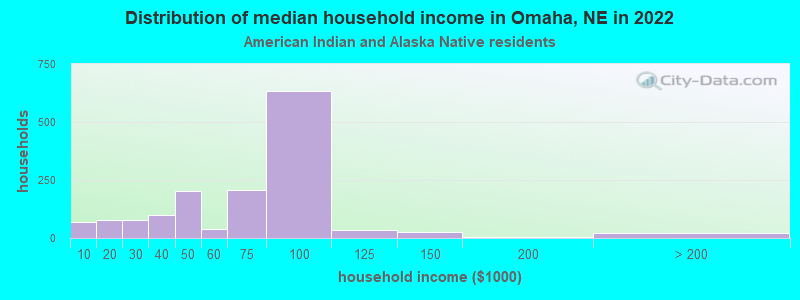
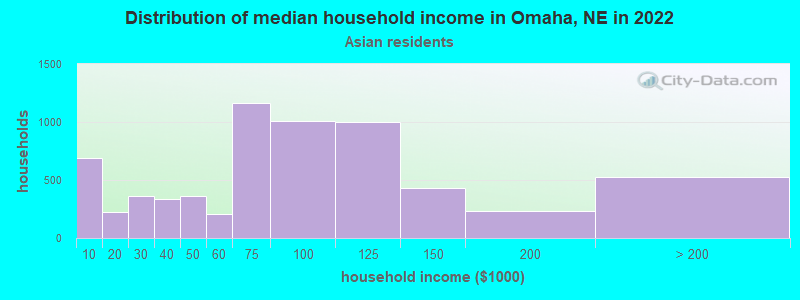
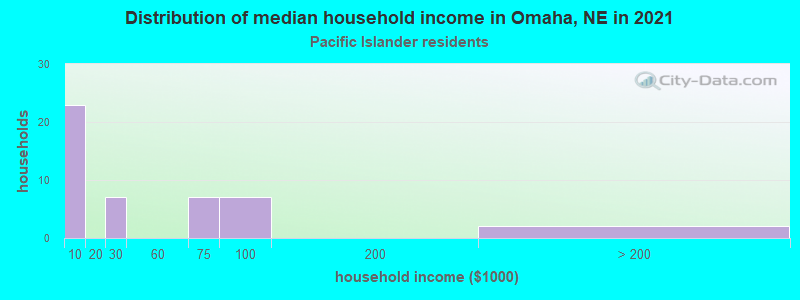
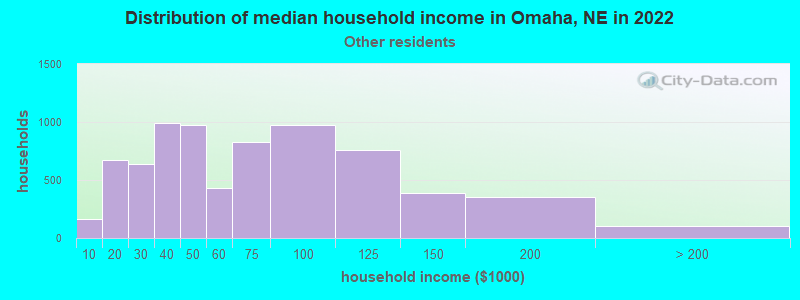
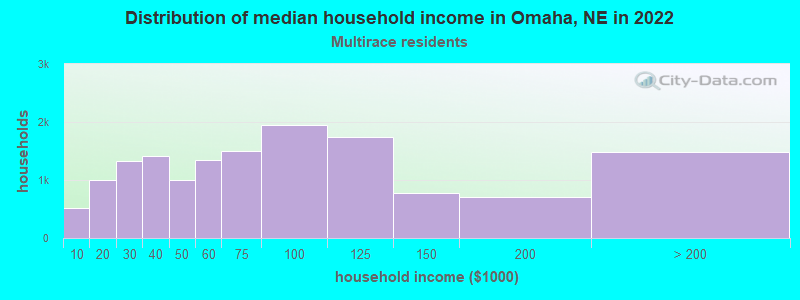
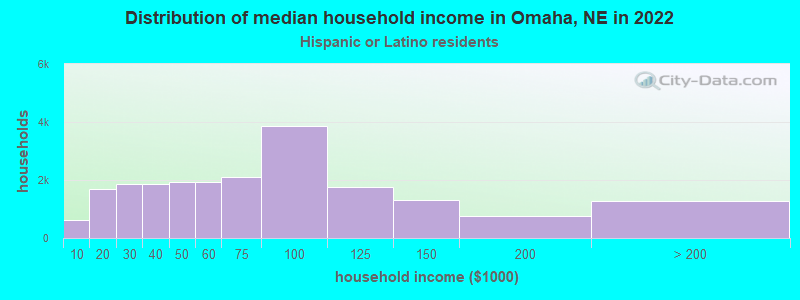
Income and house value in Omaha Median household income in 2022 $76,086 White non-Hispanic householders$37,465 Black householders$79,407 American Indian and Alaska Native householders$73,849 Asian householders$109,183 Native Hawaiian and other Pacific Islander householders$52,066 Some other race householders$67,297 Two or more races householders$63,996 Hispanic or Latino race householdersMedian 2022 house value $256,342 White Non-Hispanic householders$141,106 Black or African American householders$143,196 American Indian or Alaska Native householders $293,971 Asian householders$169,849 Native Hawaiian and other Pacific Islander householders$163,317 Some other race householders$207,216 Two or more races householders$170,372 Hispanic or Latino householders
Median age by race in Omaha
39.7 Median age for White residents38.5 40.7 32.0 Median age for Black or African American residents30.0 33.3 26.7 Median age for American Indian / Alaska Native residents24.0 31.8 30.9 Median age for Asian residents30.6 31.2 24.2 Median age for Native Hawaiian / Pacific Islander residents44.6 23.6 27.4 Median age for Other race residents28.6 26.8 22.4 Median age for Two or more races residents23.2 20.9 40.5 Median age for White alone residents39.2 41.7 23.4 Median age for Hispanic or Latino residents23.2 23.6
Owner/renter occupied households by race in Omaha
House owners and renters - White residents 96,556 64.1% Owner occupied54,131 35.9% Renter occupiedHouse owners and renters - Black or African American residents 5,908 26.8% Owner occupied16,139 73.2% Renter occupiedHouse owners and renters - American Indian / Alaska Native residents 927 51.4% Owner occupied878 48.6% Renter occupiedHouse owners and renters - Asian residents 2,554 39.0% Owner occupied3,987 61.0% Renter occupiedHouse owners and renters - Native Hawaiian / Pacific Islander residents 24 39.5% Owner occupied37 60.5% Renter occupiedHouse owners and renters - Other race residents 2,564 35.3% Owner occupied4,704 64.7% Renter occupiedHouse owners and renters - Two or more races residents 6,363 43.2% Owner occupied8,383 56.8% Renter occupiedHouse owners and renters - White alone residents 94,741 64.6% Owner occupied51,924 35.4% Renter occupiedHouse owners and renters - Hispanic or Latino residents 8,528 40.7% Owner occupied12,442 59.3% Renter occupied
Language usage in Omaha
English speakers - Total 83.4% of residents of Omaha speak English at home.
10.2% of residents speak Spanish at home 25,041 54.1% Speak English very well21,224 45.9% Speak English less than very well6.4% of residents speak other language at home 17,538 60.8% Speak English very well11,308 39.2% Speak English less than very well
English speakers - Born in the United States 91.5% of residents of Omaha speak English at home.
6.5% of residents speak Spanish at home 7,969 87.3% Speak English very well1,157 12.7% Speak English less than very well2.0% of residents speak other language at home 2,539 91.0% Speak English very well250 9.0% Speak English less than very well
English speakers - Native, born elsewhere 72.1% of residents of Omaha speak English at home.
17.4% of residents speak Spanish at home 665 80.8% Speak English very well158 19.2% Speak English less than very well10.5% of residents speak other language at home 401 80.5% Speak English very well97 19.5% Speak English less than very well
English speakers - Foreign-born 11.4% of residents of Omaha speak English at home.
45.9% of residents speak Spanish at home 5,165 22.6% Speak English very well17,674 77.4% Speak English less than very well42.7% of residents speak other language at home 11,302 53.2% Speak English very well9,955 46.8% Speak English less than very well
White (Caucasian) - Speak only English Native:
97.0% (289,491)Foreign-born:
29.8% (2,013)
White (Caucasian) - Speak another language Native:
3.0% (8,839)Foreign-born:
70.2% (4,739)
Black or African American - Speak only English Native:
94.4% (42,259)Foreign-born:
14.9% (971)
Black or African American - Speak another language Native:
5.6% (2,505)Foreign-born:
85.1% (5,526)
American Indian / Alaska Native - Speak only English Native:
69.7% (1,629)Foreign-born:
4.6% (63)
American Indian / Alaska Native - Speak another language Native:
33.5% (782)Foreign-born:
100.0% (1,374)
Asian - Speak only English Native:
55.4% (3,042)Foreign-born:
12.1% (1,595)
Asian - Speak another language Native:
44.6% (2,451)Foreign-born:
87.9% (11,580)
Native Hawaiian / Pacific Islander - Speak another language Native:
8.6% (14)Foreign-born:
100.0% (24)
Other race - Speak only English Native:
21.8% (2,144)Foreign-born:
3.4% (439)
Other race - Speak another language Native:
78.2% (7,675)Foreign-born:
96.6% (12,466)
Two or more races - Speak only English Native:
78.8% (31,840)Foreign-born:
6.9% (647)
Two or more races - Speak another language Native:
21.2% (8,586)Foreign-born:
93.1% (8,717)
White alone - Speak only English Native:
98.5% (284,816)Foreign-born:
39.7% (1,975)
White alone - Speak another language Native:
1.5% (4,275)Foreign-born:
60.3% (2,999)
Hispanic or Latino - Speak only English Native:
49.5% (20,953)Foreign-born:
4.3% (1,062)
Hispanic or Latino - Speak another language Native:
50.5% (21,403)Foreign-born:
95.7% (23,521)
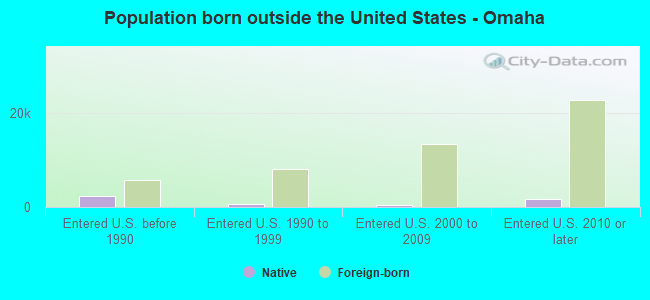
Foreign-born residents in Omaha 53,539 residents are foreign born (5.0% Latin America , 3.3% Asia , 1.5% Africa ).
This city:
10.9%Nebraska:
7.5%
Marital status for residents in Omaha Marital status - White (Caucasian) population 15 years and over
Males 37.1% Never married47.9% Now married0.6% Separated2.3% Widowed12.1% DivorcedFemales 30.6% Never married47.1% Now married1.1% Separated7.5% Widowed13.6% DivorcedWomen who gave birth in the past 12 months Now married:
81.4% (2,842)Unmarried:
18.6% (649)
Women who did not give birth in the past 12 months Now married:
43.1% (31,895)Unmarried:
56.9% (42,058)
Marital status - Black or African American population 15 years and over
Males 54.3% Never married30.8% Now married2.7% Separated1.3% Widowed10.8% DivorcedFemales 56.1% Never married22.7% Now married3.4% Separated6.6% Widowed11.2% DivorcedWomen who gave birth in the past 12 months Now married:
15.2% (155)Unmarried:
84.8% (866)
Women who did not give birth in the past 12 months Now married:
21.9% (2,941)Unmarried:
78.1% (10,488)
Marital status - American Indian / Alaska Native population 15 years and over
Males 61.1% Never married33.3% Now married0.9% Separated0.2% Widowed4.5% DivorcedFemales 44.9% Never married36.2% Now married1.6% Separated4.5% Widowed12.8% DivorcedWomen who gave birth in the past 12 months Now married:
25.0% (3)Unmarried:
75.0% (10)
Women who did not give birth in the past 12 months Now married:
33.6% (256)Unmarried:
66.4% (507)
Marital status - Asian population 15 years and over
Males 41.2% Never married54.9% Now married2.0% Separated0.0% Widowed1.9% DivorcedFemales 33.4% Never married59.3% Now married2.7% Separated4.4% Widowed0.3% DivorcedWomen who gave birth in the past 12 months Now married:
100.0% (641)Unmarried:
0.0% (0)
Women who did not give birth in the past 12 months Now married:
54.7% (3,289)Unmarried:
45.3% (2,719)
Marital status - Native Hawaiian / Pacific Islander population 15 years and over
Males 70.0% Never married0.0% Now married0.0% Separated0.0% Widowed30.0% DivorcedFemales 42.9% Never married48.4% Now married0.0% Separated0.0% Widowed8.8% DivorcedWomen who did not give birth in the past 12 months Now married:
48.4% (46)Unmarried:
51.6% (49)
Marital status - Other race population 15 years and over
Males 42.1% Never married46.5% Now married4.5% Separated0.4% Widowed6.4% DivorcedFemales 40.3% Never married46.6% Now married5.9% Separated3.1% Widowed4.1% DivorcedWomen who gave birth in the past 12 months Now married:
75.6% (99)Unmarried:
24.4% (32)
Women who did not give birth in the past 12 months Now married:
50.7% (3,550)Unmarried:
49.3% (3,456)
Marital status - Two or more races population 15 years and over
Males 51.8% Never married39.9% Now married3.5% Separated0.2% Widowed4.6% DivorcedFemales 53.2% Never married35.0% Now married2.6% Separated1.0% Widowed8.2% DivorcedWomen who gave birth in the past 12 months Now married:
42.7% (795)Unmarried:
57.3% (1,065)
Women who did not give birth in the past 12 months Now married:
28.3% (3,381)Unmarried:
71.7% (8,566)
Marital status - White alone, not Hispanic / Latino population 15 years and over
Males 36.8% Never married48.1% Now married0.6% Separated2.4% Widowed12.2% DivorcedFemales 30.3% Never married47.0% Now married1.2% Separated7.7% Widowed13.8% DivorcedWomen who gave birth in the past 12 months Now married:
78.1% (2,204)Unmarried:
21.9% (619)
Women who did not give birth in the past 12 months Now married:
43.3% (30,733)Unmarried:
56.7% (40,318)
Marital status - Hispanic or Latino population 15 years and over
Males 48.8% Never married43.5% Now married2.6% Separated0.2% Widowed5.0% DivorcedFemales 44.6% Never married41.8% Now married4.0% Separated2.0% Widowed7.6% DivorcedWomen who gave birth in the past 12 months Now married:
71.5% (1,315)Unmarried:
28.5% (525)
Women who did not give birth in the past 12 months Now married:
38.4% (6,871)Unmarried:
61.6% (11,043)
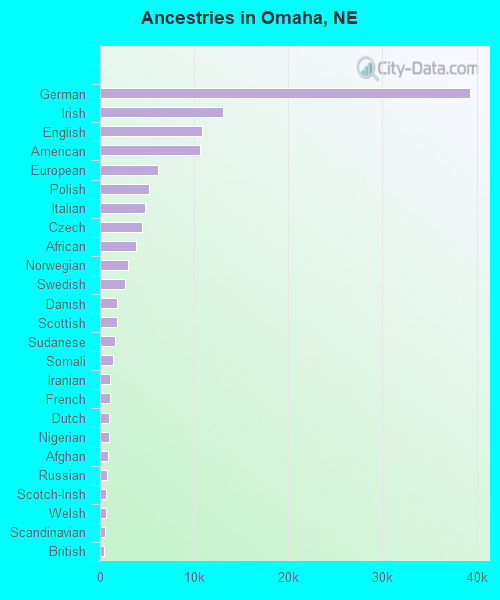
Ancestries in Omaha
39,346 16.8% German13,061 5.6% Irish10,838 4.6% English10,602 4.5% American6,173 2.6% European5,152 2.2% Polish4,737 2.0% Italian4,449 1.9% Czech3,781 1.6% African2,996 1.3% Norwegian2,686 1.1% Swedish1,835 0.8% Danish1,764 0.8% Scottish1,607 0.7% Sudanese1,376 0.6% Somali1,093 0.5% Iranian1,081 0.5% French998 0.4% Dutch903 0.4% Nigerian864 0.4% Afghan727 0.3% Russian686 0.3% Scotch-Irish678 0.3% Welsh571 0.2% Scandinavian453 0.2% British442 0.2% German Russian421 0.2% Eastern European381 0.2% Lithuanian360 0.2% Hungarian326 0.1% Czechoslovakian289 0.1% Arab285 0.1% Ukrainian284 0.1% French Canadian282 0.1% Canadian272 0.1% Northern European227 0.10% Lebanese223 0.10% Swiss212 0.09% Greek193 0.08% Icelander174 0.07% Egyptian157 0.07% Jamaican155 0.07% Croatian141 0.06% Kenyan132 0.06% Slavic106 0.05% Yugoslavian102 0.04% Brazilian91 0.04% Syrian89 0.04% Ghanaian82 0.04% Ethiopian78 0.03% Albanian78 0.03% Austrian76 0.03% Iraqi76 0.03% Latvian75 0.03% Finnish72 0.03% Luxembourger70 0.03% Australian65 0.03% Belgian63 0.03% Zimbabwean59 0.03% Slovak54 0.02% Palestinian44 0.02% Turkish42 0.02% Portuguese38 0.02% Slovene38 0.02% Jordanian36 0.02% Serbian35 0.01% Armenian34 0.01% Cajun34 0.01% Guyanese27 0.01% Sierra Leonean26 0.01% Estonian25 0.01% Romanian25 0.01% Pennsylvania German25 0.01% Bulgarian19 0.01% Moroccan18 0.01% South African12 0.01% Trinidadian and Tobagonian
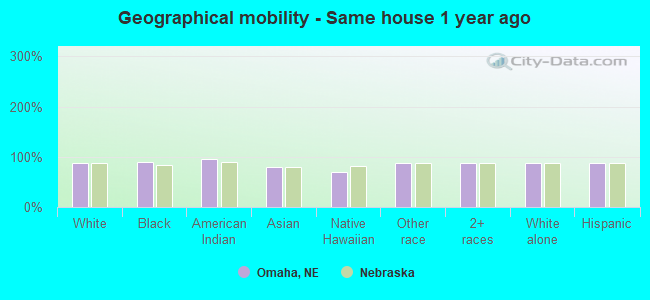
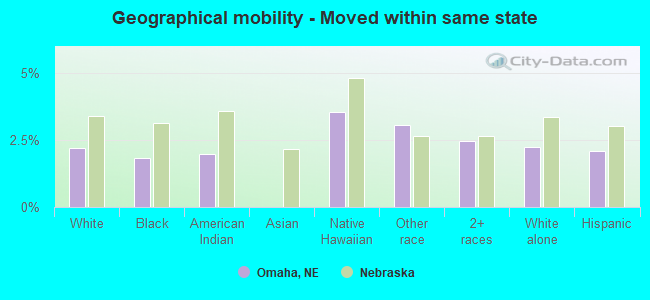
Geographical mobility in Omaha Same house 1 year ago 279,061 87.5% White (Caucasian)49,566 90.3% Black or African American3,234 95.8% American Indian / Alaska Native15,705 79.2% Asian132 69.8% Native Hawaiian / Pacific Islander21,487 86.9% Other race48,095 87.5% Two or more races268,342 87.4% White alone, not Hispanic / Latino64,710 88.5% Hispanic or LatinoMoved within same county 21,615 6.8% White / Caucasian2,104 3.8% Black or African American99 2.9% American Indian / Alaska Native3,256 16.4% Asian34 18.1% Native Hawaiian / Pacific Islander1,930 7.8% Other race3,977 7.2% Two or more races21,224 6.9% White alone, not Hispanic / Latino5,123 7.0% Hispanic or LatinoMoved within same state 7,006 2.2% White / Caucasian1,004 1.8% Black or African American66 2.0% American Indian / Alaska Native7 3.5% Native Hawaiian / Pacific Islander757 3.1% Other race1,346 2.5% Two or more races6,840 2.2% White alone, not Hispanic / Latino1,516 2.1% Hispanic or LatinoMoved from different state 10,394 3.3% White / Caucasian1,306 2.4% Black or African American47 1.4% American Indian / Alaska Native525 2.6% Asian1,142 2.1% Two or more races9,714 3.2% White alone, not Hispanic / Latino1,051 1.4% Hispanic or LatinoMoved from abroad 985 0.3% White921 1.7% Black or African American4 0.1% American Indian / Alaska Native342 1.7% Asian11 6.0% Native Hawaiian / Pacific Islander551 2.2% Other race375 0.7% Two or more races926 0.3% White alone, not Hispanic / Latino739 1.0% Hispanic or Latino
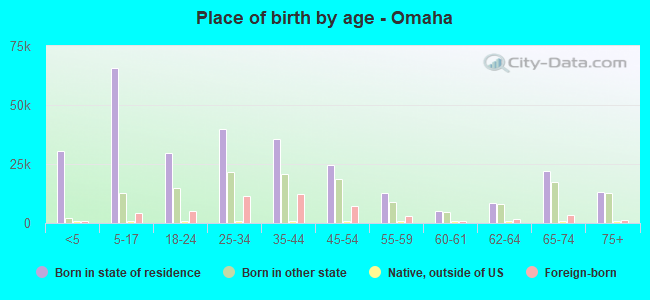
Children Nativity (place of birth) in Omaha
Children under 6 years - Living with two parents Both parents native 17,841 100.0% NativeBoth parents foreign-born 4,875 95.2% Native246 4.8% Foreign-bornOne native, one foreign-born parent 2,655 100.0% NativeChildren under 6 years - Living with one parent Native parent 10,761 100.0% NativeForeign-born parent 2,097 100.0% NativeChildren 6 to 17 years - Living with two parents Both parents native 36,302 98.7% Native460 1.3% Foreign-bornBoth parents foreign-born 7,575 83.0% Native1,554 17.0% Foreign-bornOne native, one foreign-born parent 3,193 92.0% Native278 8.0% Foreign-bornChildren 6 to 17 years - Living with one parent Native parent 18,182 100.0% NativeForeign-born parent 4,319 59.5% Native2,944 40.5% Foreign-born
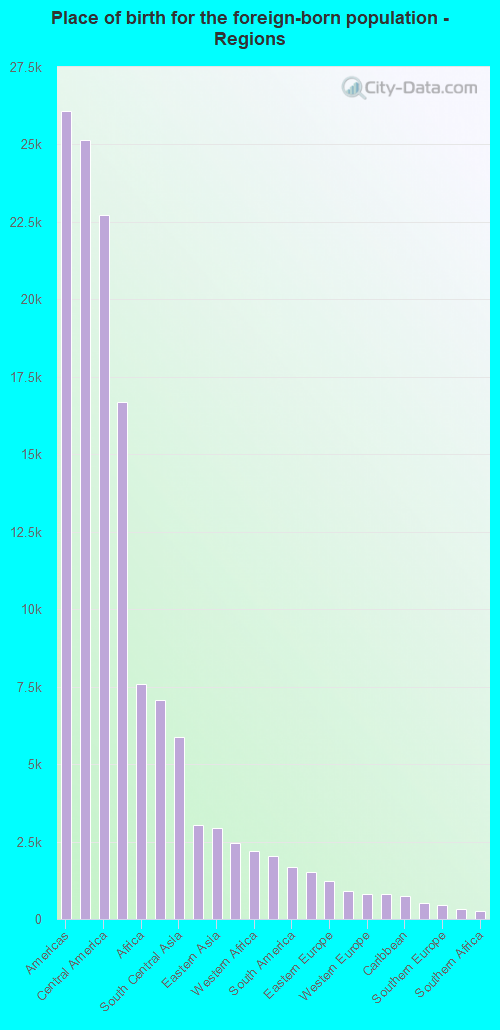
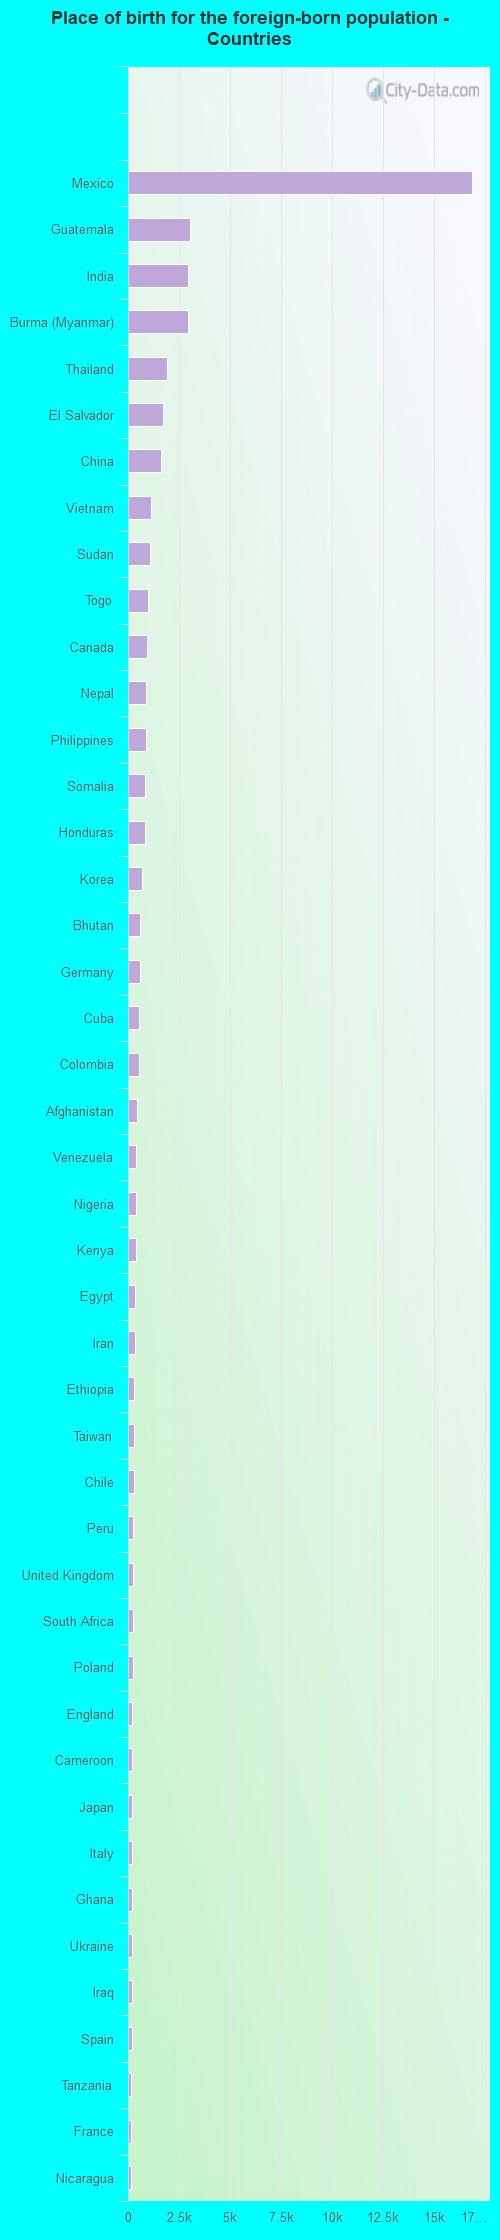
Place of birth for residents in Omaha 26,069 Americas25,158 Latin America22,733 Central America16,682 Asia7,597 Africa7,068 South Eastern Asia5,887 South Central Asia3,049 Europe2,934 Eastern Asia2,445 Eastern Africa2,210 Western Africa2,026 China1,673 South America1,521 Northern Africa1,241 Eastern Europe911 Northern America817 Western Europe791 Western Asia750 Caribbean528 Northern Europe462 Southern Europe322 Middle Africa253 Southern Africa139 Oceania103 Australia and New Zealand Subregion16,872 Mexico3,027 Guatemala2,943 India2,925 Burma (Myanmar)1,905 Thailand1,720 El Salvador1,625 China1,119 Vietnam1,098 Sudan986 Togo911 Canada905 Nepal860 Philippines833 Somalia815 Honduras696 Korea594 Bhutan566 Germany545 Cuba526 Colombia425 Afghanistan416 Venezuela398 Nigeria374 Kenya367 Egypt326 Iran312 Ethiopia291 Taiwan276 Chile260 Peru255 United Kingdom253 South Africa232 Poland220 England213 Cameroon211 Japan208 Italy197 Ghana191 Ukraine181 Iraq172 Spain170 Tanzania164 France163 Nicaragua149 Jordan137 Russia135 Brazil122 Bosnia and Herzegovina117 Belarus109 Indonesia109 Hong Kong109 Syria103 Zimbabwe101 Saudi Arabia98 Dominican Republic97 Sierra Leone91 Australia90 Jamaica86 Turkey78 Pakistan74 Ivory Coast71 Malaysia71 Laos67 Greece67 Latvia65 Democratic Republic of Congo (Zaire)62 Czechoslovakia61 Uganda61 Israel57 Belize56 Romania55 Lithuania55 Hungary45 Costa Rica43 Congo32 Lebanon31 Kazakhstan27 Scotland26 Argentina25 Panama25 Bangladesh25 Netherlands24 Sri Lanka23 Ecuador20 Croatia19 Kuwait19 Morocco18 Bulgaria16 Switzerland15 Algeria14 Micronesia14 Portugal13 Uzbekistan12 Belgium12 Ireland11 North Macedonia (Macedonia)11 New Zealand9 Azerbaijan9 Marshall Islands8 Barbados6 Cambodia5 United Arab Emirates5 Austria4 St. Lucia3 Trinidad and Tobago
Grandparents responsible for own grandchildren in Omaha
Grandparents (30 to 59 years) White / Caucasian 613 64.4% Responsible for grandchildren339 35.6% Not responsible for grandchildrenBlack or African American 610 59.9% Responsible for grandchildren408 40.1% Not responsible for grandchildrenAmerican Indian / Alaska Native 47 54.3% Responsible for grandchildren40 45.7% Not responsible for grandchildrenAsian 25 14.3% Responsible for grandchildren150 85.7% Not responsible for grandchildrenOther race 174 59.9% Responsible for grandchildren117 40.1% Not responsible for grandchildrenTwo or more races 219 43.7% Responsible for grandchildren282 56.3% Not responsible for grandchildrenWhite alone, not Hispanic / Latino 517 60.4% Responsible for grandchildren339 39.6% Not responsible for grandchildrenHispanic or Latino 544 67.4% Responsible for grandchildren263 32.6% Not responsible for grandchildrenGrandparents (60 years and over) White / Caucasian 330 18.5% Responsible for grandchildren1,451 81.5% Not responsible for grandchildrenBlack or African American 217 34.1% Responsible for grandchildren420 65.9% Not responsible for grandchildrenAmerican Indian / Alaska Native 39 100.0% Not responsible for grandchildrenAsian 322 100.0% Not responsible for grandchildrenOther race 108 32.1% Responsible for grandchildren228 67.9% Not responsible for grandchildrenTwo or more races 11 1.7% Responsible for grandchildren619 98.3% Not responsible for grandchildrenWhite alone, not Hispanic / Latino 265 15.4% Responsible for grandchildren1,451 84.6% Not responsible for grandchildrenHispanic or Latino 140 9.5% Responsible for grandchildren1,327 90.5% Not responsible for grandchildren
Zip codes: 68022 , 68102 , 68104 , 68105 , 68106 , 68107 , 68108 , 68110 , 68111 , 68112 , 68114 , 68116 , 68117 , 68118 , 68122 , 68124 , 68127 , 68130 , 68131 , 68132 , 68134 , 68135 , 68137 , 68142 , 68144 , 68152 , 68154 , 68164 , 68178 .