Estimated zip code population in 2022: 6,629 Zip code population in 2010: 5,837 Zip code population in 2000: 6,861
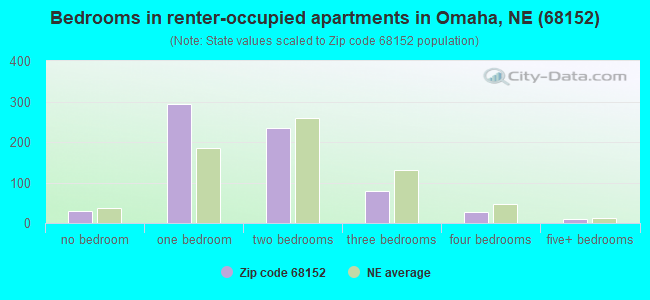
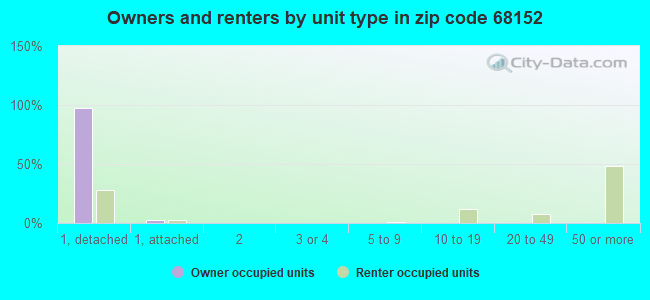
Houses and condos: 2,884 Renter-occupied apartments: 665
% of renters here:
24%
State:
34%
March 2022 cost of living index in zip code 68152: 89.9 (less than average, U.S. average is 100)
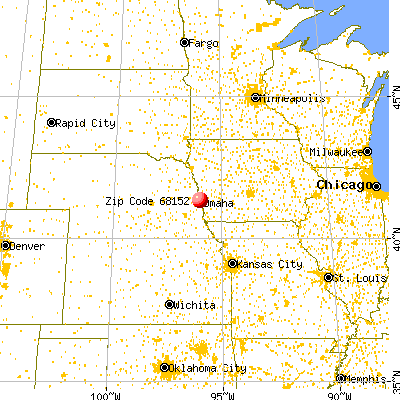
Land area: 13.6 sq. mi. Water area: 0.1 sq. mi.
Population density: 486 people per square mile
(low).
OSM Map
General Map
Google Map
MSN Map
OSM Map
General Map
Google Map
MSN Map
OSM Map
General Map
Google Map
MSN Map
OSM Map
General Map
Google Map
MSN Map
Please wait while loading the map...
Real estate property taxes paid for housing units in 2022:
This zip code:
1.4% ($4,444)
Nebraska:
1.4% ($3,313)
Median real estate property taxes paid for housing units with mortgages in 2022: $4,556 (1.4%) Median real estate property taxes paid for housing units with no mortgage in 2022: $3,976 (1.4%)
Business Search- 14 Million verified businesses
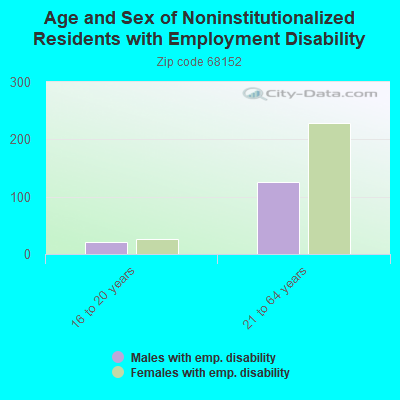
Males: 2,976
(44.9%)
Females: 3,652
(55.1%)
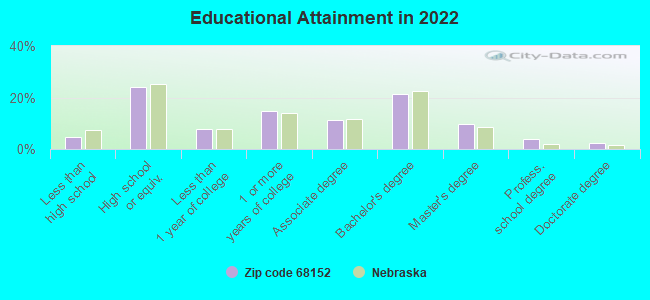
For population 25 years and over in 68152:
High school or higher: 95.4%
Bachelor's degree or higher: 37.6%
Graduate or professional degree: 16.3%
Unemployed: 1.3%
Mean travel time to work (commute): 22.9 minutes
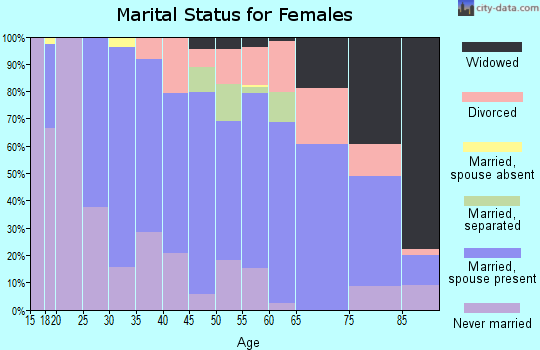
For population 15 years and over in 68152:
Never married: 19.6%
Now married: 60.4%
Separated: 0.7%
Widowed: 7.7%
Divorced: 11.6%
Zip code 68152 compared to state average:
Unemployed percentage below state average.
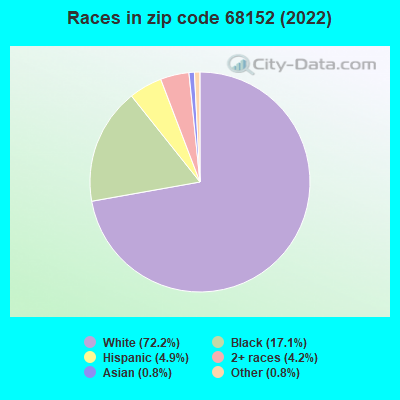
Black race population percentage significantly above state average.
Hispanic race population percentage below state average.
Median age significantly above state average.
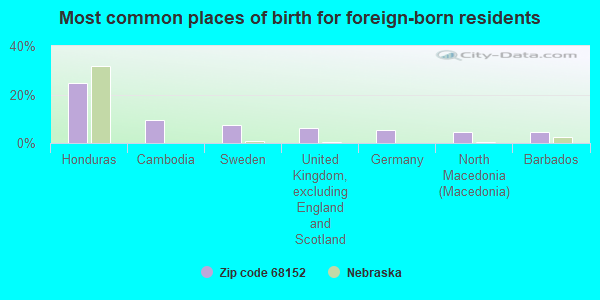
Foreign-born population percentage significantly below state average.
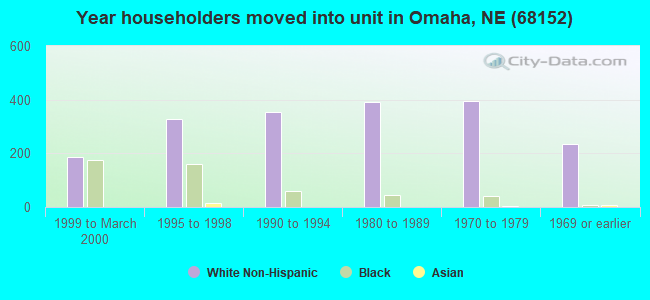
Length of stay since moving in significantly above state average.
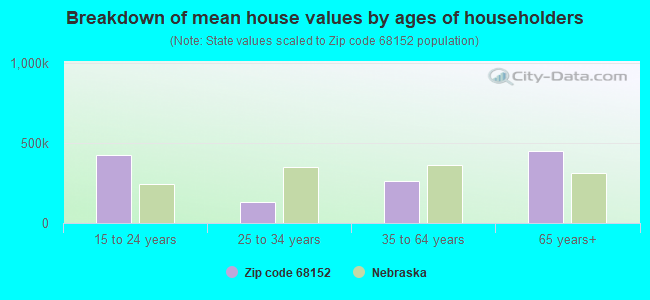
Estimated median house/condo value in 2022: $311,072
68152:
$311,072
Nebraska:
$232,400
According to our research of Nebraska and other state lists, there were 12 registered sex offenders living in 68152 zip code as of May 09, 2024. The ratio of all residents to sex offenders in zip code 68152 is 530 to 1. The ratio of registered sex offenders to all residents in this zip code is lower than the state average.
Median resident age:
This zip code:
47.5 years
Nebraska median age:
37.4 years
Average household size:
This zip code:
2.3 people
Nebraska:
2.4 people
Averages for the 2020 tax year for zip code 68152, filed in 2021:
Average Adjusted Gross Income (AGI) in 2020: $93,580 (Individual Income Tax Returns)
Here:
$93,580
State:
$73,874
Salary/wage: $71,524 (reported on 78.4% of returns)
Here:
$71,524
State:
$58,268
(% of AGI for various income ranges: 1079.2% for AGIs below $25k, 3630.7% for AGIs $25k-50k, 6124.8% for AGIs $50k-75k, 8450.5% for AGIs $75k-100k, 16979.0% for AGIs $100k-200k, 93035.7% for AGIs over 200k)
Taxable interest for individuals: $2,086 (reported on 36.2% of returns)
This zip code:
$2,086
Nebraska:
$1,748
(% of AGI for various income ranges: 13.8% for AGIs below $25k, 31.9% for AGIs $25k-50k, 60.6% for AGIs $50k-75k, 50.5% for AGIs $75k-100k, 150.0% for AGIs $100k-200k, 2018.6% for AGIs over 200k)
Ordinary dividends: $16,165 (reported on 25.9% of returns)
Here:
$16,165
State:
$7,841
(% of AGI for various income ranges: 36.1% for AGIs below $25k, 72.4% for AGIs $25k-50k, 161.6% for AGIs $50k-75k, 202.4% for AGIs $75k-100k, 557.7% for AGIs $100k-200k, 14555.7% for AGIs over 200k)
Net capital gain/loss in AGI: +$21,629 (reported on 23.4% of returns)
Here:
+$21,629
State:
+$21,703
(% of AGI for various income ranges: 10.9% for AGIs below $25k, 35.0% for AGIs $25k-50k, 195.2% for AGIs $50k-75k, 172.4% for AGIs $75k-100k, 785.7% for AGIs $100k-200k, 18052.9% for AGIs over 200k)
Profit/loss from business: +$11,674 (reported on 14.7% of returns)
Here:
+$11,674
State:
+$11,239
(% of AGI for various income ranges: 90.5% for AGIs below $25k, 78.7% for AGIs $25k-50k, 199.4% for AGIs $50k-75k, 331.4% for AGIs $75k-100k, 329.3% for AGIs $100k-200k, 3090.0% for AGIs over 200k)
Taxable individual retirement arrangement distribution: $23,089 (reported on 13.8% of returns)
68152:
$23,089
Nebraska:
$18,251
(% of AGI for various income ranges: 95.0% for AGIs below $25k, 122.8% for AGIs $25k-50k, 341.6% for AGIs $50k-75k, 621.0% for AGIs $75k-100k, 1288.3% for AGIs $100k-200k, 3772.9% for AGIs over 200k)
Self-employed (Keogh) retirement plans: $26,700 (reported on 0.6% of returns)
68152:
$26,700
Nebraska:
$23,519
(% of AGI for various income ranges: 178.0% for AGIs $100k-200k)
Total itemized deductions: $38,926 (reported on 10.9% of returns)
Here:
$38,926
State:
$37,704
(% of AGI for various income ranges: 237.2% for AGIs $25k-50k, 306.5% for AGIs $50k-75k, 520.5% for AGIs $75k-100k, 1008.0% for AGIs $100k-200k, 10394.3% for AGIs over 200k)
Charity contributions: $17,369 (reported on 10.0% of returns)
Here:
$17,369
State:
$15,251
(% of AGI for various income ranges: 29.8% for AGIs $25k-50k, 62.9% for AGIs $50k-75k, 111.9% for AGIs $75k-100k, 389.0% for AGIs $100k-200k, 5428.6% for AGIs over 200k)
Taxes paid: $8,341 (reported on 10.6% of returns)
68152:
$8,341
State:
$8,015
(% of AGI for various income ranges: 41.3% for AGIs $25k-50k, 82.9% for AGIs $50k-75k, 152.4% for AGIs $75k-100k, 303.7% for AGIs $100k-200k, 1607.1% for AGIs over 200k)
Earned income credit: $2,312 (reported on 12.8% of returns)
Here:
$2,312
State:
$2,260
(% of AGI for various income ranges: 88.6% for AGIs below $25k, 67.2% for AGIs $25k-50k)
Percentage of individuals using paid preparers for their 2020 taxes: 93.4%
Here:
93%
State:
95%
(% for various income ranges: 92.3% for AGIs below $25k, 94.3% for AGIs $25k-50k, 91.3% for AGIs $50k-75k, 96.9% for AGIs $75k-100k, 93.0% for AGIs $100k-200k, 95.8% for AGIs over 200k)
Averages for the 2012 tax year for zip code 68152, filed in 2013:
Average Adjusted Gross Income (AGI) in 2012: $79,907 (Individual Income Tax Returns)
Here:
$79,907
State:
$60,572
Salary/wage: $59,780 (reported on 79.5% of returns)
Here:
$59,780
State:
$47,046
(% of AGI for various income ranges: 68.4% for AGIs below $25k, 71.4% for AGIs $25k-50k, 67.4% for AGIs $50k-75k, 66.7% for AGIs $75k-100k, 71.1% for AGIs $100k-200k, 43.3% for AGIs over 200k)
Taxable interest for individuals: $2,119 (reported on 43.9% of returns)
This zip code:
$2,119
Nebraska:
$1,535
(% of AGI for various income ranges: 1.7% for AGIs below $25k, 0.6% for AGIs $25k-50k, 0.8% for AGIs $50k-75k, 0.9% for AGIs $75k-100k, 0.8% for AGIs $100k-200k, 1.6% for AGIs over 200k)
Ordinary dividends: $8,578 (reported on 30.0% of returns)
Here:
$8,578
State:
$5,776
(% of AGI for various income ranges: 3.1% for AGIs below $25k, 1.8% for AGIs $25k-50k, 2.2% for AGIs $50k-75k, 2.4% for AGIs $75k-100k, 2.5% for AGIs $100k-200k, 4.7% for AGIs over 200k)
Net capital gain/loss in AGI: +$17,251 (reported on 26.1% of returns)
Here:
+$17,251
State:
+$16,171
(% of AGI for various income ranges: 1.0% for AGIs $25k-50k, 0.7% for AGIs $50k-75k, 0.9% for AGIs $75k-100k, 1.8% for AGIs $100k-200k, 13.1% for AGIs over 200k)
Profit/loss from business: +$15,676 (reported on 16.2% of returns)
Here:
+$15,676
State:
+$9,897
(% of AGI for various income ranges: 7.2% for AGIs below $25k, 3.6% for AGIs $25k-50k, 2.5% for AGIs $50k-75k, 2.7% for AGIs $75k-100k, 2.2% for AGIs $100k-200k, 3.5% for AGIs over 200k)
Taxable individual retirement arrangement distribution: $19,663 (reported on 16.2% of returns)
68152:
$19,663
Nebraska:
$12,804
(% of AGI for various income ranges: 4.9% for AGIs below $25k, 4.1% for AGIs $25k-50k, 3.6% for AGIs $50k-75k, 3.5% for AGIs $75k-100k, 3.8% for AGIs $100k-200k, 4.2% for AGIs over 200k)
Self-employment retirement plans: $17,200 (reported on 1.0% of returns)
68152:
$17,200
Nebraska:
$18,457
Total itemized deductions: $28,325 (20% of AGI, reported on 44.6% of returns)
Here:
$28,325
State:
$23,343
Here:
20.2% of AGI
State:
18.7% of AGI
(% of AGI for various income ranges: 16.1% for AGIs below $25k, 12.9% for AGIs $25k-50k, 15.6% for AGIs $50k-75k, 15.9% for AGIs $75k-100k, 16.7% for AGIs $100k-200k, 16.0% for AGIs over 200k)
Charity contributions: $6,775 (reported on 38.9% of returns)
Here:
$6,775
State:
$4,921
(% of AGI for various income ranges: 1.3% for AGIs below $25k, 1.8% for AGIs $25k-50k, 2.4% for AGIs $50k-75k, 2.6% for AGIs $75k-100k, 3.2% for AGIs $100k-200k, 4.5% for AGIs over 200k)
Taxes paid: $11,604 (reported on 44.2% of returns)
68152:
$11,604
State:
$9,758
(% of AGI for various income ranges: 2.8% for AGIs below $25k, 3.9% for AGIs $25k-50k, 5.5% for AGIs $50k-75k, 5.9% for AGIs $75k-100k, 7.6% for AGIs $100k-200k, 7.2% for AGIs over 200k)
Earned income credit: $2,287 (reported on 12.5% of returns)
Here:
$2,287
State:
$2,188
(% of AGI for various income ranges: 5.5% for AGIs below $25k, 0.9% for AGIs $25k-50k)
Percentage of individuals using paid preparers for their 2012 taxes: 54.5%
Here:
54%
State:
57%
(% for various income ranges: 44.0% for AGIs below $25k, 50.8% for AGIs $25k-50k, 62.2% for AGIs $50k-75k, 57.1% for AGIs $75k-100k, 60.5% for AGIs $100k-200k, 88.2% for AGIs over 200k)
Averages for the 2004 tax year for zip code 68152, filed in 2005:
Average Adjusted Gross Income (AGI) in 2004: $72,934 (Individual Income Tax Returns)
Here:
$72,934
State:
$44,271
Salary/wage: $49,254 (reported on 80.4% of returns)
Here:
$49,254
State:
$38,230
(% of AGI for various income ranges: 129.6% for AGIs below $10k, 68.8% for AGIs $10k-25k, 71.9% for AGIs $25k-50k, 72.6% for AGIs $50k-75k, 78.5% for AGIs $75k-100k, 40.5% for AGIs over 100k)
Taxable interest for individuals: $3,958 (reported on 55.3% of returns)
This zip code:
$3,958
Nebraska:
$1,759
(% of AGI for various income ranges: 10.5% for AGIs below $10k, 3.7% for AGIs $10k-25k, 2.4% for AGIs $25k-50k, 1.8% for AGIs $50k-75k, 1.5% for AGIs $75k-100k, 3.5% for AGIs over 100k)
Taxable dividends: $9,838 (reported on 35.9% of returns)
Here:
$9,838
State:
$2,804
(% of AGI for various income ranges: 10.5% for AGIs below $10k, 2.3% for AGIs $10k-25k, 1.8% for AGIs $25k-50k, 1.7% for AGIs $50k-75k, 1.7% for AGIs $75k-100k, 6.8% for AGIs over 100k)
Net capital gain/loss: +$32,140 (reported on 31.2% of returns)
Here:
+$32,140
State:
+$7,887
(% of AGI for various income ranges: -3.8% for AGIs below $10k, 0.4% for AGIs $10k-25k, 0.3% for AGIs $25k-50k, 1.4% for AGIs $50k-75k, 0.4% for AGIs $75k-100k, 22.6% for AGIs over 100k)
Profit/loss from business: +$11,337 (reported on 16.4% of returns)
Here:
+$11,337
State:
+$7,743
(% of AGI for various income ranges: 2.0% for AGIs below $10k, 2.7% for AGIs $10k-25k, 2.4% for AGIs $25k-50k, 1.8% for AGIs $50k-75k, 3.2% for AGIs $75k-100k, 2.6% for AGIs over 100k)
IRA payment deduction: $2,947 (reported on 3.8% of returns)
68152:
$2,947
Nebraska:
$2,902
(% of AGI for various income ranges: 0.4% for AGIs $10k-25k, 0.3% for AGIs $25k-50k, 0.2% for AGIs $50k-75k, 0.3% for AGIs $75k-100k, 0.1% for AGIs over 100k)
Self-employed pension: $16,160 (reported on 0.8% of returns)
Here:
$16,160
Nebraska:
$12,366
Total itemized deductions: $23,929 (18% of AGI, reported on 46.7% of returns)
Here:
$23,929
State:
$18,692
Here:
18.3% of AGI
State:
21.1% of AGI
(% of AGI for various income ranges: 18.2% for AGIs below $10k, 13.6% for AGIs $10k-25k, 17.1% for AGIs $25k-50k, 18.4% for AGIs $50k-75k, 18.6% for AGIs $75k-100k, 13.9% for AGIs over 100k)
Charity contributions deductions: $6,739 (5% of AGI, reported on 43.7% of returns)
Here:
$6,739
State:
$3,500
Here:
5.0% of AGI
State:
3.8% of AGI
(% of AGI for various income ranges: 1.7% for AGIs below $10k, 1.6% for AGIs $10k-25k, 2.8% for AGIs $25k-50k, 3.0% for AGIs $50k-75k, 3.3% for AGIs $75k-100k, 4.8% for AGIs over 100k)
Total tax: $13,602 (reported on 78.5% of returns)
68152:
$13,602
State:
$6,550
(% of AGI for various income ranges: 3.4% for AGIs below $10k, 4.1% for AGIs $10k-25k, 6.6% for AGIs $25k-50k, 8.6% for AGIs $50k-75k, 10.3% for AGIs $75k-100k, 19.1% for AGIs over 100k)
Earned income credit: $1,605 (reported on 10.1% of returns)
Here:
$1,605
State:
$1,643
Percentage of individuals using paid preparers for their 2004 taxes: 58.9%
Here:
59%
State:
62%
(% for various income ranges: 48.1% for AGIs below $10k, 55.6% for AGIs $10k-25k, 61.3% for AGIs $25k-50k, 63.6% for AGIs $50k-75k, 58.0% for AGIs $75k-100k, 70.5% for AGIs over 100k)
Likely homosexual households (counted as self-reported same-sex unmarried-partner households)
Lesbian couples: 0.0% of all households
Gay men: 0.6% of all households
Household received Food Stamps/SNAP in the past 12 months: 135 Household did not receive Food Stamps/SNAP in the past 12 months: 2,696
Women who had a birth in the past 12 months: 121 (86 now married, 33 unmarried) Women who did not have a birth in the past 12 months: 1,128 (613 now married, 515 unmarried)
Housing units in zip code 68152 with a mortgage: 1,534 (150 second mortgage, 2 home equity loan, 110 both second mortgage and home equity loan) Houses without a mortgage: 37
Median monthly owner costs for units with a mortgage: $1,847 Median monthly owner costs for units without a mortgage: $779
Residents with income below the poverty level in 2022:
This zip code:
6.3%
Whole state:
11.2%
Residents with income below 50% of the poverty level in 2022:
This zip code:
3.6%
Whole state:
6.1%
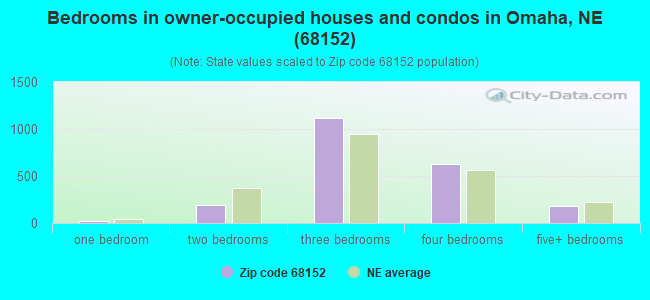
Median number of rooms in houses and condos:
Here:
7.3
State:
7.1
Median number of rooms in apartments:
Here:
3.5
State:
4.2
Notable locations in this zip code not listed on our city pages
Notable locations in zip code 68152: Twin Brooks Camp (A), Omaha Country Club (B), Midwest Dermatology Clinic (C), Midwest Urology Associates PC Center (D), Brumm Eye Center (E), Eye Center Optical (F). Display/hide their locations on the map
Churches in zip code 68152 include: United Brethren Church (A), Victory Church (B), Olive Crest United Methodist Church (C), Benson Park Kingdom Hall (D), Walking by Faith Christian Church (E), Prince of Peace Church (F). Display/hide their locations on the map
In group quarters: 151 (-1 institutionalized population)
Size of family households: 1,021 2-persons, 392 3-persons, 286 4-persons, 70 5-persons, 99 6-persons, 17 7-or-more-persons
Size of nonfamily households: 859 1-person, 92 2-persons
1,094 married couples with children.
222 single-parent households (38 men, 184 women).
96.9% of residents of 68152 zip code speak English at home.
2.3% of residents speak Spanish at home (56% very well, 42% well, 2% not well).
0.5% of residents speak other Indo-European language at home (87% very well, 13% well).
1.0% of residents speak Asian or Pacific Island language at home (68% very well, 32% well).
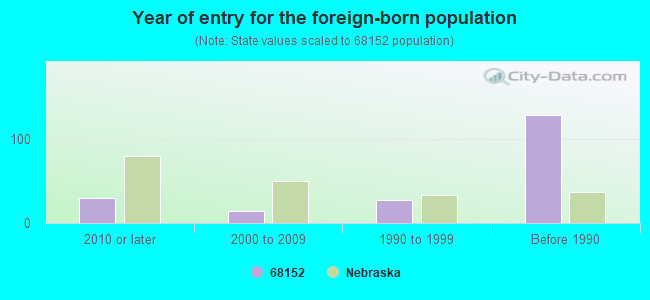
Foreign born population: 142 (2.2%) (37.0% of them are naturalized citizens)
Facilities with environmental interests located in this zip code:
WILLIAMS MACHINE & TOOL CO# (9314 N 45TH ST in OMAHA, NE)
COMPLIANCE ACTIVITY (Tracking inspections of insecticide, fungicide, and rodenticide, and toxic substances) STATE MASTER (Nebraska tracking) - -121597-GW-0525, LEAKING STORAGE TANK, -NED007259351, HAZARDOUS WASTE PROGRAM (Resource Conservation and Recovery Act (tracking hazardous waste)) Business SIC classification: PUMPS AND PUMPING EQUIPMENT Business NAICS classification: PUMP AND PUMPING EQUIPMENT MANUFACTURING. Organizations: C G F INDUSTRIES (CONTACT/OWNER)
, ENERGY MFG CO INC (CONTACT/OWNER)
FOREST LAWN MEMORIAL PARK (7909 MORMON BRIDGE RD in OMAHA, NE)
AIR MINOR (AIRS/AFS) STATE MASTER (Nebraska tracking) - AIR PROGRAM, -052289-99-0005, LEAKING STORAGE TANK, -AP3268, CRITERIA AND HAZARDOUS AIR POLLUTANT INVENTORY (Inventory of air pollution sources) Business SIC classification: CEMETERY SUBDIVIDERS AND DEVELOPERS Business NAICS classification: CEMETERIES AND CREMATORIES. Alternative names: FOREST LAWM MEMORIAL PARK
ANDERSON EXCAVATING LANDFILL (13707 CALHOUN RD in OMAHA, NE)
AIR MINOR (AIRS/AFS) STATE MASTER (Nebraska tracking) - AIR PROGRAM, REFUSE DISPOSAL, -ANDERSONEXCAVATING, LEGAL SERVICES, -CASENO.2222, Business SIC classification: EXCAVATION WORK
HALE MIDDLE SCHOOL ( in OMAHA, NE)
(Geographic Names Information System) (National Center for Education Statistics) - STATE ID-280001023 Organizations: OMAHA PUBLIC SCHOOLS (SCHOOL DISTRICT)
MAURICE L POND DISPOSAL AREA (13305 NORTH 47TH STREET in OMAHA, NE)
SUPERFUND (Superfund database) STATE MASTER (Nebraska tracking) - REFUSE DISPOSAL, SUPERFUND Alternative names: POND, MAURICE L SITE
WINTERGREEN PARK APARTMENTS (6636 NORTH 51ST PLAZA in OMAHA, NE)
ENFORCEMENT/COMPLIANCE ACTIVITY (Integrated Compliance Information System) COMPLIANCE ACTIVITY (Tracking inspections of insecticide, fungicide, and rodenticide, and toxic substances) Business SIC classification: OPERATORS OF APARTMENT BUILDINGS
DIMATIC TOOL AND DIE CO (9520 N 48 in OMAHA, NE)
COMPLIANCE ACTIVITY (Tracking inspections of insecticide, fungicide, and rodenticide, and toxic substances) Business SIC classification: HARDWARE
Housing units lacking complete plumbing facilities: 0.9% Housing units lacking complete kitchen facilities: 1.5%
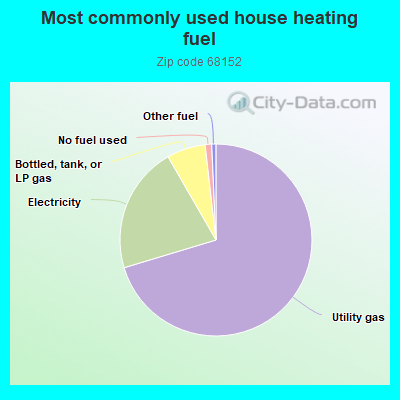
70.2%Utility gas
21.3%Electricity
6.5%Bottled, tank, or LP gas
1.1%No fuel used
0.7%Other fuel
Population in 1990: 6,518. Population change in the 1990s: +343 (+5.3%).
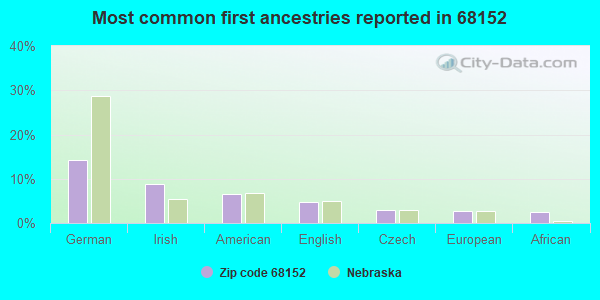
Place of birth for U.S.-born residents:
This state: 4,615
Northeast: 101
Midwest: 1,036
South: 343
West: 321
67% of the 68152 zip code residents lived in the same house 5 years ago. Out of people who lived in different houses, 73% lived in this county. Out of people who lived in different counties, 50% lived in Nebraska.
93% of the 68152 zip code residents lived in the same house 1 year ago. Out of people who lived in different houses, 83% moved from this county. Out of people who lived in different houses, 13% moved from different county within same state. Out of people who lived in different houses, 2% moved from different state. Out of people who lived in different houses, 2% moved from abroad.
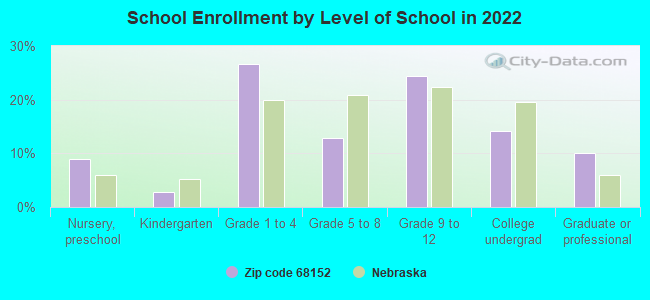
Private vs. public school enrollment:
Students in private schools in grades 1 to 8 (elementary and middle school): 197
Here:
39.1%
Nebraska:
14.1%
Students in private schools in grades 9 to 12 (high school): 174
Here:
53.9%
Nebraska:
12.5%
Students in private undergraduate colleges: 54
Here:
30.9%
Nebraska:
18.0%
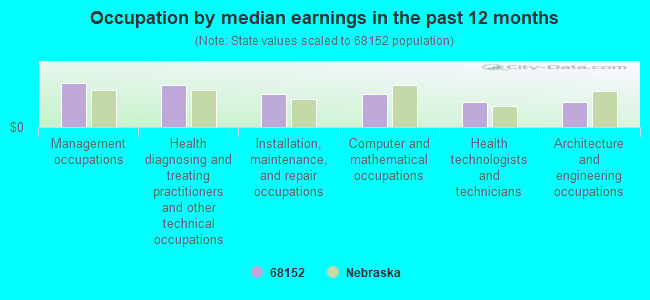
Occupation by median earnings in the past 12 months ($)
110,221Management occupations
104,923Health diagnosing and treating practitioners and other technical occupations
82,499Installation, maintenance, and repair occupations
81,995Computer and mathematical occupations
63,437Health technologists and technicians
61,950Architecture and engineering occupations
Companies with federal contracts located in this zip code (OMAHA, NE):
INTEGRITY ELECTRIC SERVICE (6610 NORTHERN HILLS DRIVE; small business) : $3,559,113 in 93 contractsfrom 1999 to 2006
Contracts for Maintenance, Repair or Alteration of Real Property -- Other Administrative Facilities and Service Buildings, Maintenance, Repair or Alteration of Real Property -- Office Buildings, Construction of Structures and Facilities -- Tunnels and Subsurface Structures, Maintenance, Repair and Rebuilding of Equipment -- Maintenance and Repair Shop Equipment, and moreby Air Force, Department of Veterans Affairs, Public Buildings Service Signed by year:2000: $35,000; 2001: $342,014; 2002: $229,048; 2003: $1,188,183; 2004: $737,469; 2005: $757,613; 2006: $234,786.
Biggest contracts:
$795,573 with Air Force for Maintenance, Repair or Alteration of Real Property -- Other Administrative Facilities and Service Buildings. Signed on 2003-09-26. Completion date: 2004-07-23.
$227,353 with Air Force for Maintenance, Repair or Alteration of Real Property -- Office Buildings. Signed on 2004-11-18. Completion date: 2005-08-30.
$219,817 with Air Force for Construction of Structures and Facilities -- Tunnels and Subsurface Structures. Signed on 2005-08-17. Completion date: 2005-02-10.
$150,000 with Air Force for Maintenance, Repair or Alteration of Real Property -- Office Buildings. Signed on 2005-06-29. Completion date: 2005-08-30.
TETRA TECH INC (9910 N 48TH ST) : $1,599,918 in 14 contractsfrom 2003 to 2005
Contracts for Architect - Engineer Services (including landscaping, interior layout, and designing) by Army Signed by year:2000: $0; 2001: $0; 2002: $0; 2003: $543,683; 2004: $366,173; 2005: $690,062; 2006: $0.
Biggest contracts:
$1,000,000 with Army for Architect - Engineer Services (including landscaping, interior layout, and designing). Signed on 2004-08-10. Completion date: 2005-09-15.
$321,795 with Army for Architect - Engineer Services (including landscaping, interior layout, and designing). Taking place in NM. Signed on 2005-09-30. Completion date: 2007-03-09.
$290,713 with Army for Architect - Engineer Services (including landscaping, interior layout, and designing). Taking place in UT. Signed on 2004-03-31. Completion date: 2005-06-30.
$276,458 with Army for Architect - Engineer Services (including landscaping, interior layout, and designing). Taking place in MD. Signed on 2005-09-29. Completion date: 2007-10-04.
UNIVERSITY OF NEBRASKA (60TH & DODGE ST) : $296,744 in 3 contractsin 2005
$151,643 with Air Force for Tuition, Registration, and Membership Fees. Signed on 2005-01-27. Completion date: 2005-09-30.
$144,141, same as above.Signed on 2005-04-21. Completion date: 2005-09-30.
$960, same as above.Signed on 2005-09-30. Completion date: 2004-09-30.
FEATHER WORKS OF NEBRASKA, LLC (7166 NORTH 52ND STREET; small business) : $73,000 in 3 contractsfrom 2001 to 2006
$68,280 with U.S. Army Corps of Engineers - civil program financing only for Historical Studies. Taking place in MO. Signed on 2001-05-23. Completion date: 2003-05-18.
$4,800, same as above.Signed on 2002-12-13. Completion date: 2003-05-18.
-$80 with Army for Historical Studies. Taking place in MO. Signed on 2006-03-21. Completion date: 2003-05-18.
HIRSCH DESIGN, INC (9136 MORMON BRIDGE ROAD; small business)
$3,500 with Air Force for Other ADP and Telecommunications Services (includes data storage on tapes, compact disks, etc.). Signed on 2004-08-25. Completion date: 2005-08-24.
Top industries in this zip code by the number of employees in 2005:
Arts, Entertainment, and Recreation: Golf Courses and Country Clubs (100-249 employees: 1 establishment)
Health Care and Social Assistance: Homes for the Elderly (50-99: 1, 20-49: 1)
Educational Services: Elementary and Secondary Schools (50-99: 1)
Other Services (except Public Administration): Voluntary Health Organizations (10-19: 2, 5-9: 1, 1-4: 3)
Professional, Scientific, and Technical Services: Environmental Consulting Services (20-49: 1)
People in group quarters in 2010:
37 people in residential treatment centers for juveniles (non-correctional)
19 people in group homes for juveniles (non-correctional)
4 people in group homes intended for adults
3 people in workers' group living quarters and job corps centers
People in group quarters in 2000:
191 people in nursing homes
185 people in hospitals or wards for drug/alcohol abuse
36 people in residential treatment centers for emotionally disturbed children
20 people in mental (psychiatric) hospitals or wards
13 people in schools, hospitals, or wards for the intellectually disabled
3 people in homes for the mentally retarded
Fatal accident statistics in 2014:
Fatal accident count: 1
Vehicles involved in fatal accidents: 1
Fatal accidents caused by drunken drivers: 1
Fatalities: 1
Persons involved in fatal accidents: 1
Pedestrians involved in fatal accidents: 0
Fatal accident statistics in 2012:
Fatal accident count: 1
Vehicles involved in fatal accidents: 1
Fatal accidents caused by drunken drivers: 0
Fatalities: 1
Persons involved in fatal accidents: 1
Pedestrians involved in fatal accidents: 0
Home Mortgage Disclosure Act Aggregated Statistics For Year 2009 (Based on 2 full and 6 partial tracts)
A) FHA, FSA/RHS & VA Home Purchase Loans
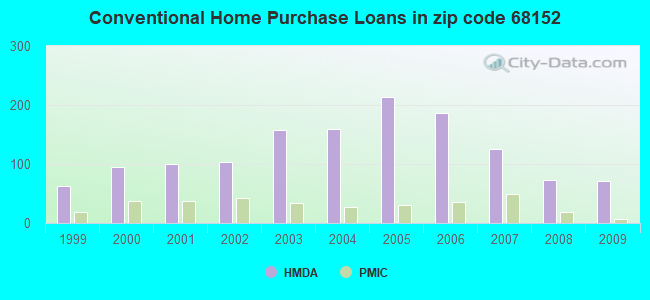
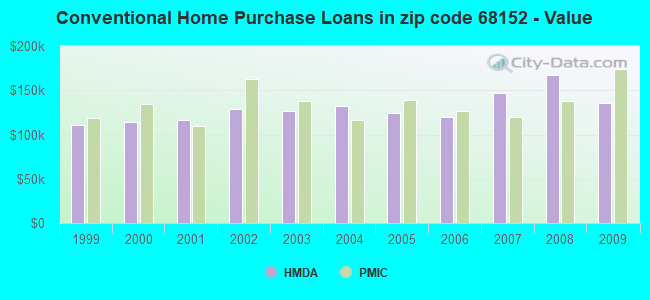
B) Conventional Home Purchase Loans
C) Refinancings
D) Home Improvement Loans
E) Loans on Dwellings For 5+ Families
F) Non-occupant Loans on < 5 Family Dwellings (A B C & D)
G) Loans On Manufactured Home Dwelling (A B C & D)
Number
Average Value
Number
Average Value
Number
Average Value
Number
Average Value
Number
Average Value
Number
Average Value
Number
Average Value
LOANS ORIGINATED
80
$145,329
72
$135,781
324
$157,538
51
$44,673
1
$1,299,320
19
$111,908
1
$141,260
APPLICATIONS APPROVED, NOT ACCEPTED
1
$115,810
5
$136,542
17
$149,945
5
$38,408
0
$0
2
$68,210
0
$0
APPLICATIONS DENIED
11
$130,147
9
$132,218
102
$163,108
25
$40,830
0
$0
3
$39,027
2
$26,375
APPLICATIONS WITHDRAWN
6
$110,657
4
$197,125
55
$152,711
3
$104,763
0
$0
0
$0
0
$0
FILES CLOSED FOR INCOMPLETENESS
3
$134,757
1
$120,670
22
$147,936
3
$25,453
0
$0
3
$66,600
0
$0
Aggregated Statistics For Year 2008 (Based on 2 full and 6 partial tracts)
A) FHA, FSA/RHS & VA Home Purchase Loans
B) Conventional Home Purchase Loans
C) Refinancings
D) Home Improvement Loans
E) Loans on Dwellings For 5+ Families
F) Non-occupant Loans on < 5 Family Dwellings (A B C & D)
G) Loans On Manufactured Home Dwelling (A B C & D)
Number
Average Value
Number
Average Value
Number
Average Value
Number
Average Value
Number
Average Value
Number
Average Value
Number
Average Value
LOANS ORIGINATED
34
$131,211
73
$167,234
156
$138,330
43
$35,478
2
$1,280,965
20
$170,761
2
$27,675
APPLICATIONS APPROVED, NOT ACCEPTED
3
$148,957
3
$86,960
34
$158,444
5
$50,870
0
$0
0
$0
0
$0
APPLICATIONS DENIED
8
$95,142
9
$142,389
142
$125,380
51
$28,089
0
$0
5
$105,946
1
$42,090
APPLICATIONS WITHDRAWN
4
$132,998
8
$205,619
50
$143,394
1
$74,830
0
$0
2
$187,355
0
$0
FILES CLOSED FOR INCOMPLETENESS
1
$146,350
7
$167,731
16
$166,679
0
$0
0
$0
1
$77,640
0
$0
Aggregated Statistics For Year 2007 (Based on 2 full and 6 partial tracts)
A) FHA, FSA/RHS & VA Home Purchase Loans
B) Conventional Home Purchase Loans
C) Refinancings
D) Home Improvement Loans
E) Loans on Dwellings For 5+ Families
F) Non-occupant Loans on < 5 Family Dwellings (A B C & D)
G) Loans On Manufactured Home Dwelling (A B C & D)
Number
Average Value
Number
Average Value
Number
Average Value
Number
Average Value
Number
Average Value
Number
Average Value
Number
Average Value
LOANS ORIGINATED
12
$142,788
125
$146,641
210
$121,731
85
$46,808
0
$0
23
$113,470
3
$60,213
APPLICATIONS APPROVED, NOT ACCEPTED
0
$0
15
$150,951
34
$134,630
17
$43,262
1
$1,272,600
5
$42,992
0
$0
APPLICATIONS DENIED
2
$136,100
25
$122,690
187
$127,582
50
$41,574
0
$0
6
$124,213
4
$20,010
APPLICATIONS WITHDRAWN
3
$135,407
19
$88,655
76
$114,767
8
$17,681
0
$0
6
$100,110
0
$0
FILES CLOSED FOR INCOMPLETENESS
0
$0
13
$110,439
24
$123,037
1
$231,980
0
$0
1
$137,440
0
$0
Aggregated Statistics For Year 2006 (Based on 2 full and 6 partial tracts)
A) FHA, FSA/RHS & VA Home Purchase Loans
B) Conventional Home Purchase Loans
C) Refinancings
D) Home Improvement Loans
E) Loans on Dwellings For 5+ Families
F) Non-occupant Loans on < 5 Family Dwellings (A B C & D)
G) Loans On Manufactured Home Dwelling (A B C & D)
Number
Average Value
Number
Average Value
Number
Average Value
Number
Average Value
Number
Average Value
Number
Average Value
Number
Average Value
LOANS ORIGINATED
15
$127,598
187
$119,880
282
$125,679
87
$31,659
0
$0
23
$132,853
0
$0
APPLICATIONS APPROVED, NOT ACCEPTED
0
$0
28
$97,187
44
$100,185
15
$27,838
0
$0
3
$65,327
0
$0
APPLICATIONS DENIED
0
$0
43
$118,732
174
$115,866
49
$40,326
0
$0
6
$89,862
4
$44,302
APPLICATIONS WITHDRAWN
1
$162,890
20
$93,847
99
$122,876
11
$76,616
1
$1,399,860
3
$61,083
0
$0
FILES CLOSED FOR INCOMPLETENESS
0
$0
16
$138,205
25
$135,561
1
$70,160
0
$0
1
$187,080
0
$0
Aggregated Statistics For Year 2005 (Based on 2 full and 6 partial tracts)
A) FHA, FSA/RHS & VA Home Purchase Loans
B) Conventional Home Purchase Loans
C) Refinancings
D) Home Improvement Loans
F) Non-occupant Loans on < 5 Family Dwellings (A B C & D)
G) Loans On Manufactured Home Dwelling (A B C & D)
Number
Average Value
Number
Average Value
Number
Average Value
Number
Average Value
Number
Average Value
Number
Average Value
LOANS ORIGINATED
8
$114,756
213
$124,188
310
$125,043
73
$40,724
33
$128,696
2
$25,465
APPLICATIONS APPROVED, NOT ACCEPTED
2
$169,165
31
$146,719
58
$116,039
12
$23,316
1
$112,250
0
$0
APPLICATIONS DENIED
3
$114,110
46
$89,093
219
$129,622
53
$45,113
13
$98,743
2
$65,485
APPLICATIONS WITHDRAWN
0
$0
23
$118,941
100
$119,034
15
$90,599
3
$69,910
0
$0
FILES CLOSED FOR INCOMPLETENESS
0
$0
0
$0
52
$130,737
1
$28,060
2
$88,955
0
$0
Aggregated Statistics For Year 2004 (Based on 2 full and 6 partial tracts)
A) FHA, FSA/RHS & VA Home Purchase Loans
B) Conventional Home Purchase Loans
C) Refinancings
D) Home Improvement Loans
E) Loans on Dwellings For 5+ Families
F) Non-occupant Loans on < 5 Family Dwellings (A B C & D)
G) Loans On Manufactured Home Dwelling (A B C & D)
Number
Average Value
Number
Average Value
Number
Average Value
Number
Average Value
Number
Average Value
Number
Average Value
Number
Average Value
LOANS ORIGINATED
29
$129,840
159
$131,858
393
$119,112
57
$26,141
1
$3,436,020
31
$102,684
2
$6,365
APPLICATIONS APPROVED, NOT ACCEPTED
1
$173,070
26
$124,246
55
$103,138
10
$52,052
0
$0
0
$0
1
$15,900
APPLICATIONS DENIED
0
$0
27
$105,313
194
$113,381
54
$38,115
0
$0
7
$177,204
2
$24,710
APPLICATIONS WITHDRAWN
0
$0
20
$126,647
93
$113,131
12
$85,583
0
$0
6
$85,908
0
$0
FILES CLOSED FOR INCOMPLETENESS
0
$0
4
$84,798
94
$148,484
5
$47,220
0
$0
5
$188,286
0
$0
Aggregated Statistics For Year 2003 (Based on 2 full and 6 partial tracts)
A) FHA, FSA/RHS & VA Home Purchase Loans
B) Conventional Home Purchase Loans
C) Refinancings
D) Home Improvement Loans
E) Loans on Dwellings For 5+ Families
F) Non-occupant Loans on < 5 Family Dwellings (A B C & D)
Number
Average Value
Number
Average Value
Number
Average Value
Number
Average Value
Number
Average Value
Number
Average Value
LOANS ORIGINATED
39
$114,333
158
$126,778
757
$128,043
66
$31,894
2
$2,372,160
20
$89,722
APPLICATIONS APPROVED, NOT ACCEPTED
2
$119,660
23
$88,855
65
$110,208
9
$39,831
0
$0
1
$139,990
APPLICATIONS DENIED
1
$213,800
28
$112,231
257
$95,859
23
$14,887
0
$0
5
$103,826
APPLICATIONS WITHDRAWN
0
$0
16
$94,565
161
$112,470
7
$34,306
0
$0
3
$89,650
FILES CLOSED FOR INCOMPLETENESS
1
$106,640
4
$128,300
32
$155,991
2
$14,825
0
$0
0
$0
Aggregated Statistics For Year 2002 (Based on 6 partial tracts)
A) FHA, FSA/RHS & VA Home Purchase Loans
B) Conventional Home Purchase Loans
C) Refinancings
D) Home Improvement Loans
E) Loans on Dwellings For 5+ Families
F) Non-occupant Loans on < 5 Family Dwellings (A B C & D)
Number
Average Value
Number
Average Value
Number
Average Value
Number
Average Value
Number
Average Value
Number
Average Value
LOANS ORIGINATED
27
$99,979
104
$128,992
408
$126,122
68
$19,431
1
$175,620
22
$93,510
APPLICATIONS APPROVED, NOT ACCEPTED
0
$0
15
$75,191
51
$117,030
10
$22,305
0
$0
0
$0
APPLICATIONS DENIED
0
$0
8
$81,886
106
$103,854
33
$28,111
0
$0
0
$0
APPLICATIONS WITHDRAWN
2
$113,690
10
$92,725
136
$113,011
11
$33,258
0
$0
1
$95,440
FILES CLOSED FOR INCOMPLETENESS
0
$0
1
$26,720
31
$103,645
0
$0
0
$0
0
$0
Aggregated Statistics For Year 2001 (Based on 6 partial tracts)
A) FHA, FSA/RHS & VA Home Purchase Loans
B) Conventional Home Purchase Loans
C) Refinancings
D) Home Improvement Loans
F) Non-occupant Loans on < 5 Family Dwellings (A B C & D)
Number
Average Value
Number
Average Value
Number
Average Value
Number
Average Value
Number
Average Value
LOANS ORIGINATED
28
$105,217
100
$116,702
293
$109,671
65
$19,122
17
$74,318
APPLICATIONS APPROVED, NOT ACCEPTED
0
$0
21
$79,952
35
$133,762
16
$35,834
3
$30,917
APPLICATIONS DENIED
0
$0
22
$57,521
122
$91,530
34
$22,164
0
$0
APPLICATIONS WITHDRAWN
3
$153,440
9
$107,606
82
$100,544
10
$14,571
0
$0
FILES CLOSED FOR INCOMPLETENESS
0
$0
1
$86,540
27
$119,207
2
$45,475
0
$0
Aggregated Statistics For Year 2000 (Based on 6 partial tracts)
A) FHA, FSA/RHS & VA Home Purchase Loans
B) Conventional Home Purchase Loans
C) Refinancings
D) Home Improvement Loans
F) Non-occupant Loans on < 5 Family Dwellings (A B C & D)
Number
Average Value
Number
Average Value
Number
Average Value
Number
Average Value
Number
Average Value
LOANS ORIGINATED
37
$86,005
95
$113,858
125
$91,850
91
$21,349
15
$82,335
APPLICATIONS APPROVED, NOT ACCEPTED
0
$0
16
$87,195
40
$65,235
13
$26,552
0
$0
APPLICATIONS DENIED
3
$82,753
24
$148,302
80
$80,072
31
$23,036
4
$53,202
APPLICATIONS WITHDRAWN
3
$75,250
6
$135,627
41
$99,527
2
$13,830
1
$145,080
FILES CLOSED FOR INCOMPLETENESS
0
$0
4
$211,182
35
$92,439
0
$0
0
$0
Aggregated Statistics For Year 1999 (Based on 4 partial tracts)
A) FHA, FSA/RHS & VA Home Purchase Loans
B) Conventional Home Purchase Loans
C) Refinancings
D) Home Improvement Loans
E) Loans on Dwellings For 5+ Families
F) Non-occupant Loans on < 5 Family Dwellings (A B C & D)
2002 - 2018 National Fire Incident Reporting System (NFIRS) incidents
According to the data from the years 2002 - 2018 the average number of fire incidents per year is 16. The highest number of reported fires - 24 took place in 2002, and the least - 9 in 2013. The data has a decreasing trend.
When looking into fire subcategories, the most incidents belonged to: Structure Fires (45.5%), and Outside Fires (33.7%).
Fire incident types reported to NFIRS in Zip Code 68152


 Nearest zip codes: 68112, 68122, 68104, 68023, 68111, 68134.
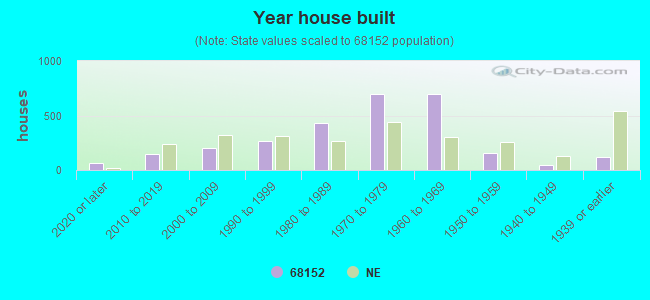


 According to the data from the years 2002 - 2018 the average number of fire incidents per year is 16. The highest number of reported fires - 24 took place in 2002, and the least - 9 in 2013. The data has a decreasing trend.
 When looking into fire subcategories, the most incidents belonged to: Structure Fires (45.5%), and Outside Fires (33.7%).