Races in North Beach, Maryland (MD) Detailed Stats
Ancestries, Foreign-born residents, place of birth
Settings
X


Recent posts about races in North Beach, Maryland on our local forum with over 2,400,000 registered users:
 | Bully breeds in PG County (32 replies) |
| What's the story with the white people in Prince George County? :) (192 replies) |
| Wealthiest Black Majority County is Charles County (68 replies) |
| Job Offer in Montgomery County (12 replies) |
| Where Are The Rich African Americans at National Harbor? (41 replies) |
| Will Charles County become another Prince George's County? (183 replies) |
According to 2022 data, the most numerous races in North Beach, MD are White alone (1,573 residents), Black alone (467 residents), and Hispanic (147 residents). 90.5% of North Beach residents speak English at home. 7.9% of North Beach, MD residents are foreign-born (3.6% born in Asia, 2.8% born in Europe, 0.9% born in Latin America), which is 101.6% less than the foreign-born rate of 16.0% across the entire state of Maryland.
Race distribution in North Beach
2000
2022

- 1,65087.8%White alone
- 1176.2%Black alone
- 392.1%Hispanic
- 372.0%Two or more races
- 181.0%Asian alone
- 181.0%American Indian alone
- 10.05%Other race alone

-
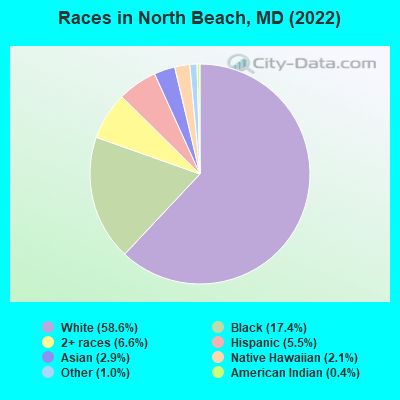
- 1,57358.6%White alone
- 46717.4%Black alone
- 1766.6%Two or more races
- 1475.5%Hispanic
- 772.9%Asian alone
- 562.1%Native Hawaiian and Other
Pacific Islander alone - 261.0%Other race alone
- 110.4%American Indian alone
2000
2022
-
- 3,286,54762.1%White alone
- 1,464,73527.7%Black alone
- 227,9164.3%Hispanic
- 209,7384.0%Asian alone
- 82,9461.6%Two or more races
- 13,3120.3%American Indian alone
- 9,3790.2%Other race alone
- 1,9130.04%Native Hawaiian and Other
Pacific Islander alone

-
- 2,906,49247.1%White alone
- 1,800,91429.2%Black alone
- 705,84211.4%Hispanic
- 401,8186.5%Asian alone
- 291,3174.7%Two or more races
- 46,9300.8%Other race alone
- 8,9300.1%American Indian alone
- 2,4170.04%Native Hawaiian and Other
Pacific Islander alone

Income and house value in North Beach
- Median household income in 2022
- $70,243White non-Hispanic householders
- $86,138Black householders
- $131,921Asian householders
- Median 2022 house value
- $324,225White Non-Hispanic householders
- $338,516Black or African American householders
- $385,315American Indian or Alaska Native householders
- $385,315Some other race householders
- $288,916Two or more races householders
- $385,315Hispanic or Latino householders
Household income for White non-Hispanic householders

Household income for Black householders

Household income for American Indian and Alaska Native householders

Household income for Asian householders

Household income for Some other race householders

Household income for Two or more races householders

Household income for Hispanic or Latino race householders

Median age by race in North Beach
- 39.7Median age for White residents
- 31.4Males
- 49.5Females
- 18.1Median age for Black or African American residents
- 16.9Males
- 19.4Females
- -527,162,977.3Median age for American Indian / Alaska Native residents
- -670,798,897.4Males
- -432,989,690.3Females
- 21.7Median age for Asian residents
- 24.2Males
- 19.9Females
- 18.2Median age for Native Hawaiian / Pacific Islander residents
- -720,061,021.4Males
- 15.5Females
- 23.5Median age for Other race residents
- 23.4Males
- -737,899,542.6Females
- 35.1Median age for Two or more races residents
- 33.4Males
- 45.0Females
- 39.7Median age for White alone residents
- 31.3Males
- 48.9Females
- 33.4Median age for Hispanic or Latino residents
- 31.8Males
- 31.8Females
Owner/renter occupied households by race in North Beach
- House owners and renters - White residents
- 47568.0%Owner occupied
- 22432.0%Renter occupied
- House owners and renters - Black or African American residents
- 2536.4%Owner occupied
- 4363.6%Renter occupied
- House owners and renters - American Indian / Alaska Native residents
- 746.9%Owner occupied
- 853.1%Renter occupied
- House owners and renters - Asian residents
- 513.1%Owner occupied
- 3686.9%Renter occupied
- House owners and renters - Native Hawaiian / Pacific Islander residents
- 11100.0%Renter occupied
- House owners and renters - Other race residents
- 952.8%Owner occupied
- 847.2%Renter occupied
- House owners and renters - Two or more races residents
- 7277.5%Owner occupied
- 2122.5%Renter occupied
- House owners and renters - White alone residents
- 47770.0%Owner occupied
- 20430.0%Renter occupied
- House owners and renters - Hispanic or Latino residents
- 3032.4%Owner occupied
- 6267.6%Renter occupied
Language usage in North Beach
- English speakers - Total
- 90.5% of residents of North Beach speak English at home.
- 2.3% of residents speak Spanish at home
- 3662.1%Speak English very well
- 2237.9%Speak English less than very well
- 6.6% of residents speak other language at home
- 13579.9%Speak English very well
- 3420.1%Speak English less than very well
- English speakers - Born in the United States
- 99.3% of residents of North Beach speak English at home.
- 0.2% of residents speak Spanish at home
- 3100.0%Speak English less than very well
- English speakers - Native, born elsewhere
- 60.0% of residents of North Beach speak English at home.
- 40.0% of residents speak Spanish at home
- 16100.0%Speak English very well
- English speakers - Foreign-born
- 14.6% of residents of North Beach speak English at home.
- 4.7% of residents speak Spanish at home
- 660.0%Speak English very well
- 440.0%Speak English less than very well
- 79.8% of residents speak other language at home
- 13780.6%Speak English very well
- 3319.4%Speak English less than very well
White (Caucasian) - Speak only English
| Native: | 99.6% (1,527) |
| Foreign-born: | 60.7% (9) |
White (Caucasian) - Speak another language
| Native: | 0.8% (12) |
| Foreign-born: | 38.6% (5) |
Black or African American - Speak only English
| Native: | 99.7% (550) |
| Foreign-born: | 96.8% (6) |
Asian - Speak only English
| Native: | 97.1% (25) |
| Foreign-born: | 12.2% (20) |
Other race - Speak another language
| Native: | 67.5% (16) |
| Foreign-born: | 100.0% (9) |
Two or more races - Speak another language
| Native: | 7.4% (12) |
| Foreign-born: | 100.0% (24) |
White alone - Speak only English
| Native: | 98.7% (1,492) |
| Foreign-born: | 56.5% (8) |
White alone - Speak another language
| Native: | 1.3% (20) |
| Foreign-born: | 43.4% (6) |
Hispanic or Latino - Speak another language
| Native: | 5.7% (7) |
| Foreign-born: | 84.9% (15) |
Foreign-born residents in North Beach
213 residents are foreign born (3.6% Asia, 2.8% Europe, 0.9% Latin America).
| This city: | 7.9% |
| Maryland: | 15.7% |


Marital status for residents in North Beach
Marital status - White (Caucasian) population 15 years and over
- Males
- 50.4%Never married
- 31.7%Now married
- 0.0%Separated
- 6.1%Widowed
- 11.8%Divorced
- Females
- 23.8%Never married
- 31.7%Now married
- 3.5%Separated
- 12.7%Widowed
- 28.3%Divorced
Women who gave birth in the past 12 months
| Now married: | 0.0% (0) |
| Unmarried: | 100.0% (14) |
Women who did not give birth in the past 12 months
| Now married: | 45.9% (134) |
| Unmarried: | 54.1% (158) |
Marital status - Black or African American population 15 years and over
- Males
- 74.0%Never married
- 17.3%Now married
- 0.0%Separated
- 2.9%Widowed
- 5.8%Divorced
- Females
- 54.9%Never married
- 6.2%Now married
- 0.0%Separated
- 29.2%Widowed
- 9.7%Divorced
Women who did not give birth in the past 12 months
| Now married: | 0.0% (0) |
| Unmarried: | 100.0% (166) |
Marital status - American Indian / Alaska Native population 15 years and over
- Males
- 0.0%Never married
- 0.0%Now married
- 0.0%Separated
- 100.0%Widowed
- 0.0%Divorced
- Females
- 0.0%Never married
- 0.0%Now married
- 0.0%Separated
- 0.0%Widowed
- 100.0%Divorced
Marital status - Asian population 15 years and over
- Males
- 0.0%Never married
- 100.0%Now married
- 0.0%Separated
- 0.0%Widowed
- 0.0%Divorced
- Females
- 47.2%Never married
- 33.7%Now married
- 0.0%Separated
- 19.1%Widowed
- 0.0%Divorced
Women who did not give birth in the past 12 months
| Now married: | 41.7% (30) |
| Unmarried: | 58.3% (42) |
Marital status - Native Hawaiian / Pacific Islander population 15 years and over
- Males
- 50.0%Never married
- 50.0%Now married
- 0.0%Separated
- 0.0%Widowed
- 0.0%Divorced
- Females
- 52.6%Never married
- 47.4%Now married
- 0.0%Separated
- 0.0%Widowed
- 0.0%Divorced
Women who did not give birth in the past 12 months
| Now married: | 47.4% (9) |
| Unmarried: | 52.6% (11) |
Marital status - Other race population 15 years and over
- Males
- 0.0%Never married
- 100.0%Now married
- 0.0%Separated
- 0.0%Widowed
- 0.0%Divorced
- Females
- 50.0%Never married
- 50.0%Now married
- 0.0%Separated
- 0.0%Widowed
- 0.0%Divorced
Women who did not give birth in the past 12 months
| Now married: | 50.0% (9) |
| Unmarried: | 50.0% (9) |
Marital status - Two or more races population 15 years and over
- Males
- 9.1%Never married
- 90.9%Now married
- 0.0%Separated
- 0.0%Widowed
- 0.0%Divorced
- Females
- 39.8%Never married
- 23.5%Now married
- 0.0%Separated
- 17.3%Widowed
- 19.4%Divorced
Women who gave birth in the past 12 months
| Now married: | 0.0% (0) |
| Unmarried: | 100.0% (12) |
Women who did not give birth in the past 12 months
| Now married: | 27.1% (19) |
| Unmarried: | 72.9% (52) |
Marital status - White alone, not Hispanic / Latino population 15 years and over
- Males
- 50.9%Never married
- 32.0%Now married
- 0.0%Separated
- 6.2%Widowed
- 10.9%Divorced
- Females
- 24.5%Never married
- 32.5%Now married
- 0.9%Separated
- 13.1%Widowed
- 29.1%Divorced
Women who gave birth in the past 12 months
| Now married: | 0.0% (0) |
| Unmarried: | 100.0% (14) |
Women who did not give birth in the past 12 months
| Now married: | 42.1% (112) |
| Unmarried: | 57.9% (155) |
Marital status - Hispanic or Latino population 15 years and over
- Males
- 6.5%Never married
- 80.4%Now married
- 0.0%Separated
- 0.0%Widowed
- 13.0%Divorced
- Females
- 40.6%Never married
- 23.2%Now married
- 27.5%Separated
- 0.0%Widowed
- 8.7%Divorced
Women who did not give birth in the past 12 months
| Now married: | 55.6% (37) |
| Unmarried: | 44.4% (30) |
Ancestries in North Beach

- 1168.4%German
- 1118.0%Irish
- 785.6%English
- 695.0%American
- 634.6%Italian
- 453.3%European
- 201.4%Polish
- 181.3%Scottish
- 90.7%Portuguese
- 80.6%Ghanaian
- 80.6%African
- 70.5%British
- 70.5%Czech
- 60.4%Latvian
- 50.4%Welsh
- 40.3%Northern European
- 40.3%Russian
- 10.07%Belizean

Geographical mobility in North Beach

- Same house 1 year ago
- 1,21776.7%White (Caucasian)
- 34876.4%Black or African American
- 1698.9%American Indian / Alaska Native
- 3820.5%Asian
- 53100.0%Native Hawaiian / Pacific Islander
- 41100.0%Other race
- 17685.0%Two or more races
- 1,22778.4%White alone, not Hispanic / Latino
- 10878.8%Hispanic or Latino

-
- Moved within same county
- 16410.3%White / Caucasian
- 5010.9%Black or African American
- 14476.8%Asian
- 1298.3%White alone, not Hispanic / Latino
- 1913.7%Hispanic or Latino

-
- Moved within same state
- 1298.1%White / Caucasian
- 9220.2%Black or African American
- 1328.4%White alone, not Hispanic / Latino

-
- Moved from different state
- 593.7%White / Caucasian
- 40.9%Black or African American
- 2612.5%Two or more races
- 573.6%White alone, not Hispanic / Latino
- 53.5%Hispanic or Latino

-
- Moved from abroad
- 1006.3%White
- 1066.8%White alone, not Hispanic / Latino

Children Nativity (place of birth) in North Beach
Place of birth for residents in North Beach
![Place of birth for the foreign-born population - Regions]()
- 101Asia
- 83South Central Asia
- 79Europe
- 70Southern Europe
- 26Americas
- 26Latin America
- 25South America
- 11Eastern Asia
- 6South Eastern Asia
- 5Western Europe
- 5Africa
- 5Western Africa
- 4Eastern Europe
- 1Central America

![Place of birth for the foreign-born population - Countries]()
- 83Pakistan
- 70Italy
- 13Brazil
- 11Japan
- 7Peru
- 6Singapore
- 5Germany
- 5Ghana
- 4Ecuador
- 3Poland
- 1Russia
- 1Belize

Grandparents responsible for own grandchildren in North Beach
Zip codes: 20714.