Estimated zip code population in 2022: 4,769 Zip code population in 2010: 4,345 Zip code population in 2000: 4,008
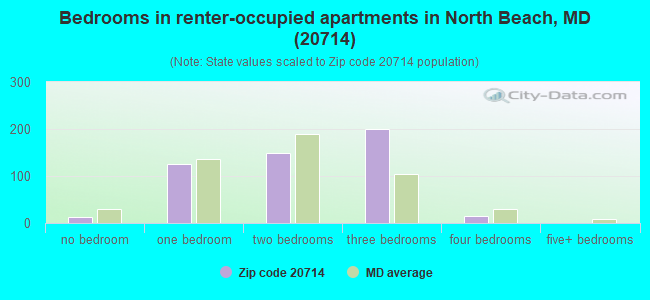
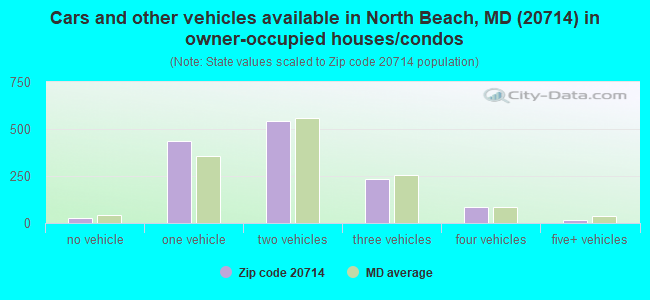
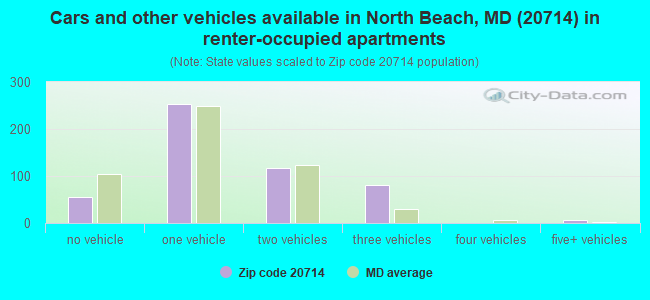
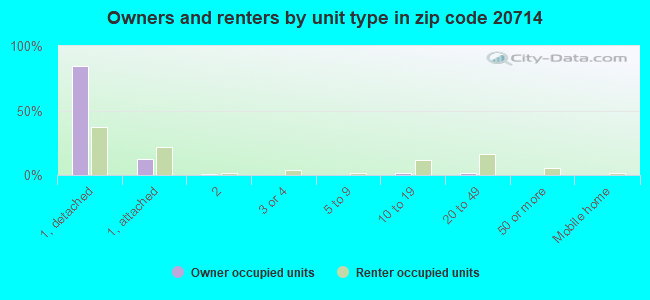
Houses and condos: 1,975 Renter-occupied apartments: 508
% of renters here:
28%
State:
32%
March 2022 cost of living index in zip code 20714: 107.7 (more than average, U.S. average is 100)
Land area: 2.3 sq. mi. Water area: 1.8 sq. mi.
Population density: 2,046 people per square mile
(low).
OSM Map
General Map
Google Map
MSN Map
OSM Map
General Map
Google Map
MSN Map
OSM Map
General Map
Google Map
MSN Map
OSM Map
General Map
Google Map
MSN Map
Please wait while loading the map...
Real estate property taxes paid for housing units in 2022:
This zip code:
0.9% ($3,169)
Maryland:
0.9% ($3,777)
Median real estate property taxes paid for housing units with mortgages in 2022: $3,135 (0.9%) Median real estate property taxes paid for housing units with no mortgage in 2022: $3,556 (1.1%)
Business Search- 14 Million verified businesses
Males: 2,333
(48.9%)
Females: 2,435
(51.1%)
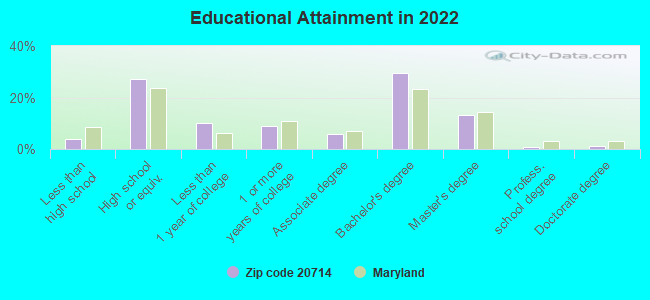
For population 25 years and over in 20714:
High school or higher: 96.5%
Bachelor's degree or higher: 44.6%
Graduate or professional degree: 15.0%
Unemployed: 9.7%
Mean travel time to work (commute): 39.3 minutes
For population 15 years and over in 20714:
Never married: 35.5%
Now married: 40.4%
Separated: 0.8%
Widowed: 6.9%
Divorced: 16.5%
Zip code 20714 compared to state average:
Unemployed percentage above state average.
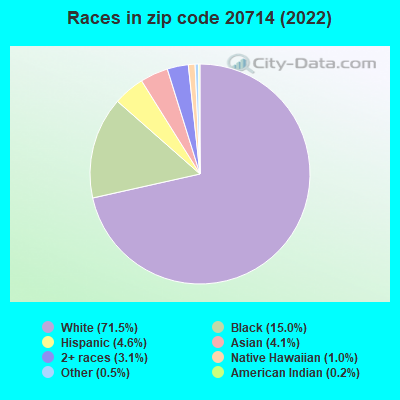
Black race population percentage below state average.
Hispanic race population percentage below state average.
Median age below state average.
Foreign-born population percentage significantly below state average.
Length of stay since moving in below state average.
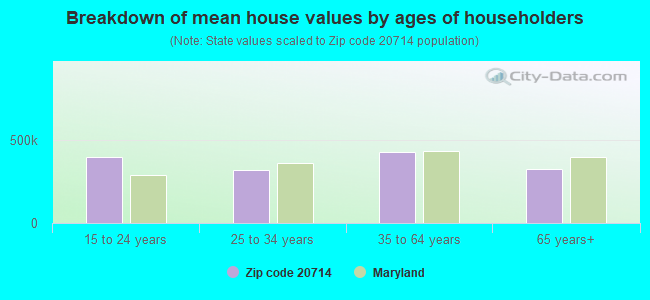
Estimated median house/condo value in 2022: $355,936
20714:
$355,936
Maryland:
$398,100
According to our research of Maryland and other state lists, there were 6 registered sex offenders living in 20714 zip code as of May 26, 2024. The ratio of all residents to sex offenders in zip code 20714 is 807 to 1. The ratio of registered sex offenders to all residents in this zip code is near the state average.
Median resident age:
This zip code:
35.2 years
Maryland median age:
39.7 years
Average household size:
This zip code:
2.6 people
Maryland:
2.5 people
Averages for the 2020 tax year for zip code 20714, filed in 2021:
Average Adjusted Gross Income (AGI) in 2020: $76,073 (Individual Income Tax Returns)
Here:
$76,073
State:
$86,905
Salary/wage: $70,836 (reported on 82.1% of returns)
Here:
$70,836
State:
$73,953
(% of AGI for various income ranges: 1103.2% for AGIs below $25k, 3547.4% for AGIs $25k-50k, 6281.4% for AGIs $50k-75k, 9419.1% for AGIs $75k-100k, 17666.6% for AGIs $100k-200k, 82950.0% for AGIs over 200k)
Taxable interest for individuals: $740 (reported on 34.2% of returns)
This zip code:
$740
Maryland:
$1,528
(% of AGI for various income ranges: 10.8% for AGIs below $25k, 11.0% for AGIs $25k-50k, 31.0% for AGIs $50k-75k, 20.4% for AGIs $75k-100k, 71.9% for AGIs $100k-200k, 513.3% for AGIs over 200k)
Ordinary dividends: $3,248 (reported on 17.5% of returns)
Here:
$3,248
State:
$8,028
(% of AGI for various income ranges: 27.5% for AGIs below $25k, 23.3% for AGIs $25k-50k, 47.9% for AGIs $50k-75k, 103.5% for AGIs $75k-100k, 126.2% for AGIs $100k-200k, 1273.3% for AGIs over 200k)
Net capital gain/loss in AGI: +$8,958 (reported on 15.8% of returns)
Here:
+$8,958
State:
+$25,238
(% of AGI for various income ranges: 16.2% for AGIs $25k-50k, 19.3% for AGIs $50k-75k, 53.9% for AGIs $75k-100k, 150.0% for AGIs $100k-200k, 8946.7% for AGIs over 200k)
Profit/loss from business: +$8,716 (reported on 13.3% of returns)
Here:
+$8,716
State:
+$11,398
(% of AGI for various income ranges: 68.5% for AGIs below $25k, 80.0% for AGIs $25k-50k, 142.1% for AGIs $50k-75k, 30.0% for AGIs $75k-100k, 343.4% for AGIs $100k-200k, 2076.7% for AGIs over 200k)
Taxable individual retirement arrangement distribution: $12,879 (reported on 7.9% of returns)
20714:
$12,879
Maryland:
$20,944
(% of AGI for various income ranges: 50.5% for AGIs below $25k, 86.9% for AGIs $25k-50k, 84.8% for AGIs $50k-75k, 185.7% for AGIs $75k-100k, 385.3% for AGIs $100k-200k)
Total itemized deductions: $24,085 (reported on 22.9% of returns)
Here:
$24,085
State:
$30,672
(% of AGI for various income ranges: 277.2% for AGIs $25k-50k, 709.7% for AGIs $50k-75k, 1150.9% for AGIs $75k-100k, 1740.0% for AGIs $100k-200k, 6310.0% for AGIs over 200k)
Charity contributions: $4,914 (reported on 17.9% of returns)
Here:
$4,914
State:
$9,065
(% of AGI for various income ranges: 43.1% for AGIs $25k-50k, 120.7% for AGIs $50k-75k, 129.6% for AGIs $75k-100k, 326.9% for AGIs $100k-200k, 836.7% for AGIs over 200k)
Taxes paid: $8,383 (reported on 22.5% of returns)
20714:
$8,383
State:
$8,475
(% of AGI for various income ranges: 62.8% for AGIs $25k-50k, 225.9% for AGIs $50k-75k, 451.3% for AGIs $75k-100k, 615.9% for AGIs $100k-200k, 2060.0% for AGIs over 200k)
Earned income credit: $1,900 (reported on 10.0% of returns)
Here:
$1,900
State:
$2,151
(% of AGI for various income ranges: 67.2% for AGIs below $25k, 47.9% for AGIs $25k-50k)
Percentage of individuals using paid preparers for their 2020 taxes: 92.9%
Here:
93%
State:
90%
(% for various income ranges: 92.7% for AGIs below $25k, 91.8% for AGIs $25k-50k, 92.7% for AGIs $50k-75k, 93.8% for AGIs $75k-100k, 94.2% for AGIs $100k-200k, 90.9% for AGIs over 200k)
Averages for the 2012 tax year for zip code 20714, filed in 2013:
Average Adjusted Gross Income (AGI) in 2012: $62,791 (Individual Income Tax Returns)
Here:
$62,791
State:
$72,703
Salary/wage: $58,165 (reported on 86.9% of returns)
Here:
$58,165
State:
$62,228
(% of AGI for various income ranges: 76.3% for AGIs below $25k, 81.3% for AGIs $25k-50k, 82.8% for AGIs $50k-75k, 82.4% for AGIs $75k-100k, 82.8% for AGIs $100k-200k, 66.5% for AGIs over 200k)
Taxable interest for individuals: $477 (reported on 38.7% of returns)
This zip code:
$477
Maryland:
$1,413
(% of AGI for various income ranges: 0.6% for AGIs below $25k, 0.3% for AGIs $25k-50k, 0.2% for AGIs $50k-75k, 0.3% for AGIs $75k-100k, 0.3% for AGIs $100k-200k, 0.2% for AGIs over 200k)
Ordinary dividends: $2,106 (reported on 14.4% of returns)
Here:
$2,106
State:
$6,933
(% of AGI for various income ranges: 0.8% for AGIs below $25k, 0.5% for AGIs $25k-50k, 0.3% for AGIs $50k-75k, 0.3% for AGIs $75k-100k, 0.6% for AGIs $100k-200k, 0.5% for AGIs over 200k)
Net capital gain/loss in AGI: +$2,896 (reported on 10.4% of returns)
Here:
+$2,896
State:
+$14,830
(% of AGI for various income ranges: 1.5% for AGIs $100k-200k)
Profit/loss from business: +$6,621 (reported on 12.6% of returns)
Here:
+$6,621
State:
+$12,606
(% of AGI for various income ranges: 4.0% for AGIs below $25k, 0.8% for AGIs $25k-50k, 1.0% for AGIs $50k-75k, 1.7% for AGIs $75k-100k, 1.5% for AGIs $100k-200k)
Taxable individual retirement arrangement distribution: $16,683 (reported on 8.1% of returns)
20714:
$16,683
Maryland:
$17,065
(% of AGI for various income ranges: 2.7% for AGIs below $25k, 1.6% for AGIs $25k-50k, 1.6% for AGIs $50k-75k, 2.2% for AGIs $75k-100k, 3.3% for AGIs $100k-200k)
Total itemized deductions: $22,845 (25% of AGI, reported on 50.9% of returns)
Here:
$22,845
State:
$27,886
Here:
25.2% of AGI
State:
22.8% of AGI
(% of AGI for various income ranges: 15.8% for AGIs below $25k, 14.4% for AGIs $25k-50k, 18.0% for AGIs $50k-75k, 19.1% for AGIs $75k-100k, 20.4% for AGIs $100k-200k, 19.1% for AGIs over 200k)
Charity contributions: $2,578 (reported on 39.2% of returns)
Here:
$2,578
State:
$4,452
(% of AGI for various income ranges: 0.7% for AGIs below $25k, 1.2% for AGIs $25k-50k, 1.8% for AGIs $50k-75k, 1.9% for AGIs $75k-100k, 1.7% for AGIs $100k-200k, 1.4% for AGIs over 200k)
Taxes paid: $8,850 (reported on 50.5% of returns)
20714:
$8,850
State:
$11,690
(% of AGI for various income ranges: 3.6% for AGIs below $25k, 4.2% for AGIs $25k-50k, 6.5% for AGIs $50k-75k, 7.1% for AGIs $75k-100k, 8.6% for AGIs $100k-200k, 9.0% for AGIs over 200k)
Earned income credit: $1,988 (reported on 11.7% of returns)
Here:
$1,988
State:
$2,199
(% of AGI for various income ranges: 4.6% for AGIs below $25k, 0.9% for AGIs $25k-50k)
Percentage of individuals using paid preparers for their 2012 taxes: 46.8%
Here:
47%
State:
52%
(% for various income ranges: 43.1% for AGIs below $25k, 43.4% for AGIs $25k-50k, 50.0% for AGIs $50k-75k, 48.4% for AGIs $75k-100k, 50.0% for AGIs $100k-200k, 75.0% for AGIs over 200k)
Averages for the 2004 tax year for zip code 20714, filed in 2005:
Average Adjusted Gross Income (AGI) in 2004: $48,034 (Individual Income Tax Returns)
Here:
$48,034
State:
$60,339
Salary/wage: $45,234 (reported on 89.0% of returns)
Here:
$45,234
State:
$52,211
(% of AGI for various income ranges: 86.6% for AGIs below $10k, 82.4% for AGIs $10k-25k, 87.6% for AGIs $25k-50k, 87.5% for AGIs $50k-75k, 88.9% for AGIs $75k-100k, 72.4% for AGIs over 100k)
Taxable interest for individuals: $607 (reported on 44.1% of returns)
This zip code:
$607
Maryland:
$1,701
(% of AGI for various income ranges: 2.2% for AGIs below $10k, 1.7% for AGIs $10k-25k, 0.5% for AGIs $25k-50k, 0.5% for AGIs $50k-75k, 0.2% for AGIs $75k-100k, 0.6% for AGIs over 100k)
Taxable dividends: $1,389 (reported on 16.2% of returns)
Here:
$1,389
State:
$4,235
(% of AGI for various income ranges: 2.7% for AGIs below $10k, 0.9% for AGIs $10k-25k, 0.5% for AGIs $25k-50k, 0.5% for AGIs $50k-75k, 0.2% for AGIs $75k-100k, 0.4% for AGIs over 100k)
Net capital gain/loss: +$4,484 (reported on 12.4% of returns)
Here:
+$4,484
State:
+$15,888
(% of AGI for various income ranges: -1.4% for AGIs below $10k, -0.3% for AGIs $10k-25k, -0.2% for AGIs $25k-50k, 0.1% for AGIs $50k-75k, 0.1% for AGIs $75k-100k, 4.9% for AGIs over 100k)
Profit/loss from business: +$5,967 (reported on 12.1% of returns)
Here:
+$5,967
State:
+$12,221
(% of AGI for various income ranges: 9.1% for AGIs below $10k, 1.8% for AGIs $10k-25k, 1.4% for AGIs $25k-50k, 0.7% for AGIs $50k-75k, 1.7% for AGIs $75k-100k, 1.9% for AGIs over 100k)
IRA payment deduction: $2,109 (reported on 2.3% of returns)
20714:
$2,109
Maryland:
$2,968
Total itemized deductions: $18,157 (27% of AGI, reported on 52.7% of returns)
Here:
$18,157
State:
$22,960
Here:
26.6% of AGI
State:
23.3% of AGI
(% of AGI for various income ranges: 14.3% for AGIs below $10k, 14.2% for AGIs $10k-25k, 18.5% for AGIs $25k-50k, 21.1% for AGIs $50k-75k, 22.2% for AGIs $75k-100k, 20.3% for AGIs over 100k)
Charity contributions deductions: $2,055 (3% of AGI, reported on 45.1% of returns)
Here:
$2,055
State:
$4,031
Here:
2.9% of AGI
State:
3.9% of AGI
(% of AGI for various income ranges: 0.9% for AGIs $10k-25k, 1.9% for AGIs $25k-50k, 2.2% for AGIs $50k-75k, 2.2% for AGIs $75k-100k, 1.9% for AGIs over 100k)
Total tax: $5,671 (reported on 83.9% of returns)
20714:
$5,671
State:
$10,167
(% of AGI for various income ranges: 2.5% for AGIs below $10k, 4.8% for AGIs $10k-25k, 7.2% for AGIs $25k-50k, 9.0% for AGIs $50k-75k, 10.7% for AGIs $75k-100k, 14.8% for AGIs over 100k)
Earned income credit: $1,446 (reported on 9.7% of returns)
Here:
$1,446
State:
$1,700
Percentage of individuals using paid preparers for their 2004 taxes: 52.0%
Here:
52%
State:
55%
(% for various income ranges: 38.3% for AGIs below $10k, 49.4% for AGIs $10k-25k, 53.4% for AGIs $25k-50k, 54.6% for AGIs $50k-75k, 54.4% for AGIs $75k-100k, 65.4% for AGIs over 100k)
Household received Food Stamps/SNAP in the past 12 months: 164 Household did not receive Food Stamps/SNAP in the past 12 months: 1,660
Women who had a birth in the past 12 months: 23 (0 now married, 22 unmarried) Women who did not have a birth in the past 12 months: 1,190 (472 now married, 717 unmarried)
Housing units in zip code 20714 with a mortgage: 1,092 (158 second mortgage, 150 both second mortgage and home equity loan) Median monthly owner costs for units with a mortgage: $1,916 Median monthly owner costs for units without a mortgage: $707
Residents with income below the poverty level in 2022:
This zip code:
3.9%
Whole state:
9.6%
Residents with income below 50% of the poverty level in 2022:
This zip code:
1.5%
Whole state:
4.7%
Median number of rooms in houses and condos:
Here:
6.4
State:
7.3
Median number of rooms in apartments:
Here:
4.6
State:
4.2
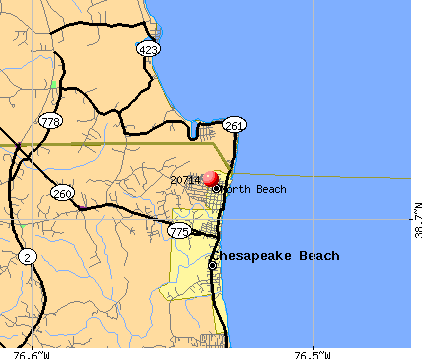
Notable locations in this zip code not listed on our city pages
Notable locations in zip code 20714: Herrington Harbour Marina (A), Rose Haven Yacht Club (B), North Beach Town Hall (C). Display/hide their locations on the map
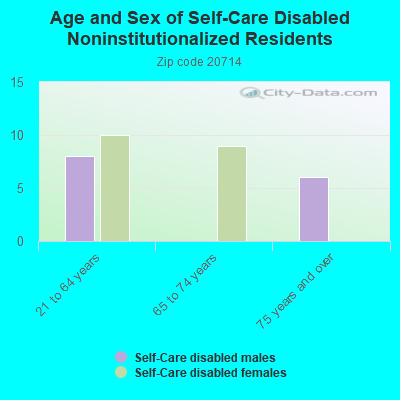
In group quarters: 4 (-1 institutionalized population)
Size of family households: 443 2-persons, 162 3-persons, 223 4-persons, 212 5-persons, 49 6-persons, 4 7-or-more-persons
Size of nonfamily households: 630 1-person, 90 2-persons, 12 3-persons
649 married couples with children.
637 single-parent households (48 men, 589 women).
91.3% of residents of 20714 zip code speak English at home.
3.5% of residents speak Spanish at home (80% very well, 18% well, 3% not well).
3.8% of residents speak other Indo-European language at home (81% very well, 19% well).
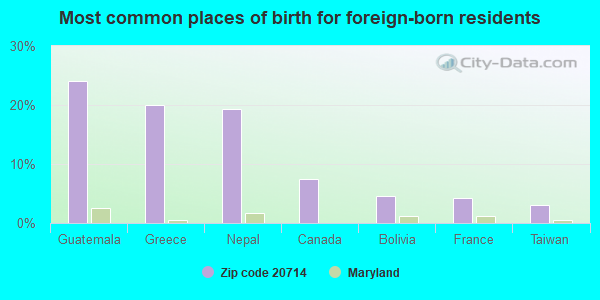
Foreign born population: 324 (6.8%) (29.0% of them are naturalized citizens)
This zip code:
6.8%
Whole state:
16.7%
24%Guatemala
20%Greece
19%Nepal
7%Canada
5%Bolivia
4%France
3%Taiwan
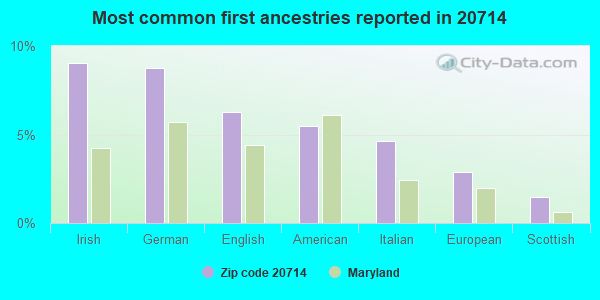
9%Irish
9%German
6%English
6%American
5%Italian
3%European
1%Scottish
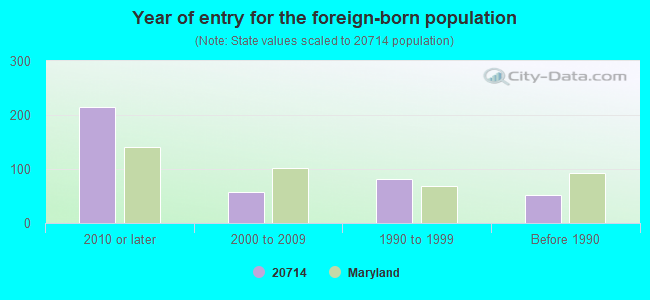
Year of entry for the foreign-born population
2142010 or later
572000 to 2009
811990 to 1999
51Before 1990
Facilities with environmental interests located in this zip code:
MOBIL 8834 CHESAPEAKE AVENUE (8834 CHESAPEAKE AVENUE in N BEACH, MD)
AIR MINOR (AIRS/AFS) STATE MASTER (Maryland Air Emissions Database) - AIR MINOR National Pollutant Discharge Elimination System NON-MAJOR (Tracking pollutant discharge elimination systems) - permit Business SIC classification: GASOLINE SERVICE STATIONS Alternative names: THE GOTT COMPANY, THE GOTT COMPANY-MOBIL STATION
Housing units lacking complete plumbing facilities: 1.6% Housing units lacking complete kitchen facilities: 1.8%
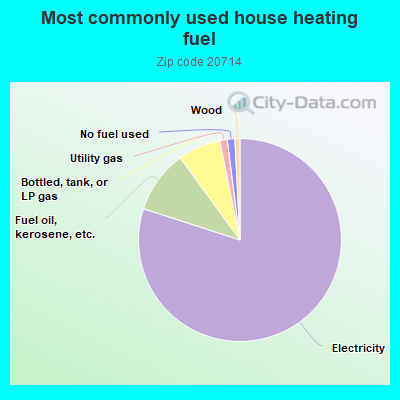
80.0%Electricity
10.0%Fuel oil, kerosene, etc.
6.8%Bottled, tank, or LP gas
1.2%Utility gas
1.2%No fuel used
0.8%Wood
Population in 1990: 2,292. Population change in the 1990s: +1,716 (+74.9%).
Place of birth for U.S.-born residents:
This state: 1,913
Northeast: 338
Midwest: 278
South: 1,663
West: 127
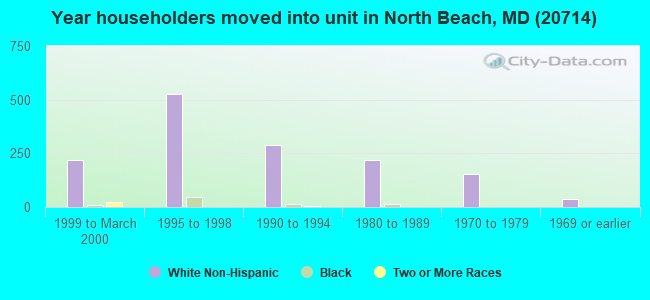
53% of the 20714 zip code residents lived in the same house 5 years ago. Out of people who lived in different houses, 40% lived in this county. Out of people who lived in different counties, 50% lived in Maryland.
84% of the 20714 zip code residents lived in the same house 1 year ago. Out of people who lived in different houses, 42% moved from this county. Out of people who lived in different houses, 18% moved from different county within same state. Out of people who lived in different houses, 29% moved from different state. Out of people who lived in different houses, 7% moved from abroad.
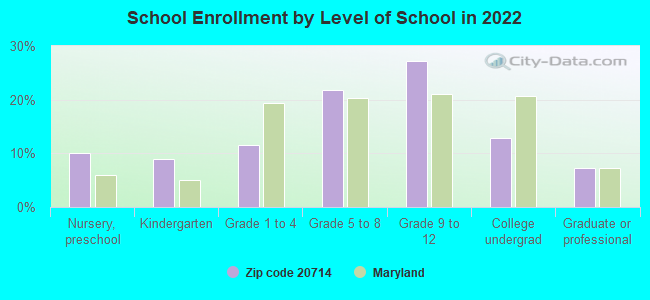
Private vs. public school enrollment:
Students in private schools in grades 1 to 8 (elementary and middle school): 80
Here:
15.2%
Maryland:
15.2%
Students in private schools in grades 9 to 12 (high school): 9
Here:
2.2%
Maryland:
14.4%
Students in private undergraduate colleges: 46
Here:
22.3%
Maryland:
20.2%
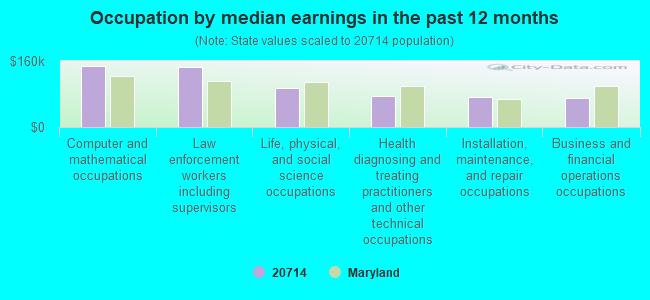
Occupation by median earnings in the past 12 months ($)
148,745Computer and mathematical occupations
146,567Law enforcement workers including supervisors
95,537Life, physical, and social science occupations
76,334Health diagnosing and treating practitioners and other technical occupations
72,387Installation, maintenance, and repair occupations
70,416Business and financial operations occupations
Top industries in this zip code by the number of employees in 2005:
Accommodation and Food Services: Full-Service Restaurants (20-49 employees: 1 establishment)
Real Estate and Rental and Leasing: Lessors of Nonresidential Buildings (except Miniwarehouses) (20-49: 1)
Accommodation and Food Services: Drinking Places (Alcoholic Beverages) (20-49: 1)
Accommodation and Food Services: Caterers (20-49: 1)
Accommodation and Food Services: Limited-Service Restaurants (10-19: 2)
Real Estate and Rental and Leasing: Offices of Real Estate Agents and Brokers (1-4: 5)
Other Services (except Public Administration): Religious Organizations (5-9: 1, 1-4: 1)
Administrative and Support and Waste Management and Remediation Services: All Other Miscellaneous Waste Management Services (5-9: 1)
Construction: Glass and Glazing Contractors (5-9: 1)
Real Estate and Rental and Leasing: Lessors of Residential Buildings and Dwellings (5-9: 1)
People in group quarters in 2010:
4 people in other noninstitutional facilities
People in group quarters in 2000:
4 people in religious group quarters
Fatal accident statistics in 2014:
Fatal accident count: 1
Vehicles involved in fatal accidents: 1
Fatal accidents caused by drunken drivers: 1
Fatalities: 1
Persons involved in fatal accidents: 1
Pedestrians involved in fatal accidents: 0
Home Mortgage Disclosure Act Aggregated Statistics For Year 2009 (Based on 2 partial tracts)
A) FHA, FSA/RHS & VA Home Purchase Loans
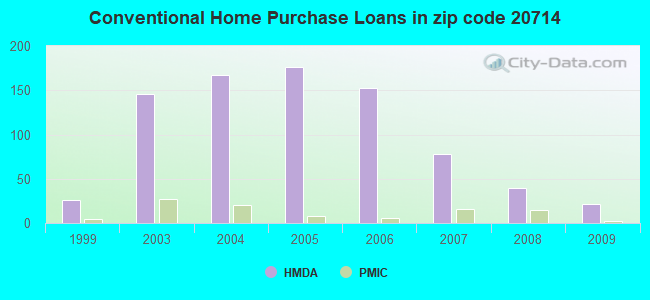
B) Conventional Home Purchase Loans
C) Refinancings
D) Home Improvement Loans
F) Non-occupant Loans on < 5 Family Dwellings (A B C & D)
Number
Average Value
Number
Average Value
Number
Average Value
Number
Average Value
Number
Average Value
LOANS ORIGINATED
50
$279,734
22
$226,980
185
$277,326
9
$142,450
20
$234,308
APPLICATIONS APPROVED, NOT ACCEPTED
1
$211,860
2
$173,995
19
$257,270
1
$22,770
2
$224,480
APPLICATIONS DENIED
4
$251,460
4
$228,938
67
$306,058
5
$61,182
7
$311,991
APPLICATIONS WITHDRAWN
1
$369,270
4
$262,475
38
$256,749
0
$0
6
$234,548
FILES CLOSED FOR INCOMPLETENESS
1
$381,150
1
$248,980
9
$289,190
1
$111,870
1
$393,030
Aggregated Statistics For Year 2008 (Based on 2 partial tracts)
A) FHA, FSA/RHS & VA Home Purchase Loans
B) Conventional Home Purchase Loans
C) Refinancings
D) Home Improvement Loans
F) Non-occupant Loans on < 5 Family Dwellings (A B C & D)
G) Loans On Manufactured Home Dwelling (A B C & D)
Number
Average Value
Number
Average Value
Number
Average Value
Number
Average Value
Number
Average Value
Number
Average Value
LOANS ORIGINATED
35
$296,463
39
$252,425
125
$240,768
14
$105,647
12
$209,798
0
$0
APPLICATIONS APPROVED, NOT ACCEPTED
0
$0
4
$241,065
11
$229,995
5
$144,738
2
$280,420
1
$61,880
APPLICATIONS DENIED
2
$326,450
4
$220,152
67
$277,710
17
$138,192
3
$315,643
1
$72,770
APPLICATIONS WITHDRAWN
2
$286,110
6
$239,085
39
$275,220
1
$89,590
1
$340,560
0
$0
FILES CLOSED FOR INCOMPLETENESS
0
$0
1
$205,430
8
$270,394
0
$0
1
$221,260
0
$0
Aggregated Statistics For Year 2007 (Based on 2 partial tracts)
A) FHA, FSA/RHS & VA Home Purchase Loans
B) Conventional Home Purchase Loans
C) Refinancings
D) Home Improvement Loans
F) Non-occupant Loans on < 5 Family Dwellings (A B C & D)
G) Loans On Manufactured Home Dwelling (A B C & D)
Number
Average Value
Number
Average Value
Number
Average Value
Number
Average Value
Number
Average Value
Number
Average Value
LOANS ORIGINATED
13
$315,962
78
$262,452
153
$244,420
27
$112,823
23
$221,846
0
$0
APPLICATIONS APPROVED, NOT ACCEPTED
0
$0
8
$238,899
28
$228,885
4
$105,808
1
$225,220
1
$71,780
APPLICATIONS DENIED
1
$436,090
11
$203,040
88
$301,157
16
$147,015
4
$326,452
4
$82,048
APPLICATIONS WITHDRAWN
0
$0
12
$236,692
46
$276,554
6
$173,662
3
$218,130
0
$0
FILES CLOSED FOR INCOMPLETENESS
0
$0
2
$396,000
18
$261,223
1
$77,720
0
$0
0
$0
Aggregated Statistics For Year 2006 (Based on 2 partial tracts)
A) FHA, FSA/RHS & VA Home Purchase Loans
B) Conventional Home Purchase Loans
C) Refinancings
D) Home Improvement Loans
F) Non-occupant Loans on < 5 Family Dwellings (A B C & D)
G) Loans On Manufactured Home Dwelling (A B C & D)
Number
Average Value
Number
Average Value
Number
Average Value
Number
Average Value
Number
Average Value
Number
Average Value
LOANS ORIGINATED
3
$349,140
152
$232,875
236
$228,017
36
$88,316
38
$231,621
0
$0
APPLICATIONS APPROVED, NOT ACCEPTED
0
$0
15
$243,540
29
$202,097
6
$67,155
5
$260,668
0
$0
APPLICATIONS DENIED
0
$0
22
$189,045
72
$245,747
17
$150,101
7
$193,616
2
$121,770
APPLICATIONS WITHDRAWN
0
$0
18
$233,475
73
$228,941
6
$196,515
4
$221,140
0
$0
FILES CLOSED FOR INCOMPLETENESS
0
$0
3
$290,563
18
$253,027
1
$209,380
2
$344,520
0
$0
Aggregated Statistics For Year 2005 (Based on 2 partial tracts)
A) FHA, FSA/RHS & VA Home Purchase Loans
B) Conventional Home Purchase Loans
C) Refinancings
D) Home Improvement Loans
F) Non-occupant Loans on < 5 Family Dwellings (A B C & D)
G) Loans On Manufactured Home Dwelling (A B C & D)
Number
Average Value
Number
Average Value
Number
Average Value
Number
Average Value
Number
Average Value
Number
Average Value
LOANS ORIGINATED
7
$261,854
176
$212,479
317
$217,275
42
$86,213
53
$208,843
0
$0
APPLICATIONS APPROVED, NOT ACCEPTED
0
$0
13
$223,092
24
$216,707
4
$93,185
3
$215,820
0
$0
APPLICATIONS DENIED
0
$0
22
$169,020
66
$230,025
23
$108,513
10
$165,627
4
$35,022
APPLICATIONS WITHDRAWN
1
$271,260
30
$192,802
88
$218,610
8
$114,531
7
$211,224
0
$0
FILES CLOSED FOR INCOMPLETENESS
0
$0
3
$267,133
19
$256,227
2
$57,420
0
$0
0
$0
Aggregated Statistics For Year 2004 (Based on 2 partial tracts)
A) FHA, FSA/RHS & VA Home Purchase Loans
B) Conventional Home Purchase Loans
C) Refinancings
D) Home Improvement Loans
F) Non-occupant Loans on < 5 Family Dwellings (A B C & D)
Number
Average Value
Number
Average Value
Number
Average Value
Number
Average Value
Number
Average Value
LOANS ORIGINATED
14
$216,280
167
$191,052
294
$187,647
33
$86,100
43
$187,098
APPLICATIONS APPROVED, NOT ACCEPTED
0
$0
10
$190,278
29
$165,262
11
$83,025
2
$205,920
APPLICATIONS DENIED
1
$198,990
16
$206,693
79
$176,978
22
$88,110
5
$296,406
APPLICATIONS WITHDRAWN
2
$206,415
11
$180,135
102
$181,320
8
$60,699
3
$127,380
FILES CLOSED FOR INCOMPLETENESS
0
$0
3
$209,053
20
$194,288
2
$58,165
3
$192,060
Aggregated Statistics For Year 2003 (Based on 2 partial tracts)
A) FHA, FSA/RHS & VA Home Purchase Loans
B) Conventional Home Purchase Loans
C) Refinancings
D) Home Improvement Loans
F) Non-occupant Loans on < 5 Family Dwellings (A B C & D)
Number
Average Value
Number
Average Value
Number
Average Value
Number
Average Value
Number
Average Value
LOANS ORIGINATED
42
$194,936
146
$162,380
515
$157,151
14
$44,868
40
$139,615
APPLICATIONS APPROVED, NOT ACCEPTED
2
$273,490
13
$150,023
52
$146,206
6
$22,935
4
$157,285
APPLICATIONS DENIED
3
$203,117
6
$129,938
79
$141,044
14
$30,619
6
$87,285
APPLICATIONS WITHDRAWN
2
$252,200
16
$224,884
96
$155,090
3
$77,717
4
$248,120
FILES CLOSED FOR INCOMPLETENESS
0
$0
3
$221,593
18
$169,757
0
$0
0
$0
Aggregated Statistics For Year 1999 (Based on 1 partial tract)
A) FHA, FSA/RHS & VA Home Purchase Loans
B) Conventional Home Purchase Loans
C) Refinancings
D) Home Improvement Loans
F) Non-occupant Loans on < 5 Family Dwellings (A B C & D)
Detailed PMIC statistics for the following Tracts:8604.01
2002 - 2018 National Fire Incident Reporting System (NFIRS) incidents
According to the data from the years 2002 - 2018 the average number of fire incidents per year is 17. The highest number of reported fires - 54 took place in 2004, and the least - 3 in 2012. The data has a declining trend.
When looking into fire subcategories, the most reports belonged to: Structure Fires (49.3%), and Outside Fires (22.0%).
Fire incident types reported to NFIRS in Zip Code 20714

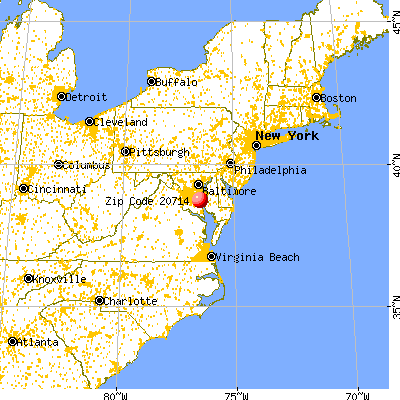


 Nearest zip codes: 20758, 20779, 20689, 20751, 20732, 20736.


 According to the data from the years 2002 - 2018 the average number of fire incidents per year is 17. The highest number of reported fires - 54 took place in 2004, and the least - 3 in 2012. The data has a declining trend.
 When looking into fire subcategories, the most reports belonged to: Structure Fires (49.3%), and Outside Fires (22.0%).