Races in North Andover, Massachusetts (MA) Detailed Stats
Ancestries, Foreign-born residents, place of birth

Recent posts about races in North Andover, Massachusetts on our local forum with over 2,400,000 registered users:
 | 50 migrants relocated to Martha's Vineyard by Florida Gov. Ron DeSantis (909 replies) |
| Thinking of buying a house in Andover, moving from Beverly (23 replies) |
| MA real estate and race (128 replies) |
| Boston Racial Stigma- is it "cool" to hate on Boston? (632 replies) |
| North Reading today - the good and the bad (125 replies) |
| Which towns should we consider? (35 replies) |
8.1% of North Andover, MA residents are foreign-born (3.3% born in Asia, 3.1% born in Europe, 0.8% born in Latin America), which is 123.5% less than the foreign-born rate of 18.0% across the entire state of Massachusetts.
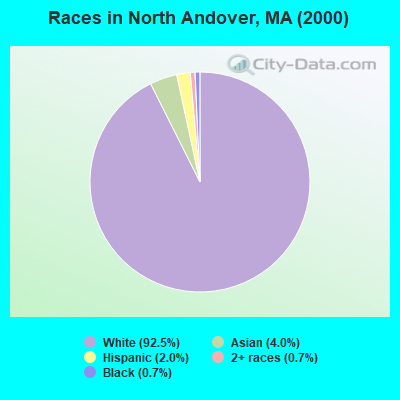
Race distribution in North Andover

- 25,17292.5%White alone
- 1,0774.0%Asian alone
- 5412.0%Hispanic
- 1840.7%Black alone
- 1950.7%Two or more races
- 250.09%Other race alone
- 60.02%American Indian alone
- 20.01%Native Hawaiian and Other
Pacific Islander alone
2000
2022
-
- 5,198,35981.9%White alone
- 428,7296.8%Hispanic
- 318,3295.0%Black alone
- 236,7863.7%Asian alone
- 110,3381.7%Two or more races
- 43,5860.7%Other race alone
- 11,2640.2%American Indian alone
- 1,7060.03%Native Hawaiian and Other
Pacific Islander alone

-
- 4,676,62767.0%White alone
- 911,03813.0%Hispanic
- 501,4637.2%Asian alone
- 459,7406.6%Black alone
- 341,8894.9%Two or more races
- 84,4031.2%Other race alone
- 5,8380.08%American Indian alone
- 9760.01%Native Hawaiian and Other
Pacific Islander alone

Income and house value in North Andover
- Median household income in 2022
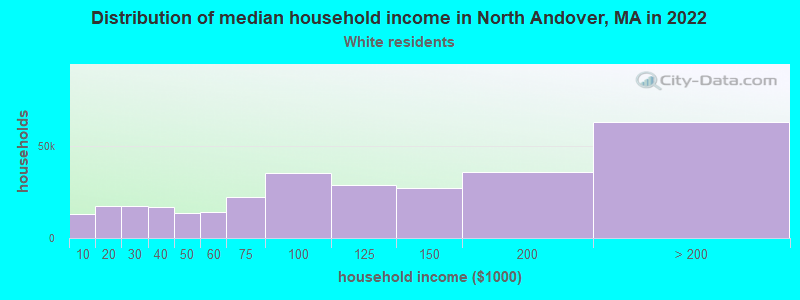
- $134,906White non-Hispanic householders
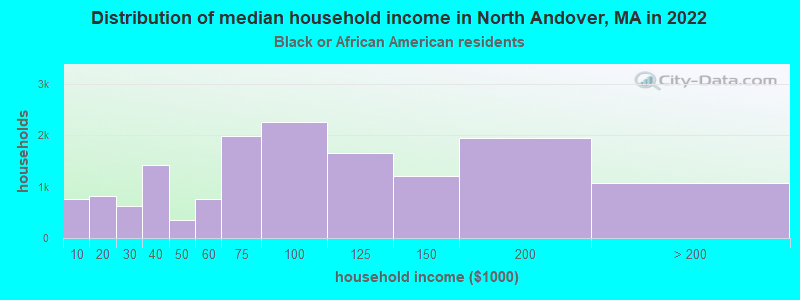
- $115,211Black householders
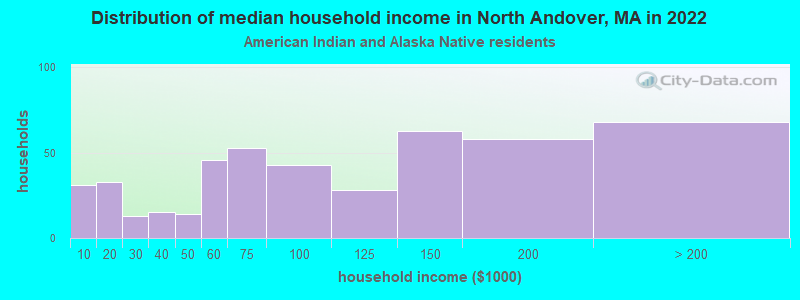
- $9,711American Indian and Alaska Native householders
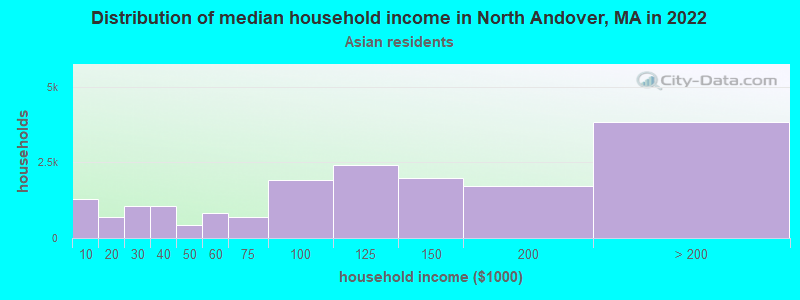
- over $200,000Asian householders
- $68,238Some other race householders
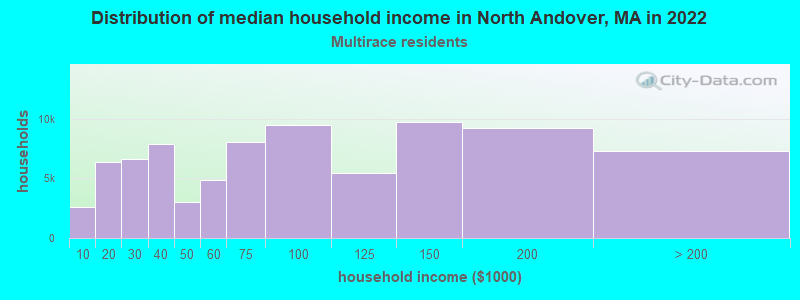
- over $200,000Two or more races householders
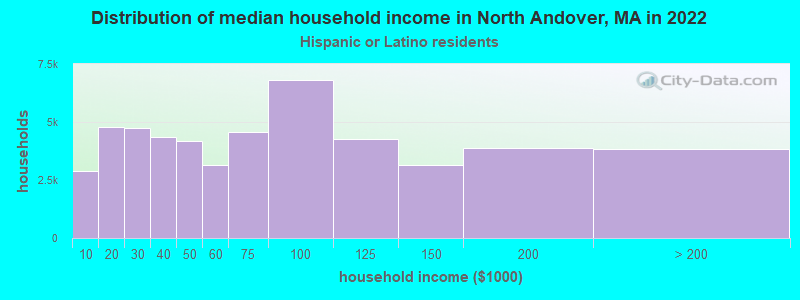
- $53,209Hispanic or Latino race householders
- Median 2022 house value
- $890,578White Non-Hispanic householders
- $772,340Black or African American householders
- $456,382American Indian or Alaska Native householders
- over $1,000,000Asian householders
- $456,382Some other race householders
- $849,574Two or more races householders
- $464,246Hispanic or Latino householders
Household income for White non-Hispanic householders
Household income for Black householders
Household income for American Indian and Alaska Native householders
Household income for Asian householders
Household income for Two or more races householders
Household income for Hispanic or Latino race householders
Foreign-born residents in North Andover
2,191 residents are foreign born (3.3% Asia, 3.1% Europe, 0.8% Latin America).
| This city: | 8.1% |
| Massachusetts: | 12.2% |
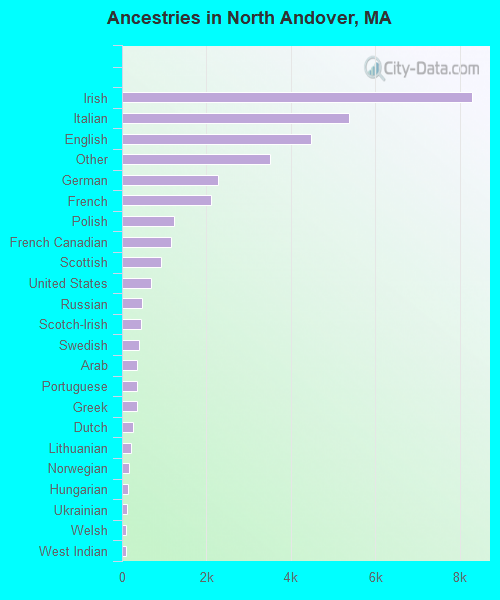
Ancestries in North Andover

- 8,27624.6%Irish
- 5,38616.0%Italian
- 4,46413.2%English
- 3,51410.4%Other
- 2,2666.7%German
- 2,1096.3%French
- 1,2223.6%Polish
- 1,1493.4%French Canadian
- 9142.7%Scottish
- 6972.1%United States
- 4811.4%Russian
- 4591.4%Scotch-Irish
- 4001.2%Swedish
- 3661.1%Arab
- 3571.1%Portuguese
- 3441.0%Greek
- 2620.8%Dutch
- 2220.7%Lithuanian
- 1730.5%Norwegian
- 1410.4%Hungarian
- 1240.4%Ukrainian
- 890.3%Welsh
- 850.3%West Indian
- 660.2%Danish
- 610.2%Czech
- 500.1%Slovak
- 210.06%Swiss
- 60.02%Subsaharan African
Zip codes: 01845.