Races in Monson, Massachusetts (MA) Detailed Stats
Ancestries, Foreign-born residents, place of birth

Recent posts about races in Monson, Massachusetts on our local forum with over 2,400,000 registered users:
 | Tree House Brewing Cape Cod (42 replies) |
| 2023 Real Estate Observations (5278 replies) |
| Home Prices By Town for 2022 (190 replies) |
| Big MA Ancestry Data Thread by Town (31 replies) |
| Are there signs of people leaving Boston for cheaper parts of the state yet? (233 replies) |
| Commute to Springfield: easier from Berkshires or NH? (22 replies) |
5.4% of Monson, MA residents are foreign-born (3.3% born in Europe, 1.8% born in Asia), which is 231.4% less than the foreign-born rate of 18.0% across the entire state of Massachusetts.
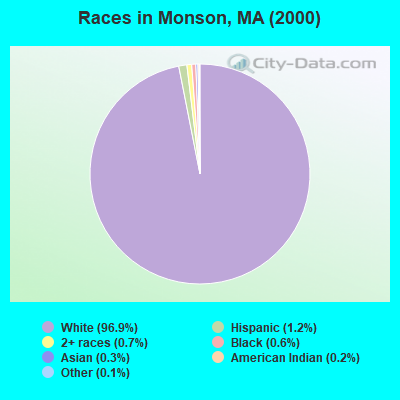
Race distribution in Monson

- 8,09896.9%White alone
- 981.2%Hispanic
- 590.7%Two or more races
- 460.6%Black alone
- 260.3%Asian alone
- 190.2%American Indian alone
- 120.1%Other race alone
- 10.01%Native Hawaiian and Other
Pacific Islander alone
2000
2022
-
- 5,198,35981.9%White alone
- 428,7296.8%Hispanic
- 318,3295.0%Black alone
- 236,7863.7%Asian alone
- 110,3381.7%Two or more races
- 43,5860.7%Other race alone
- 11,2640.2%American Indian alone
- 1,7060.03%Native Hawaiian and Other
Pacific Islander alone

-
- 4,676,62767.0%White alone
- 911,03813.0%Hispanic
- 501,4637.2%Asian alone
- 459,7406.6%Black alone
- 341,8894.9%Two or more races
- 84,4031.2%Other race alone
- 5,8380.08%American Indian alone
- 9760.01%Native Hawaiian and Other
Pacific Islander alone

Income and house value in Monson
- Median household income in 2022
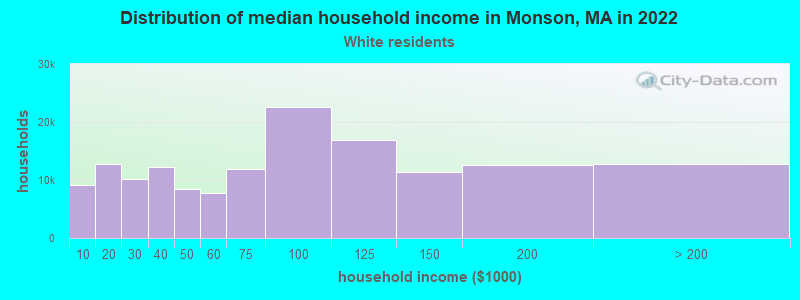
- $91,232White non-Hispanic householders
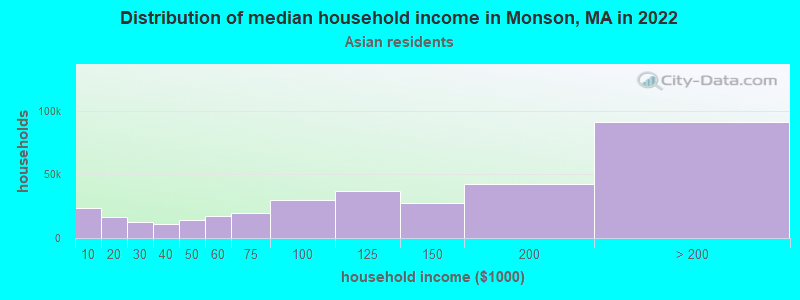
- $134,670Asian householders
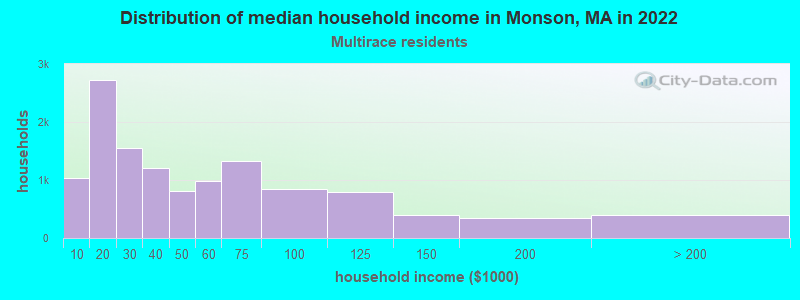
- $17,295Two or more races householders
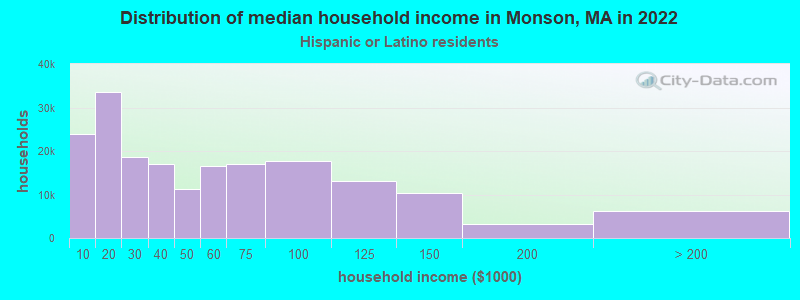
- $177,399Hispanic or Latino race householders
- Median 2022 house value
- $329,736White Non-Hispanic householders
- $251,334Asian householders
- $341,149Hispanic or Latino householders
Household income for White non-Hispanic householders
Household income for Asian householders
Household income for Two or more races householders
Household income for Hispanic or Latino race householders
Foreign-born residents in Monson
454 residents are foreign born (3.3% Europe, 1.8% Asia).
| This city: | 5.4% |
| Massachusetts: | 12.2% |
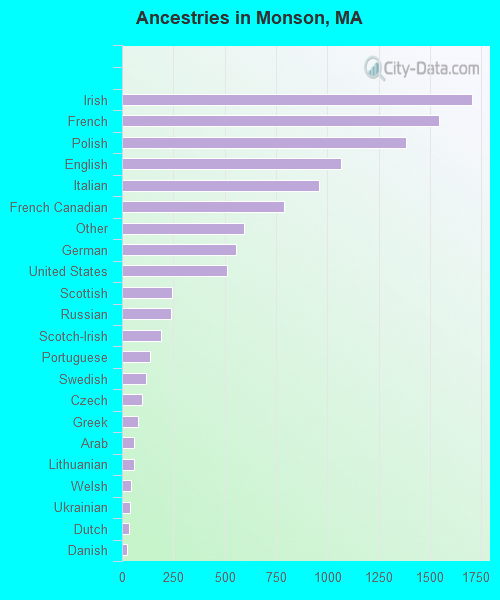
Ancestries in Monson

- 1,70316.2%Irish
- 1,54614.7%French
- 1,38313.2%Polish
- 1,06610.2%English
- 9629.2%Italian
- 7917.5%French Canadian
- 5945.7%Other
- 5555.3%German
- 5134.9%United States
- 2422.3%Scottish
- 2402.3%Russian
- 1901.8%Scotch-Irish
- 1351.3%Portuguese
- 1191.1%Swedish
- 990.9%Czech
- 800.8%Greek
- 600.6%Arab
- 590.6%Lithuanian
- 440.4%Welsh
- 400.4%Ukrainian
- 360.3%Dutch
- 250.2%Danish
- 80.08%Swiss
- 70.07%Norwegian
- 30.03%Subsaharan African
Zip codes: 01057.