Monson, Massachusetts
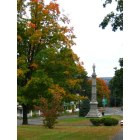
Monson: Center of Monson
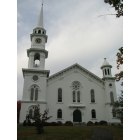
Monson: Monson First Congregational Church
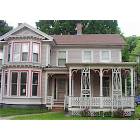
Monson: Green St. House
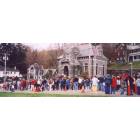
Monson: Monson Free Library
- add
your
Submit your own pictures of this town and show them to the world
- OSM Map
- General Map
- Google Map
- MSN Map
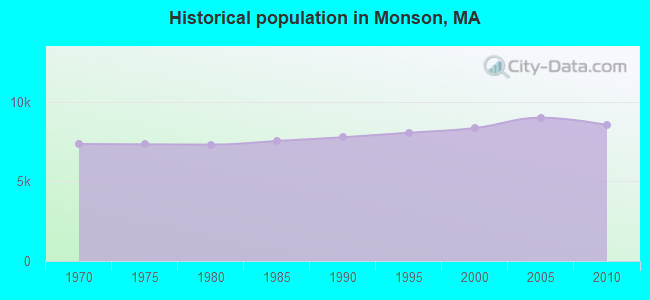
Population change since 2000: +2.4%
 |
| Males: 4,184 | |
| Females: 4,376 |
| Median resident age: | 43.4 years |
| Massachusetts median age: | 39.2 years |
Zip codes: 01057.
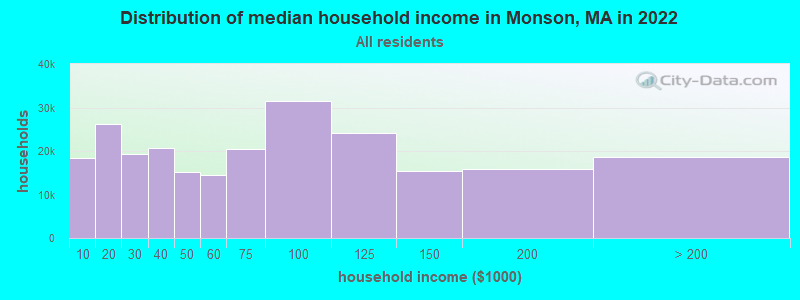
| Monson: | $83,664 |
| MA: | $94,488 |
Estimated per capita income in 2022: $39,516 (it was $22,519 in 2000)
Monson town income, earnings, and wages data
Estimated median house or condo value in 2022: $334,451 (it was $134,800 in 2000)
| Monson: | $334,451 |
| MA: | $534,700 |
Mean prices in 2022: all housing units: $315,253; detached houses: $334,901; townhouses or other attached units: $238,289; in 2-unit structures: $223,248; in 3-to-4-unit structures: $195,645; in 5-or-more-unit structures: $166,405; mobile homes: $156,908
Detailed information about poverty and poor residents in Monson, MA


Compare current foreclosures near Monson, MA:
| Photo | Address | Area | Beds / Baths | Price | Details |
|---|---|---|---|---|---|

|
#1
Stafford Rd
Monson, MA 01057
|
1,464 sq. feet
|
1 baths 3 beds |
show details | |

|
#2
Hovey Rd
Monson, MA 01057
|
2,256 sq. feet
|
1 baths 4 beds |
show details | |

|
#3
Cote Rd
Monson, MA 01057
|
2,184 sq. feet
|
1 baths 3 beds |
show details | |

|
#4
Upper Palmer Rd
Monson, MA 01057
|
1,456 sq. feet
|
1 baths 3 beds |
show details | |

|
#5
Cote Rd
Monson, MA 01057
|
1,728 sq. feet
|
3 baths 4 beds |
show details | |

|
#6
Mechanic St
Monson, MA 01057
|
3,136 sq. feet
|
2 baths 4 beds |
show details | |

|
#7
Lower Hampden Rd
Monson, MA 01057
|
- sq. feet
|
- baths - beds |
show details | |

|
#8
Tolland Ave
Stafford Springs, CT 06076
|
896 sq. feet
|
1 baths 3 beds |
$100,000
|
show details |

|
#9
Jondot Dr
Enfield, CT 06082
|
1,385 sq. feet
|
1 baths 3 beds |
$299,900
|
show details |

|
#10
Walnut Street
Springfield, MA 01105
|
2,850 sq. feet
|
2 baths 6 beds |
$99,900
|
show details |
| Photo | Address | Area | Beds / Baths | Price | Details |
|---|---|---|---|---|---|

|
#11
Sanford Ave
Enfield, CT 06082
|
21 sq. feet
|
1 baths 4 beds |
$225,000
|
show details |

|
#12
Newman St
Springfield, MA 01105
|
1,676 sq. feet
|
2 baths 3 beds |
$45,900
|
show details |

|
#13
Randolph St
Southbridge, MA 01550
|
3,276 sq. feet
|
3 baths 9 beds |
show details | |

|
#14
Nelson Street
Warren, MA 01083
|
- sq. feet
|
2 baths 3 beds |
show details | |

|
#15
Connecticut Ave
West Springfield, MA 01089
|
- sq. feet
|
2 baths 3 beds |
show details | |

|
#16
Joy St
Chicopee, MA 01013
|
1,780 sq. feet
|
2 baths 4 beds |
show details | |

|
#17
Laroche St
Ludlow, MA 01056
|
1,321 sq. feet
|
1 baths 3 beds |
show details | |

|
#18
Anthony Rd
Tolland, CT 06084
|
1,584 sq. feet
|
3 baths 4 beds |
show details | |

|
#19
Main St
Palmer, MA 01069
|
1,114 sq. feet
|
2 baths 3 beds |
show details | |

|
#20
Notre Dame St
Springfield, MA 01104
|
1,310 sq. feet
|
2 baths 4 beds |
show details |
| Photo | Address | Area | Beds / Baths | Price | Details |
|---|---|---|---|---|---|

|
#21
Amber Rd
Holland, MA 01521
|
1,363 sq. feet
|
1 baths 3 beds |
show details | |

|
#22
Poole Rd
Belchertown, MA 01007
|
800 sq. feet
|
1 baths 2 beds |
show details | |

|
#23
Marmon St
Springfield, MA 01129
|
980 sq. feet
|
1 baths 2 beds |
show details | |

|
#24
Phoenix Ter
Springfield, MA 01104
|
1,067 sq. feet
|
1 baths 3 beds |
show details | |

|
#25
Ontario St
Springfield, MA 01104
|
1,405 sq. feet
|
1 baths 3 beds |
show details | |

|
#26
Stuart St
Springfield, MA 01119
|
864 sq. feet
|
1 baths 3 beds |
show details | |

|
#27
Newbury St
Springfield, MA 01104
|
1,504 sq. feet
|
1 baths 3 beds |
show details | |

|
#28
Butler Ave
Chicopee, MA 01020
|
1,445 sq. feet
|
1 baths 3 beds |
show details | |

|
#29
Skyridge St
Ludlow, MA 01056
|
864 sq. feet
|
1 baths 3 beds |
show details | |

|
#30
Putnam St
Springfield, MA 01109
|
2,017 sq. feet
|
2 baths 4 beds |
show details |
| Photo | Address | Area | Beds / Baths | Price | Details |
|---|---|---|---|---|---|

|
#31
Catherine St
Chicopee, MA 01013
|
1,073 sq. feet
|
1 baths 2 beds |
show details | |

|
#32
Medford St
Chicopee, MA 01020
|
1,352 sq. feet
|
2 baths 3 beds |
show details | |

|
#33
Reed St
Warren, MA 01083
|
1,152 sq. feet
|
2 baths 3 beds |
show details | |

|
#34
New Boston Rd
Sturbridge, MA 01566
|
2,608 sq. feet
|
2 baths 4 beds |
show details | |

|
#35
Granby Rd
Chicopee, MA 01013
|
945 sq. feet
|
1 baths 2 beds |
show details | |

|
#36
Ontario St
Springfield, MA 01104
|
1,260 sq. feet
|
1 baths 3 beds |
show details | |

|
#37
Royal St
Chicopee, MA 01020
|
3,296 sq. feet
|
4 baths 7 beds |
show details | |

|
#38
Rocket Run
Enfield, CT 06082
|
1,008 sq. feet
|
1 baths 3 beds |
show details | |

|
#39
Grove St
West Springfield, MA 01089
|
1,566 sq. feet
|
1 baths 3 beds |
show details | |

|
#40
Brookfield Rd
Brimfield, MA 01010
|
1,482 sq. feet
|
3 baths 3 beds |
show details |
| Photo | Address | Area | Beds / Baths | Price | Details |
|---|---|---|---|---|---|

|
#41
Foster St
Springfield, MA 01105
|
1,512 sq. feet
|
2 baths 4 beds |
show details | |

|
#42
Woodland Dr
Hampden, MA 01036
|
972 sq. feet
|
1 baths 3 beds |
show details | |

|
#43
Brush Hill Ave
West Springfield, MA 01089
|
1,040 sq. feet
|
1 baths 3 beds |
show details | |

|
#44
Johnson St
Springfield, MA 01108
|
2,432 sq. feet
|
2 baths 6 beds |
show details | |

|
#45
Brown Ave
Holyoke, MA 01040
|
2,388 sq. feet
|
2 baths 6 beds |
show details | |

|
#46
Armstrong Rd
Enfield, CT 06082
|
1,632 sq. feet
|
1 baths 4 beds |
show details | |

|
#47
Howard St
Belchertown, MA 01007
|
960 sq. feet
|
1 baths 3 beds |
show details | |

|
#48
Garfield St
Springfield, MA 01108
|
3,384 sq. feet
|
2 baths 6 beds |
show details | |

|
#49
Winding Ln
Enfield, CT 06082
|
1,248 sq. feet
|
1 baths 3 beds |
show details | |

|
Check over 1 million property listings on Foreclosure.com!
|
browse all offers | |||

- 8,17295.5%White alone
- 1531.8%Hispanic
- 931.1%Two or more races
- 650.8%Black alone
- 520.6%Asian alone
- 180.2%American Indian alone
- 70.08%Other race alone
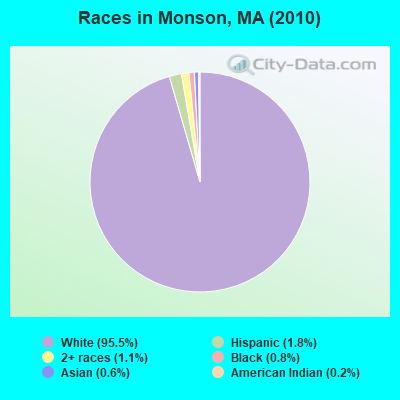
Races in Monson detailed stats: ancestries, foreign born residents, place of birth
According to our research of Massachusetts and other state lists, there were 4 registered sex offenders living in Monson, Massachusetts as of May 07, 2024.
The ratio of all residents to sex offenders in Monson is 2,140 to 1.
The ratio of registered sex offenders to all residents in this city is lower than the state average.
Type |
2009 |
2010 |
2011 |
2012 |
2013 |
2014 |
2015 |
2016 |
2017 |
2018 |
2019 |
2020 |
2021 |
2022 |
|---|---|---|---|---|---|---|---|---|---|---|---|---|---|---|
| Murders (per 100,000) | 0 (0.0) | 0 (0.0) | 0 (0.0) | 0 (0.0) | 0 (0.0) | 0 (0.0) | 0 (0.0) | 0 (0.0) | 0 (0.0) | 0 (0.0) | 0 (0.0) | 0 (0.0) | 0 (0.0) | 0 (0.0) |
| Rapes (per 100,000) | 0 (0.0) | 1 (11.7) | 1 (11.6) | 3 (34.7) | 2 (22.9) | 2 (22.8) | 4 (45.4) | 5 (56.7) | 3 (33.9) | 4 (45.0) | 4 (45.2) | 2 (22.8) | 4 (45.2) | 2 (24.6) |
| Robberies (per 100,000) | 1 (11.1) | 0 (0.0) | 1 (11.6) | 0 (0.0) | 0 (0.0) | 3 (34.2) | 0 (0.0) | 1 (11.3) | 2 (22.6) | 1 (11.2) | 0 (0.0) | 0 (0.0) | 2 (22.6) | 0 (0.0) |
| Assaults (per 100,000) | 16 (178.3) | 14 (163.6) | 29 (336.7) | 17 (196.7) | 24 (275.4) | 26 (296.7) | 10 (113.6) | 30 (340.4) | 26 (294.1) | 17 (191.2) | 23 (259.9) | 14 (159.4) | 19 (214.5) | 23 (283.4) |
| Burglaries (per 100,000) | 61 (679.7) | 61 (712.6) | 55 (638.6) | 70 (810.1) | 35 (401.6) | 31 (353.8) | 25 (284.0) | 23 (261.0) | 29 (328.0) | 27 (303.7) | 12 (135.6) | 13 (148.0) | 13 (146.8) | 6 (73.9) |
| Thefts (per 100,000) | 67 (746.6) | 56 (654.2) | 50 (580.6) | 69 (798.5) | 53 (608.1) | 33 (376.6) | 32 (363.6) | 30 (340.4) | 42 (475.0) | 21 (236.2) | 24 (271.2) | 23 (261.9) | 14 (158.1) | 23 (283.4) |
| Auto thefts (per 100,000) | 10 (111.4) | 4 (46.7) | 5 (58.1) | 7 (81.0) | 13 (149.2) | 5 (57.1) | 4 (45.4) | 5 (56.7) | 4 (45.2) | 3 (33.7) | 8 (90.4) | 8 (91.1) | 6 (67.7) | 6 (73.9) |
| Arson (per 100,000) | 0 (0.0) | 1 (11.7) | 0 (0.0) | 2 (23.1) | 1 (11.5) | 0 (0.0) | 0 (0.0) | 0 (0.0) | 1 (11.3) | 2 (22.5) | 0 (0.0) | 0 (0.0) | 0 (0.0) | 0 (0.0) |
| City-Data.com crime index | 125.4 | 121.8 | 152.7 | 162.2 | 137.8 | 132.3 | 97.1 | 153.3 | 138.3 | 111.0 | 115.7 | 78.2 | 107.8 | 98.8 |
The City-Data.com crime index weighs serious crimes and violent crimes more heavily. Higher means more crime, U.S. average is 246.1. It adjusts for the number of visitors and daily workers commuting into cities.
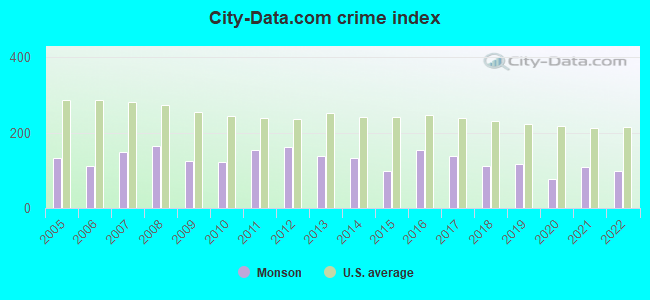
Crime rate in Monson detailed stats: murders, rapes, robberies, assaults, burglaries, thefts, arson
Full-time law enforcement employees in 2013, including police officers: 17 (12 officers - 10 male; 2 female).
| Officers per 1,000 residents here: | 1.38 |
| Massachusetts average: | 2.51 |
 Recent articles from our blog. Our writers, many of them Ph.D. graduates or candidates, create easy-to-read articles on a wide variety of topics.

 | 2023 Real Estate Observations (5278 replies) |
| Home Prices By Town for 2022 (190 replies) |
| Hillbilly Massachusetts (103 replies) |
| "I Went To Springfield, The Most Dangerous City In Massachusetts" (71 replies) |
| Big MA Ancestry Data Thread by Town (31 replies) |
| Could my young family be happy in MA? (152 replies) |
Latest news from Monson, MA collected exclusively by city-data.com from local newspapers, TV, and radio stations
Ancestries: Irish (20.4%), French (18.5%), Polish (16.5%), English (12.8%), Italian (11.5%), French Canadian (9.5%).
Current Local Time: EST time zone
Incorporated in 1775
Elevation: 407 feet
Land area: 44.3 square miles.
Population density: 193 people per square mile (very low).
454 residents are foreign born (3.3% Europe, 1.8% Asia).
| This town: | 5.4% |
| Massachusetts: | 12.2% |
| Monson town: | 1.5% ($2,026) |
| Massachusetts: | 1.3% ($2,336) |
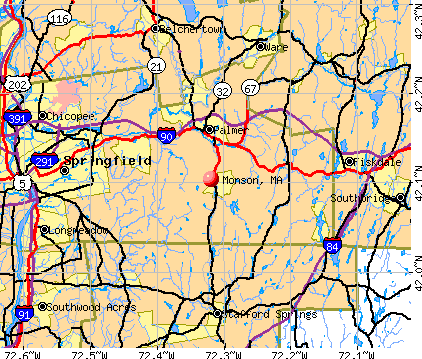
Nearest city with pop. 50,000+: Springfield, MA  (11.6 miles , pop. 152,082).
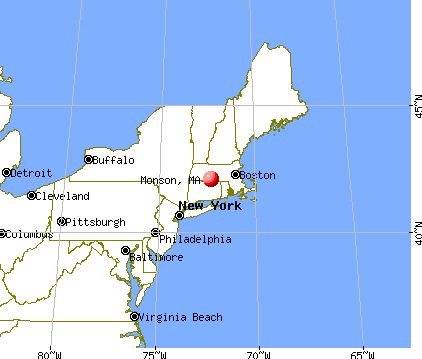
Nearest city with pop. 200,000+: Boston, MA (65.2 miles , pop. 589,141).
Nearest city with pop. 1,000,000+: Bronx, NY (117.7 miles , pop. 1,332,650).
Nearest cities:
), ), ), )Latitude: 42.09 N, Longitude: 72.32 W
Area code: 413
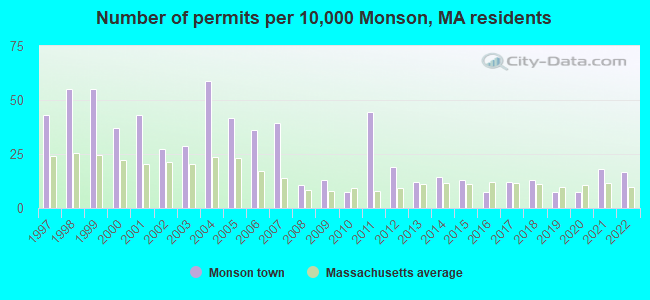
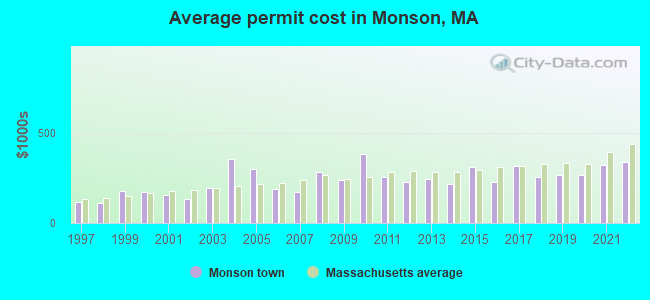
Single-family new house construction building permits:
- 2022: 14 buildings, average cost: $338,600
- 2021: 15 buildings, average cost: $321,400
- 2020: 6 buildings, average cost: $264,500
- 2019: 6 buildings, average cost: $264,500
- 2018: 11 buildings, average cost: $253,700
- 2017: 10 buildings, average cost: $315,500
- 2016: 6 buildings, average cost: $227,100
- 2015: 11 buildings, average cost: $308,400
- 2014: 12 buildings, average cost: $213,900
- 2013: 10 buildings, average cost: $241,300
- 2012: 16 buildings, average cost: $226,300
- 2011: 37 buildings, average cost: $257,200
- 2010: 6 buildings, average cost: $378,900
- 2009: 11 buildings, average cost: $238,300
- 2008: 9 buildings, average cost: $281,700
- 2007: 33 buildings, average cost: $169,800
- 2006: 30 buildings, average cost: $188,800
- 2005: 35 buildings, average cost: $300,000
- 2004: 49 buildings, average cost: $354,000
- 2003: 24 buildings, average cost: $195,000
- 2002: 23 buildings, average cost: $134,600
- 2001: 36 buildings, average cost: $155,700
- 2000: 31 buildings, average cost: $170,000
- 1999: 46 buildings, average cost: $175,000
- 1998: 46 buildings, average cost: $108,800
- 1997: 36 buildings, average cost: $113,800
| Here: | 3.7% |
| Massachusetts: | 3.5% |
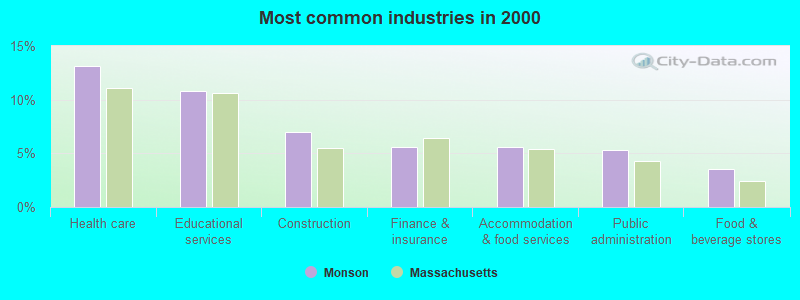
- Health care (13.1%)
- Educational services (10.8%)
- Construction (7.0%)
- Finance & insurance (5.6%)
- Accommodation & food services (5.6%)
- Public administration (5.3%)
- Food & beverage stores (3.6%)
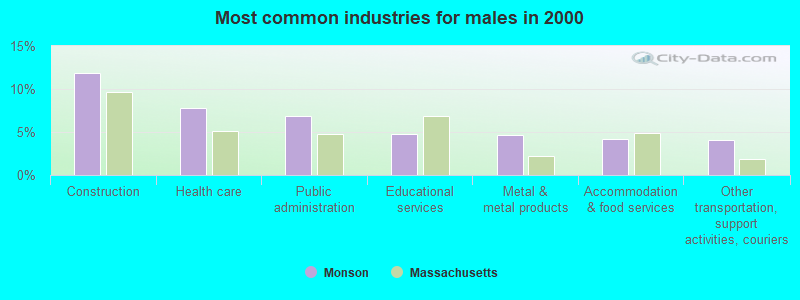
- Construction (11.8%)
- Health care (7.8%)
- Public administration (6.9%)
- Educational services (4.8%)
- Metal & metal products (4.7%)
- Accommodation & food services (4.2%)
- Other transportation, support activities, couriers (4.0%)
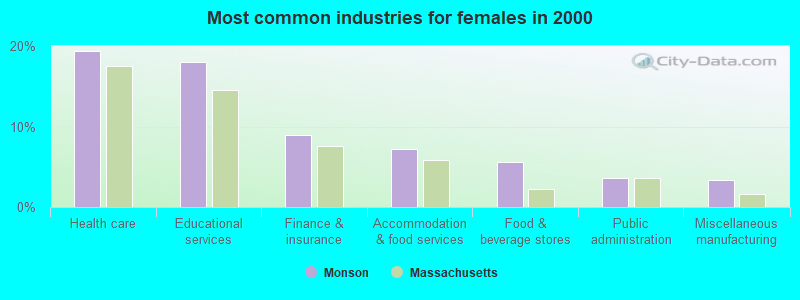
- Health care (19.4%)
- Educational services (18.0%)
- Finance & insurance (8.9%)
- Accommodation & food services (7.2%)
- Food & beverage stores (5.6%)
- Public administration (3.6%)
- Miscellaneous manufacturing (3.4%)
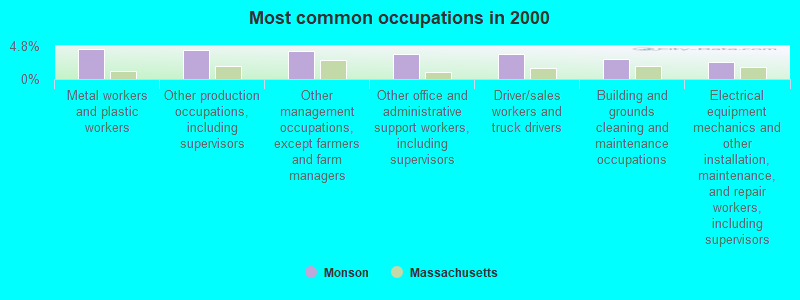
- Metal workers and plastic workers (4.3%)
- Other production occupations, including supervisors (4.2%)
- Other management occupations, except farmers and farm managers (4.0%)
- Other office and administrative support workers, including supervisors (3.6%)
- Driver/sales workers and truck drivers (3.6%)
- Building and grounds cleaning and maintenance occupations (2.9%)
- Electrical equipment mechanics and other installation, maintenance, and repair workers, including supervisors (2.4%)
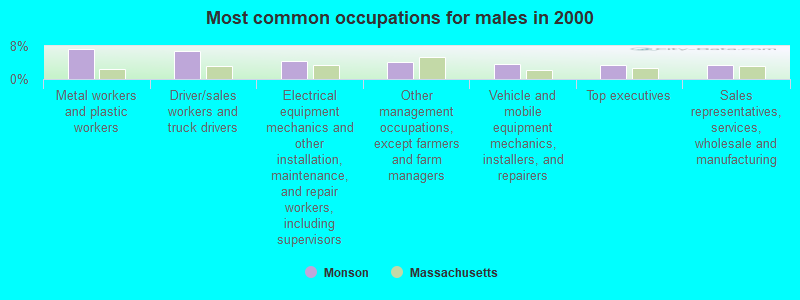
- Metal workers and plastic workers (7.2%)
- Driver/sales workers and truck drivers (6.7%)
- Electrical equipment mechanics and other installation, maintenance, and repair workers, including supervisors (4.5%)
- Other management occupations, except farmers and farm managers (4.1%)
- Vehicle and mobile equipment mechanics, installers, and repairers (3.7%)
- Top executives (3.4%)
- Sales representatives, services, wholesale and manufacturing (3.4%)
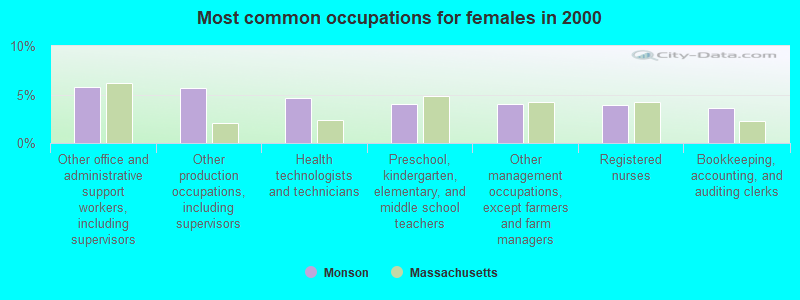
- Other office and administrative support workers, including supervisors (5.7%)
- Other production occupations, including supervisors (5.7%)
- Health technologists and technicians (4.6%)
- Preschool, kindergarten, elementary, and middle school teachers (4.0%)
- Other management occupations, except farmers and farm managers (4.0%)
- Registered nurses (3.9%)
- Bookkeeping, accounting, and auditing clerks (3.6%)
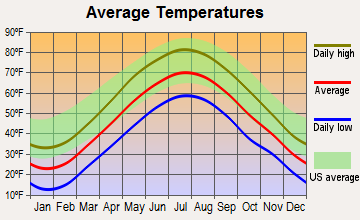
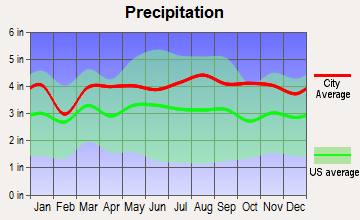
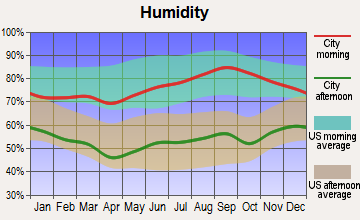
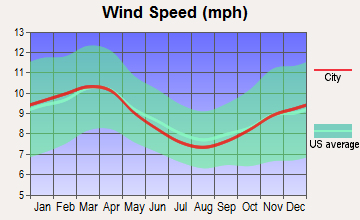
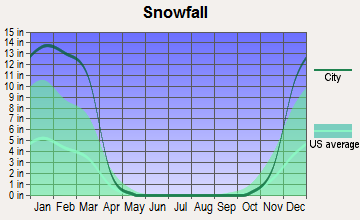
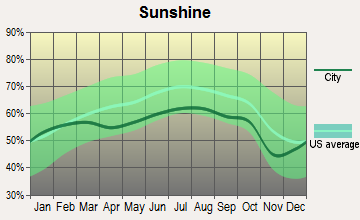
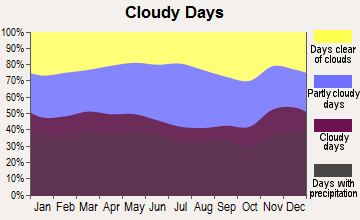
Average climate in Monson, Massachusetts
Based on data reported by over 4,000 weather stations
(lower is better)
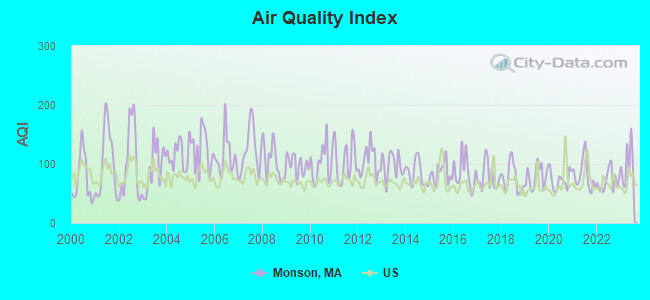
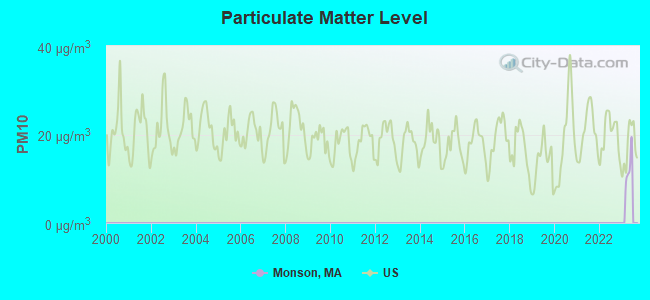
Air Quality Index (AQI) level in 2023 was 98.8. This is worse than average.
| City: | 98.8 |
| U.S.: | 72.6 |
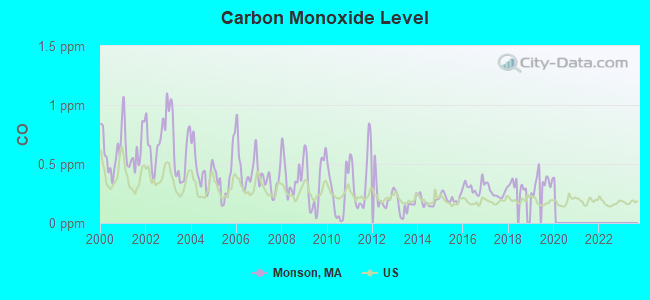
Carbon Monoxide (CO) [ppm] level in 2019 was 0.346. This is worse than average. Closest monitor was 9.4 miles away from the city center.
| City: | 0.346 |
| U.S.: | 0.251 |
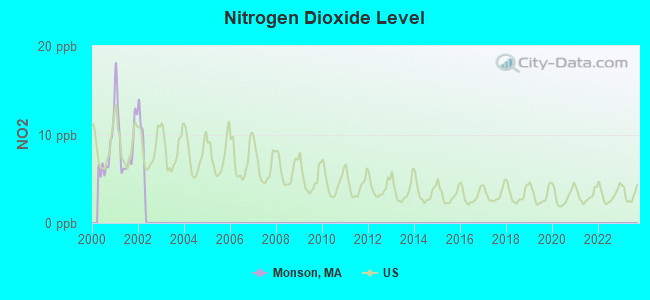
Nitrogen Dioxide (NO2) [ppb] level in 2001 was 9.44. This is significantly worse than average. Closest monitor was 8.6 miles away from the city center.
| City: | 9.44 |
| U.S.: | 5.11 |
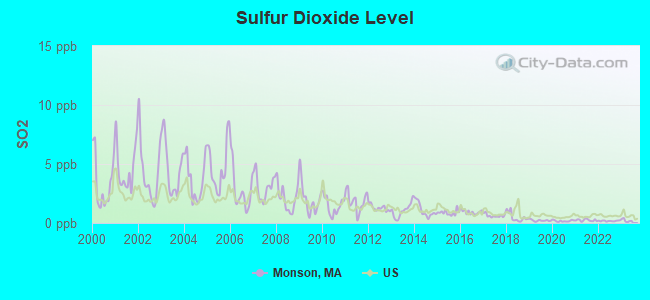
Sulfur Dioxide (SO2) [ppb] level in 2022 was 0.177. This is significantly better than average. Closest monitor was 9.4 miles away from the city center.
| City: | 0.177 |
| U.S.: | 1.515 |
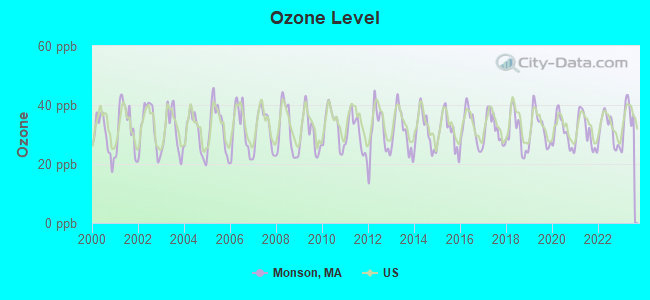
Ozone [ppb] level in 2023 was 35.7. This is about average. Closest monitor was 8.6 miles away from the city center.
| City: | 35.7 |
| U.S.: | 33.3 |
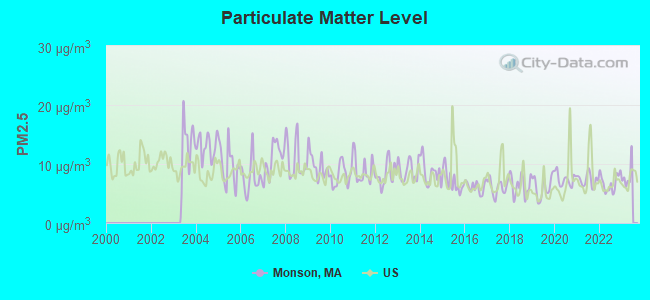
Particulate Matter (PM2.5) [µg/m3] level in 2022 was 6.82. This is about average. Closest monitor was 13.5 miles away from the city center.
| City: | 6.82 |
| U.S.: | 8.11 |
Tornado activity:
Monson-area historical tornado activity is above Massachusetts state average. It is 12% smaller than the overall U.S. average.
On 10/3/1979, a category F4 (max. wind speeds 207-260 mph) tornado 19.5 miles away from the Monson town center killed 3 people and injured 500 people and caused between $50,000,000 and $500,000,000 in damages.
On 6/9/1953, a category F4 tornado 27.4 miles away from the town center killed 90 people and injured 1228 people and caused between $50,000,000 and $500,000,000 in damages.
Earthquake activity:
Monson-area historical earthquake activity is significantly above Massachusetts state average. It is 71% smaller than the overall U.S. average.On 10/7/1983 at 10:18:46, a magnitude 5.3 (5.1 MB, 5.3 LG, 5.1 ML, Class: Moderate, Intensity: VI - VII) earthquake occurred 164.3 miles away from the city center
On 4/20/2002 at 10:50:47, a magnitude 5.3 (5.3 ML, Depth: 3.0 mi) earthquake occurred 181.2 miles away from the city center
On 4/20/2002 at 10:50:47, a magnitude 5.2 (5.2 MB, 4.2 MS, 5.2 MW, 5.0 MW) earthquake occurred 180.0 miles away from the city center
On 1/19/1982 at 00:14:42, a magnitude 4.7 (4.5 MB, 4.7 MD, 4.5 LG, Class: Light, Intensity: IV - V) earthquake occurred 104.2 miles away from Monson center
On 10/16/2012 at 23:12:25, a magnitude 4.7 (4.7 ML, Depth: 10.0 mi) earthquake occurred 134.2 miles away from Monson center
On 8/22/1992 at 12:20:32, a magnitude 4.8 (4.8 MB, 3.8 MS, 4.7 LG, Depth: 6.2 mi) earthquake occurred 231.7 miles away from Monson center
Magnitude types: regional Lg-wave magnitude (LG), body-wave magnitude (MB), duration magnitude (MD), local magnitude (ML), surface-wave magnitude (MS), moment magnitude (MW)
Natural disasters:
The number of natural disasters in Hampden County (22) is greater than the US average (15).Major Disasters (Presidential) Declared: 12
Emergencies Declared: 9
Causes of natural disasters: Storms: 6, Floods: 5, Hurricanes: 5, Snowstorms: 4, Winter Storms: 4, Blizzards: 2, Snows: 2, Snowfall: 1, Tornado: 1, Tropical Storm: 1, Wind: 1, Other: 1 (Note: some incidents may be assigned to more than one category).

Hospitals and medical centers near Monson:
- MONSON DEVELOPMENTAL CENTER (Hospital, about 5 miles away; PALMER, MA)
- WING MEMORIAL HOSPITAL AND MEDICAL CENTER Acute Care Hospitals (about 6 miles away; PALMER, MA)
- FMC DIALYSIS SERVICES OF PALMER (Dialysis Facility, about 6 miles away; PALMER, MA)
- PALMER HEALTHCARE CENTER (Nursing Home, about 6 miles away; PALMER, MA)
- WINGATE AT HAMPDEN REHABILITATIVE AND SKLD NURS RESI (Nursing Home, about 7 miles away; HAMPDEN, MA)
- PACE REHAB AND HOME CARE SERVICES, INC (Home Health Center, about 7 miles away; HAMPDEN, MA)
- WINGATE AT WILBRAHAM REHAB AND SKILLED NURS RESID (Nursing Home, about 7 miles away; WILBRAHAM, MA)
Amtrak stations near Monson:
- 14 miles: SPRINGFIELD (66 LYMAN ST.) . Services: ticket office, partially wheelchair accessible, enclosed waiting area, public restrooms, public payphones, full-service food facilities, snack bar, vending machines, ATM, paid short-term parking, paid long-term parking, call for car rental service, taxi stand, intercity bus service, public transit connection.
- 20 miles: WINDSOR LOCKS (S. MAIN ST. (RTE. 159)) . Services: public payphones, free short-term parking, free long-term parking, call for car rental service, call for taxi service, public transit connection.
Colleges/universities with over 2000 students nearest to Monson:
- Western New England University (about 11 miles; Springfield, MA; Full-time enrollment: 3,477)
- Springfield College (about 12 miles; Springfield, MA; FT enrollment: 3,144)
- American International College (about 13 miles; Springfield, MA; FT enrollment: 2,733)
- Springfield Technical Community College (about 14 miles; Springfield, MA; FT enrollment: 4,750)
- Bay Path College (about 14 miles; Longmeadow, MA; FT enrollment: 2,085)
- Mount Holyoke College (about 18 miles; South Hadley, MA; FT enrollment: 2,573)
- Holyoke Community College (about 19 miles; Holyoke, MA; FT enrollment: 4,911)
Public high school in Monson:
Public elementary/middle schools in Monson:
- QUARRY HILL COMMUNITY SCHOOL (Students: 642, Location: 43 MARGARET STREET, Grades: PK-4)
- GRANITE VALLEY MIDDLE (Students: 508, Location: 21 THOMPSON STREET, Grades: 5-8)
Library in Monson:
Points of interest:
Notable locations in Monson: Quaboag Valley Golf Course (A), Echo Hill Orchards (B), Monson Fire Department (C), Memorial Town Hall (D), Monson Free Library and Reading Room (E), Monson Town Hall (F). Display/hide their locations on the map
Churches in Monson include: Unitarian Universalist Church (A), Lily of the Valley Christian Center (B), First Church of Monson (C). Display/hide their locations on the map
Cemeteries: Moulton Hill Cemetery (1), Bethany Cemetery (2), Hillside Elementary School (3), Grouts Cemetery (4), Main Street Cemetery (5), North Main Street Cemetery (6), Butler Cemetery (7). Display/hide their locations on the map
Lakes, reservoirs, and swamps: Smith Pond (A), Duck Pond (B), Bradley Pond (C), Pulpit Rock Pond (D), Squire Pond (E), Chicopee Brook Reservoir (F), Paradise Lake (G), Monson Reservoir (H). Display/hide their locations on the map
Streams, rivers, and creeks: Thayer Brook (A), Chicopee Brook (B), Conant Brook (C), Pinnacle Creek (D), Vinica Brook (E). Display/hide their locations on the map
Tourist attraction: Monson Historical Society Inc (Historical Places & Services; 1 Green Street) (1). Display/hide its approximate location on the map
Birthplace of: Henry Martin Tupper - University president, Albert G. Riddle - Lawyer, Arthur D. Norcross - Politician.
Drinking water stations with addresses in Monson and their reported violations in the past:
MONSON WATER AND SEWER DEPT (Population served: 4,117, Groundwater):Past health violations:
- MCL, Monthly (TCR) - In AUG-2010, Contaminant: Coliform. Follow-up actions: St AO (w/o penalty) issued (SEP-13-2010)
- MCL, Monthly (TCR) - In SEP-2009, Contaminant: Coliform. Follow-up actions: St AO (w/o penalty) issued (2 times from MAR-23-2009 to NOV-06-2009)
- MCL, Monthly (TCR) - In DEC-2008, Contaminant: Coliform. Follow-up actions: St AO (w/o penalty) issued (NOV-06-2009)
| This town: | 2.6 people |
| Massachusetts: | 2.5 people |
| This town: | 70.8% |
| Whole state: | 63.0% |
| This town: | 8.1% |
| Whole state: | 7.0% |
Likely homosexual households (counted as self-reported same-sex unmarried-partner households)
- Lesbian couples: 0.8% of all households
- Gay men: 0.2% of all households
| This town: | 5.6% |
| Whole state: | 9.3% |
| This town: | 2.2% |
| Whole state: | 4.4% |
2 people in other noninstitutional facilities in 2010
228 people in schools, hospitals, or wards for the intellectually disabled in 2000
2 people in religious group quarters in 2000
Banks with branches in Monson (2011 data):
- Monson Savings Bank: at 146 Main Street, branch established on 1872/03/27. Info updated 2011/09/07: Bank assets: $246.4 mil, Deposits: $206.7 mil, local headquarters, positive income, Commercial Lending Specialization, 3 total offices, Holding Company: Monson Financial Services Mhc
For population 15 years and over in Monson:
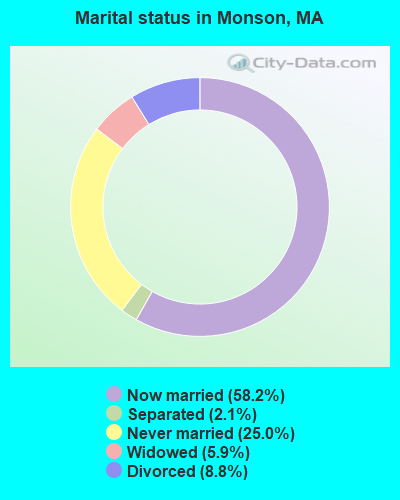
- Never married: 25.0%
- Now married: 58.2%
- Separated: 2.1%
- Widowed: 5.9%
- Divorced: 8.8%
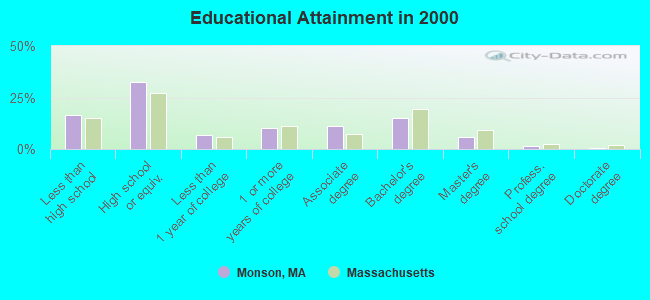
For population 25 years and over in Monson:
- High school or higher: 83.3%
- Bachelor's degree or higher: 22.5%
- Graduate or professional degree: 7.6%
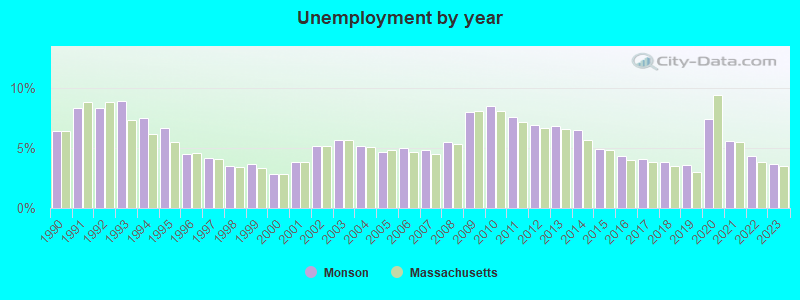
- Unemployed: 3.9%
- Mean travel time to work (commute): 29.5 minutes
| Here: | 13.1 |
| Massachusetts average: | 13.1 |
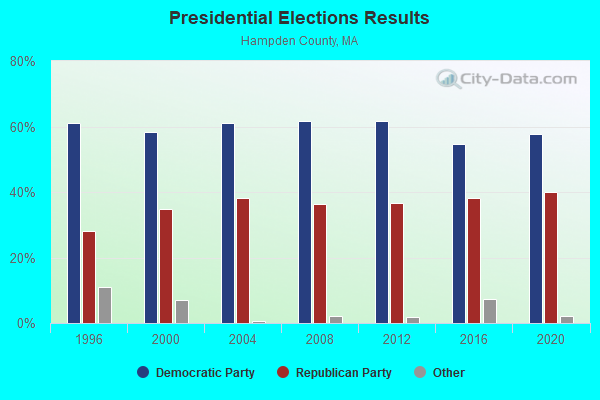
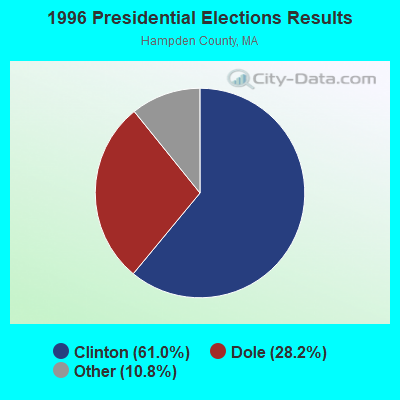
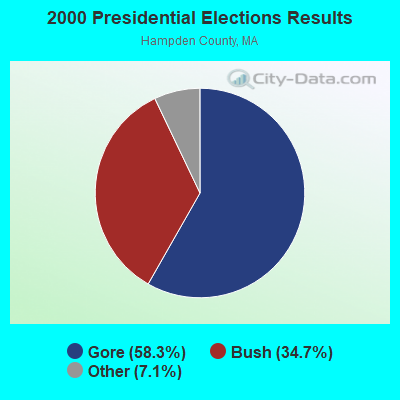
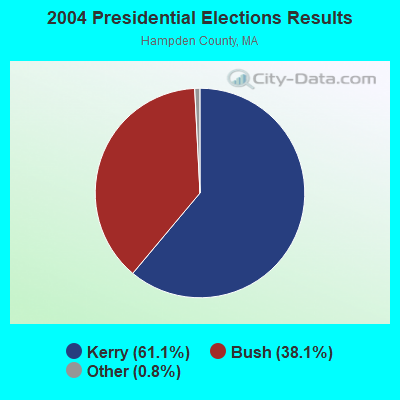
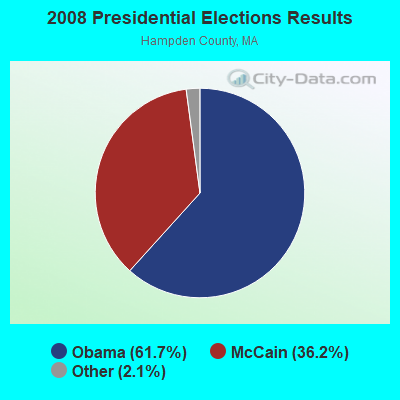
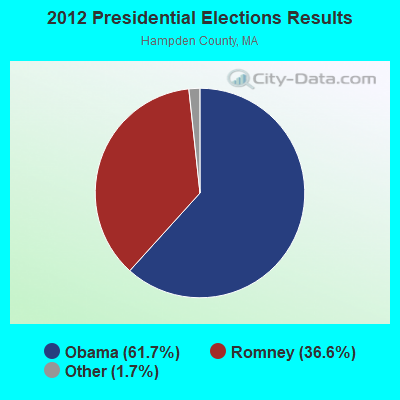
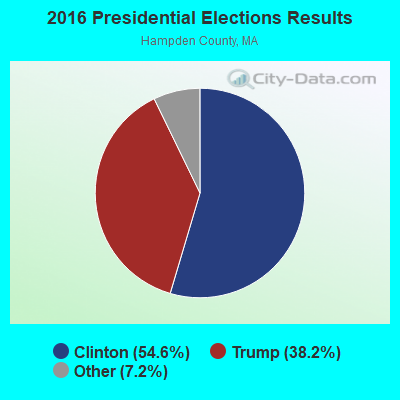
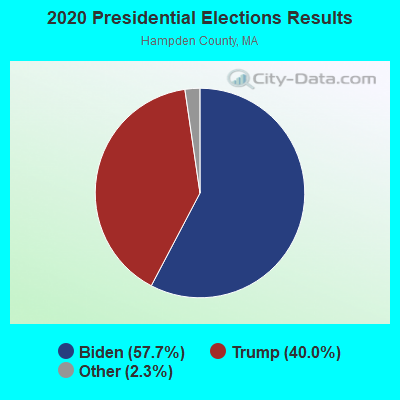
Graphs represent county-level data. Detailed 2008 Election Results
Religion statistics for Monson, MA (based on Hampden County data)
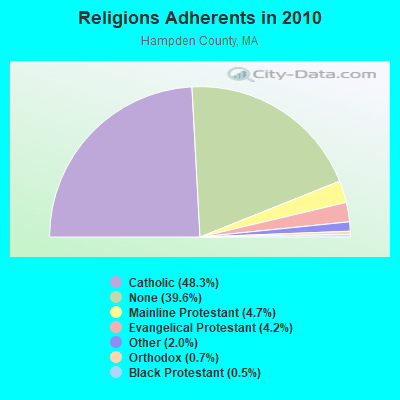
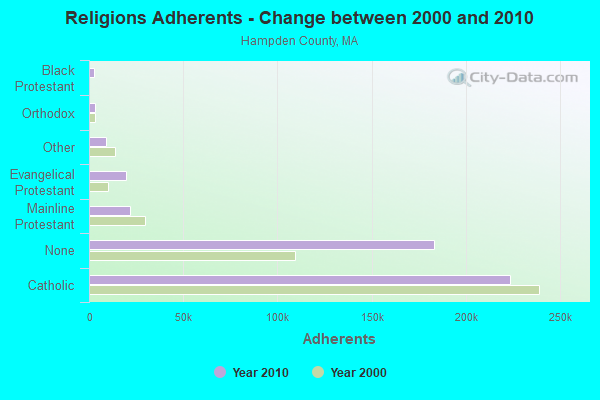
| Religion | Adherents | Congregations |
|---|---|---|
| Catholic | 223,685 | 65 |
| Mainline Protestant | 21,962 | 88 |
| Evangelical Protestant | 19,438 | 114 |
| Other | 9,140 | 31 |
| Orthodox | 3,406 | 10 |
| Black Protestant | 2,491 | 16 |
| None | 183,368 | - |
Food Environment Statistics:
| Here: | 1.95 / 10,000 pop. |
| State: | 1.98 / 10,000 pop. |
| Hampden County: | 0.04 / 10,000 pop. |
| Massachusetts: | 0.05 / 10,000 pop. |
| Here: | 1.87 / 10,000 pop. |
| Massachusetts: | 2.22 / 10,000 pop. |
| Here: | 2.43 / 10,000 pop. |
| Massachusetts: | 1.77 / 10,000 pop. |
| Hampden County: | 7.27 / 10,000 pop. |
| State: | 8.76 / 10,000 pop. |
| This county: | 9.2% |
| Massachusetts: | 8.1% |
| Hampden County: | 25.9% |
| Massachusetts: | 22.5% |
| Here: | 16.2% |
| Massachusetts: | 16.5% |
3.64% of this county's 2021 resident taxpayers lived in other counties in 2020 ($58,474 average adjusted gross income)
| Here: | 3.64% |
| Massachusetts average: | 6.35% |
0.02% of residents moved from foreign countries ($105 average AGI)
Hampden County: 0.02% Massachusetts average: 0.01%
Top counties from which taxpayers relocated into this county between 2020 and 2021:
| from Hampshire County, MA | |
| from Hartford County, CT | |
| from Worcester County, MA |
4.26% of this county's 2020 resident taxpayers moved to other counties in 2021 ($66,146 average adjusted gross income)
| Here: | 4.26% |
| Massachusetts average: | 7.18% |
0.03% of residents moved to foreign countries ($223 average AGI)
Hampden County: 0.03% Massachusetts average: 0.02%
Top counties to which taxpayers relocated from this county between 2020 and 2021:
| to Hampshire County, MA | |
| to Hartford County, CT | |
| to Worcester County, MA |
| Businesses in Monson, MA | ||||
| Name | Count | Name | Count | |
|---|---|---|---|---|
| Dunkin Donuts | 1 | Subway | 1 | |
| GNC | 1 | True Value | 1 | |
| Rite Aid | 1 | |||
Strongest AM radio stations in Monson:
- WNNZ (640 AM; 50 kW; WESTFIELD, MA; Owner: CLEAR CHANNEL BROADCASTING LICENSES, INC.)
- WVNE (760 AM; daytime; 25 kW; LEICESTER, MA; Owner: BLOUNT MASSCOM, INC.)
- WCRN (830 AM; 50 kW; WORCESTER, MA; Owner: CARTER BROADCASTING CORPORATION)
- WTIC (1080 AM; 50 kW; HARTFORD, CT; Owner: INFINITY RADIO OPERATIONS INC.)
- WALE (990 AM; 50 kW; GREENVILLE, RI; Owner: NORTH AMERICAN BROADCASTING CO., INC.)
- WARE (1250 AM; 5 kW; WARE, MA; Owner: SUCCESS SIGNAL BROADCASTING, INC.)
- WACE (730 AM; 5 kW; CHICOPEE, MA; Owner: CARTER BROADCASTING CORP.)
- WHYN (560 AM; 5 kW; SPRINGFIELD, MA; Owner: CLEAR CHANNEL BROADCASTING LICENSES, INC.)
- WEEI (850 AM; 50 kW; BOSTON, MA; Owner: ENTERCOM BOSTON LICENSE, LLC)
- WKOX (1200 AM; 50 kW; FRAMINGHAM, MA; Owner: CAPSTAR TX LIMITED PARTNERSHIP)
- WRKO (680 AM; 50 kW; BOSTON, MA; Owner: ENTERCOM BOSTON LICENSE, LLC)
- WBIX (1060 AM; 40 kW; NATICK, MA; Owner: LANGER BROADCASTING CORPORATION)
- WSPR (1270 AM; 5 kW; SPRINGFIELD, MA; Owner: ANTONIO F. AND HELENA R. GOIS, TENANTS BY THE ENTIRETY)
Strongest FM radio stations in Monson:
- WHYN-FM (93.1 FM; SPRINGFIELD, MA; Owner: CLEAR CHANNEL BROADCASTING LICENSES, INC.)
- WFCR (88.5 FM; AMHERST, MA; Owner: UNIVERSITY OF MASSACHUSETTS)
- WRNX (100.9 FM; AMHERST, MA; Owner: WESTERN MASSACHUSETTS RADIO COMPANY)
- WAQY (102.1 FM; SPRINGFIELD, MA; Owner: SAGA COMMUNICATIONS OF NEW ENGLAND, LLC)
- WAAF (107.3 FM; WORCESTER, MA; Owner: ENTERCOM BOSTON LICENSE, LLC)
- WAMH (89.3 FM; AMHERST, MA; Owner: TRUSTEES OF AMHERST COLLEGE)
- W246AM (97.1 FM; AMHERST, MA; Owner: GREAT NORTHERN RADIO, LLC)
- WSRS (96.1 FM; WORCESTER, MA; Owner: CAPSTAR TX LIMITED PARTNERSHIP)
- WWFX (100.1 FM; SOUTHBRIDGE, MA; Owner: CITADEL BROADCASTING COMPANY)
- WPKX (97.9 FM; ENFIELD, CT; Owner: CAPSTAR TX LIMITED PARTNERSHIP)
- WRCH (100.5 FM; NEW BRITAIN, CT; Owner: INFINITY RADIO OPERATIONS INC.)
- WHUS (91.7 FM; STORRS, CT; Owner: THE BD. OF TRUSTEES, THE UNIV. OF CT)
- WORC-FM (98.9 FM; WEBSTER, MA; Owner: CITADEL BROADCASTING COMPANY)
- WAMC-FM (90.3 FM; ALBANY, NY; Owner: WAMC)
- WYCM (90.1 FM; CHARLTON, MA; Owner: BAY PATH VOCATIONAL HIGH SCHOOL)
- WTIC-FM (96.5 FM; HARTFORD, CT; Owner: INFINITY RADIO OPERATIONS INC.)
- WWUH (91.3 FM; WEST HARTFORD, CT; Owner: UNIVERSITY OF HARTFORD)
- WCCC-FM (106.9 FM; HARTFORD, CT; Owner: MARLIN BROADCASTING, LLC)
- W258AC (99.5 FM; STORRS, CT; Owner: CONNECTICUT PUBLIC BROADCASTING, INC)
- WILI-FM (98.3 FM; WILLIMANTIC, CT; Owner: NUTMEG BROADCASTING COMPANY)
TV broadcast stations around Monson:
- WYDN (Channel 48; WORCESTER, MA; Owner: EDUCATIONAL PUBLIC TV CORPORATION)
- WTIC-TV (Channel 61; HARTFORD, CT; Owner: TRIBUNE TELEVISION COMPANY)
- W11BJ (Channel 11; HARTFORD, CT; Owner: COMMUNICATIONS SITE MANAGEMENT LLC)
- WUNI (Channel 27; WORCESTER, MA; Owner: ENTRAVISION HOLDINGS, LLC)
- WUVN (Channel 18; HARTFORD, CT; Owner: ENTRAVISION HOLDINGS, LLC)
- WTXX (Channel 20; WATERBURY, CT; Owner: WTXX INC.)
- WWLP (Channel 22; SPRINGFIELD, MA; Owner: WWLP BROADCASTING, LLC)
- WVIT (Channel 30; NEW BRITAIN, CT; Owner: OUTLET BROADCASTING, INC)
- WPXQ (Channel 69; BLOCK ISLAND, RI; Owner: OCEAN STATE TELEVISION, L.L.C.)
- WEDH (Channel 24; HARTFORD, CT; Owner: CONNECTICUT PUBLIC BROADCASTING, INC.)
- WUTF (Channel 66; MARLBOROUGH, MA; Owner: TELEFUTURA BOSTON LLC)
- WHPX (Channel 26; NEW LONDON, CT; Owner: PAXSON HARTFORD LICENSE, INC.)
- W67DF (Channel 67; SPRINGFIELD, MA; Owner: TRINITY BROADCASTING NETWORK)
- National Bridge Inventory (NBI) Statistics
- 24Number of bridges
- 148ft / 45.2mTotal length
- $39,585,000Total costs
- 108,647Total average daily traffic
- 6,985Total average daily truck traffic
- 107,371Total future (year 2031) average daily traffic
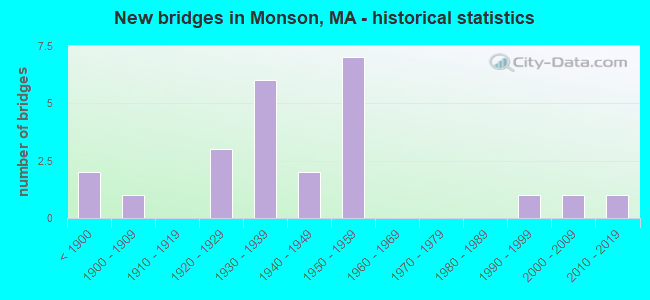
- New bridges - historical statistics
- 2Before 1900
- 11900-1909
- 31920-1929
- 61930-1939
- 21940-1949
- 71950-1959
- 11990-1999
- 12000-2009
- 12010-2019
FCC Registered Cell Phone Towers:
1- 111 Hovey Road (Lat: 42.142306 Lon: -72.348139), Type: Mast, Structure height: 48.8 m, Call Sign: KNKA331
Assigned Frequencies: 869.040 MHz, 869.040 MHz, 869.040 MHz, 824.040 MHz, 824.040 MHz, 824.040 MHz, 890.010 MHz, 890.010 MHz, 890.010 MHz, 845.010 MHz, 845.010 MHz, 845.010 MHzGrant Date: 02/02/2018, Expiration Date: 01/22/2028Registrant: Verizon Wireless, 5055 North Point Pkwy, Np2ne Network Engineering, Alpharetta, GA 30022, Phone: (770) 797-1070, Fax: (678) 259-1319, Email:
FCC Registered Antenna Towers:
6- Chris Kelly, Bald Peak Off Hovey Rd (Lat: 42.141944 Lon: -72.347778), Type: 76.0, Overall height: 76 m, Registrant: Keller And Heckman LLP, Black@khlaw.Com, , Washi-ngton, Phone: (202) 434-4130
- William R Sproles, Bald Peak Off Hovey Rd (Lat: 42.141944 Lon: -72.347778), Type: 76.0, Overall height: 76 m, Registrant: National Grid Usa Service Company, Inc., William.Sproles@us.Ngrid.Com, , Westb-orough, Phone: (508) 389-4600
- William R Sproles, Bald Peak Off Hovey Rd (Lat: 42.141944 Lon: -72.347778), Type: 76.0, Overall height: 76 m, Registrant: National Grid Usa Service Co., Inc., William.Sproles@us.Ngrid.Com, , Walth-am, Phone: (781) 907-3621
- Kurt R Jackson, Hovey Hill (Lat: 42.141667 Lon: -72.348056), Type: 72.5, Structure height: 25013 m, Overall height: 67 m, Registrant: Venic-e, Phone: (941) 488-4205
- Bald Peak Off Hovey Rd (Lat: 42.141944 Lon: -72.347778), Type: 76.0, Overall height: 76 m, Registrant: New England Power Service Company, Westb-orough, Phone: (508) 389-2000
- Hovey Hill (Lat: 42.141667 Lon: -72.348056), Type: 72.5, Overall height: 67 m, Registrant: Venic-e, Phone: (941) 488-4205
FCC Registered Private Land Mobile Towers:
1- Hovey Hill (Lat: 42.141750 Lon: -72.348139), Type: Tower, Structure height: 61 m, Call Sign: WPHZ953, Licensee ID: L01422065,
Assigned Frequencies: 929.962 MHz, Grant Date: 12/29/2000, Expiration Date: 09/07/2010, Cancellation Date: 10/23/2010, Certifier: Shawn E Endsley, Registrant: Usa Mobility Wireless, Inc., 3000 Technology Dr. #400, Plano, TX 75074, Phone: (972) 801-0000, Fax: (972) 801-1699, Email:
FCC Registered Broadcast Land Mobile Towers:
5- Hwy Dept 200 Main St (Lat: 42.096750 Lon: -72.313972), Call Sign: KSS837,
Assigned Frequencies: 33.0600 MHz, Grant Date: 03/05/2024, Expiration Date: 05/16/2034, Registrant: Town Of Monson, 110 Main Street, Monson, MA 01057, Phone: (413) 893-9500, Fax: (413) 267-4162, Email:
- Bald Peak Hovey Rd (Lat: 42.142028 Lon: -72.347861), Call Sign: WQI380,
Assigned Frequencies: 155.280 MHz, 155.340 MHz, Grant Date: 04/18/1995, Expiration Date: 05/16/2000, Cancellation Date: 10/29/2000, Registrant: Wing Memorial Hospital Association, Wright St, Palmer, MA 01069, Phone: (413) 283-7651
- 110 Main St (Lat: 42.100083 Lon: -72.314528), Type: Tower, Structure height: 20 m, Overall height: 33 m, Call Sign: WBC459,
Assigned Frequencies: 465.225 MHz, 465.475 MHz, Grant Date: 04/17/2014, Expiration Date: 07/12/2024, Certifier: Jospeh Rebello, Registrant: Town Of Monson, 110 Main Street, Monson, MA 01057, Phone: (413) 893-9500, Fax: (413) 267-4162, Email:
- Hovey Hill N Hovey Rd (Lat: 42.141750 Lon: -72.348139), Call Sign: WDV814,
Assigned Frequencies: 464.150 MHz, Grant Date: 06/18/1998, Expiration Date: 08/23/2003, Cancellation Date: 10/26/2003, Registrant: Allen Lawnmower Co Inc, 197 Main St, Agawam, MA 01001
- Palmer Road Well (Lat: 42.114278 Lon: -72.311861), Type: Pole, Structure height: 9.1 m, Overall height: 12.1 m, Call Sign: WQIK328,
Assigned Frequencies: 151.092 MHz, Grant Date: 12/14/2017, Expiration Date: 03/03/2028, Certifier: Craig W Jalbert, Registrant: Monson Water & Sewer Dept., 198 Main Street, Monson, MA 01057, Phone: (413) 267-4130, Fax: (413) 267-4106, Email:
FCC Registered Microwave Towers:
12 (See the full list of FCC Registered Microwave Towers in this town)FCC Registered Paging Towers:
6 (See the full list of FCC Registered Paging Towers)FCC Registered Amateur Radio Licenses:
54 (See the full list of FCC Registered Amateur Radio Licenses in Monson)FAA Registered Aircraft:
4- Aircraft: CESSNA 172G (Category: Land, Seats: 4, Weight: Up to 12,499 Pounds, Speed: 105 mph), Engine: CONT MOTOR 0-300 SER (145 HP) (Reciprocating)
N-Number: 4159L, N4159L, N-4159L, Serial Number: 17254228, Year manufactured: 1966, Airworthiness Date: 03/23/1966, Certificate Issue Date: 08/11/1992
Registrant (Individual): Raymond J Grassetti, 57 Paradise Lake Rd, Monson, MA 01057 - Aircraft: RYAN NAVION A (Category: Land, Seats: 5, Weight: Up to 12,499 Pounds, Speed: 126 mph), Engine: CONT MOTOR E185 SERIES (205 HP) (Reciprocating)
N-Number: 4346K, N4346K, N-4346K, Serial Number: NAV-4-1346, Year manufactured: 1948, Airworthiness Date: 03/17/1956, Certificate Issue Date: 08/29/1980
Registrant (Individual): Peter W Mastalerz, 8 Park Ave, Monson, MA 01057 - Aircraft: GLOBE GC-1B (Category: Land, Seats: 2, Weight: Up to 12,499 Pounds, Speed: 105 mph), Engine: CONT MOTOR C125 SERIES (125 HP) (Reciprocating)
N-Number: 80528, N80528, N-80528, Serial Number: 31, Year manufactured: 1946, Airworthiness Date: 09/19/1955, Certificate Issue Date: 05/20/2002
Registrant (Individual): Peter W Mastalerz, 8 Park Ave, Monson, MA 01057 - Aircraft: NORTH AMERICAN NAVION (Category: Land, Seats: 5, Weight: Up to 12,499 Pounds, Speed: 126 mph), Engine: CONT MOTOR E185 SERIES (205 HP) (Reciprocating)
N-Number: 91588, N91588, N-91588, Serial Number: NAV-4-365, Year manufactured: 1946, Certificate Issue Date: 02/29/2012
Registrant (Individual): Peter W Mastalerz, 8 Park Ave, Monson, MA 01057
2002 - 2018 National Fire Incident Reporting System (NFIRS) incidents
- Fire incident types reported to NFIRS in Monson, MA
- 29745.5%Outside Fires
- 25539.1%Structure Fires
- 7611.6%Mobile Property/Vehicle Fires
- 253.8%Other
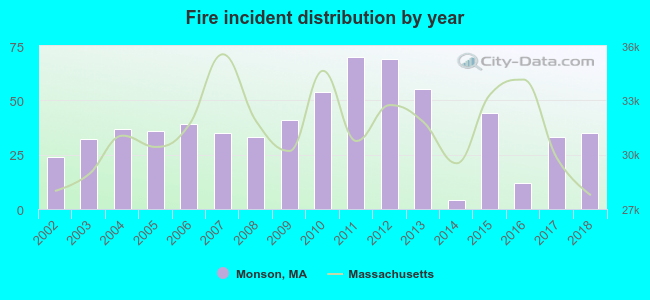 According to the data from the years 2002 - 2018 the average number of fires per year is 38. The highest number of fires - 70 took place in 2011, and the least - 4 in 2014. The data has a rising trend.
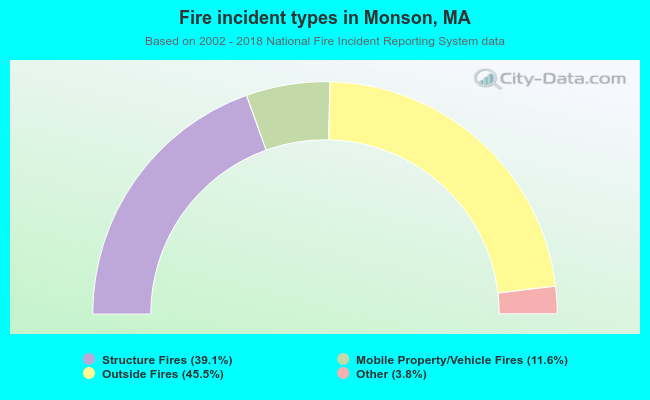 When looking into fire subcategories, the most reports belonged to: Outside Fires (45.5%), and Structure Fires (39.1%).
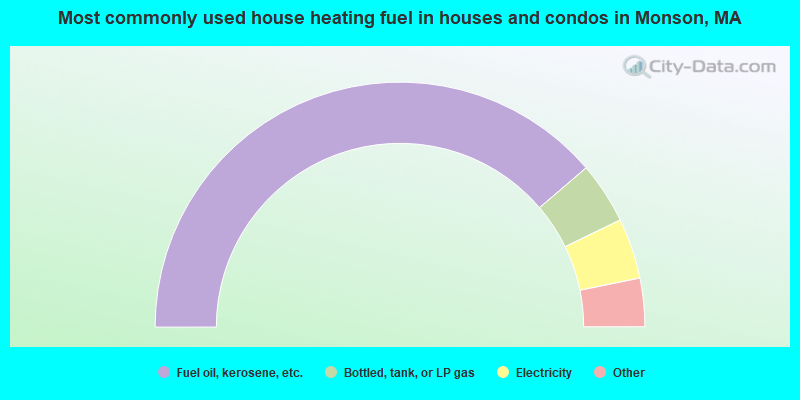
- 77.5%Fuel oil, kerosene, etc.
- 8.1%Bottled, tank, or LP gas
- 8.0%Electricity
- 3.1%Wood
- 1.5%Utility gas
- 1.0%Coal or coke
- 0.8%Other fuel
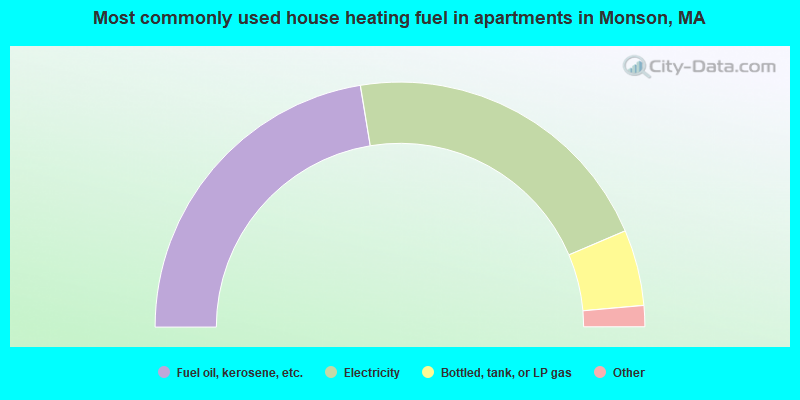
- 44.8%Fuel oil, kerosene, etc.
- 42.3%Electricity
- 10.0%Bottled, tank, or LP gas
- 1.8%Wood
- 1.0%Other fuel
Monson compared to Massachusetts state average:
- Median house value below state average.
- Unemployed percentage significantly below state average.
- Black race population percentage significantly below state average.
- Hispanic race population percentage significantly below state average.
- Median age above state average.
- Foreign-born population percentage significantly below state average.
- Renting percentage below state average.
- Length of stay since moving in significantly above state average.
- Number of rooms per house significantly below state average.
- House age significantly below state average.
Monson on our top lists:
- #9 on the list of "Top 101 cities with largest percentage of males in occupations: bus drivers (population 5,000+)"
- #11 on the list of "Top 101 cities with largest percentage of females in occupations: occupational and physical therapist assistants and aides (population 5,000+)"
- #19 on the list of "Top 101 cities with largest percentage of females in industries: plastics and rubber products (population 5,000+)"
- #22 on the list of "Top 101 cities with largest percentage of males in occupations: therapists (population 5,000+)"
- #24 on the list of "Top 101 cities with the largest percentage of people in schools, hospitals, or wards for the mentally retarded (population 1,000+)"
- #24 on the list of "Top 101 cities with largest percentage of females in industries: warehousing and storage (population 5,000+)"
- #30 on the list of "Top 101 cities with largest percentage of females in occupations: secondary school teachers (population 5,000+)"
- #35 on the list of "Top 101 cities with largest percentage of males in occupations: food processing workers (population 5,000+)"
- #36 on the list of "Top 101 cities with largest percentage of males in industries: plastics and rubber products (population 5,000+)"
- #38 on the list of "Top 101 cities with largest percentage of males in occupations: nursing, psychiatric, and home health aides (population 5,000+)"
- #46 on the list of "Top 101 cities with largest percentage of males in industries: paper and paper products merchant wholesalers (population 5,000+)"
- #50 on the list of "Top 101 cities with largest percentage of females in industries: machinery (population 5,000+)"
- #54 on the list of "Top 101 cities with largest percentage of females in industries: paper (population 5,000+)"
- #66 on the list of "Top 101 cities with largest percentage of females in industries: miscellaneous manufacturing (population 5,000+)"
- #66 on the list of "Top 101 cities with largest percentage of males in industries: other transportation, and support activities, and couriers (population 5,000+)"
- #78 on the list of "Top 101 cities with largest percentage of males in industries: health care (population 5,000+)"
- #83 on the list of "Top 101 cities with largest percentage of males in industries: u. s. postal service (population 5,000+)"
- #87 on the list of "Top 101 cities with largest percentage of females in industries: food and beverage stores (population 5,000+)"
- #88 on the list of "Top 101 cities with largest percentage of males in industries: electronic shopping and mail-order houses (population 5,000+)"
- #93 on the list of "Top 101 cities with largest percentage of males in industries: office supplies and stationery stores (population 5,000+)"
- #67 (01057) on the list of "Top 101 zip codes with the largest percentage of French Canadian first ancestries (pop 5,000+)"
- #14 on the list of "Top 101 counties with the lowest percentage of residents relocating from other counties between 2010 and 2011"
- #21 on the list of "Top 101 counties with the largest number of people moving out compared to moving in (pop. 50,000+)"
- #22 on the list of "Top 101 counties with the highest carbon monoxide air pollution readings in 2012 (ppm)"
- #31 on the list of "Top 101 counties with the lowest percentage of residents relocating to other counties in 2011"
- #34 on the list of "Top 101 counties with the lowest percentage of residents that keep firearms around their homes"

|
|
Total of 75 patent applications in 2008-2024.