Races in Middleborough, Massachusetts (MA) Detailed Stats
Ancestries, Foreign-born residents, place of birth
3.4% of Middleborough, MA residents are foreign-born (1.5% born in Europe, 0.7% born in Asia, 0.6% born in Latin America, 0.4% born in North America), which is 434.1% less than the foreign-born rate of 18.0% across the entire state of Massachusetts.
Race distribution in Middleborough

- 19,05795.6%White alone
- 2481.2%Black alone
- 2481.2%Two or more races
- 1560.8%Hispanic
- 960.5%Other race alone
- 870.4%Asian alone
- 430.2%American Indian alone
- 60.03%Native Hawaiian and Other
Pacific Islander alone
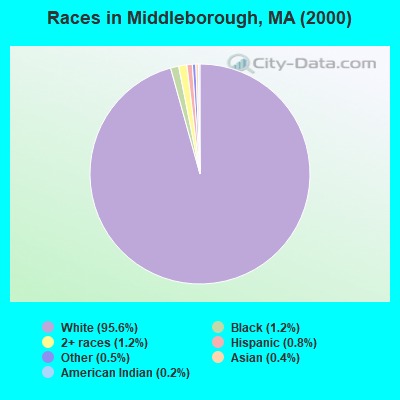
2000
2022
-
- 5,198,35981.9%White alone
- 428,7296.8%Hispanic
- 318,3295.0%Black alone
- 236,7863.7%Asian alone
- 110,3381.7%Two or more races
- 43,5860.7%Other race alone
- 11,2640.2%American Indian alone
- 1,7060.03%Native Hawaiian and Other
Pacific Islander alone

-
- 4,676,62767.0%White alone
- 911,03813.0%Hispanic
- 501,4637.2%Asian alone
- 459,7406.6%Black alone
- 341,8894.9%Two or more races
- 84,4031.2%Other race alone
- 5,8380.08%American Indian alone
- 9760.01%Native Hawaiian and Other
Pacific Islander alone

Income and house value in Middleborough
- Median household income in 2022
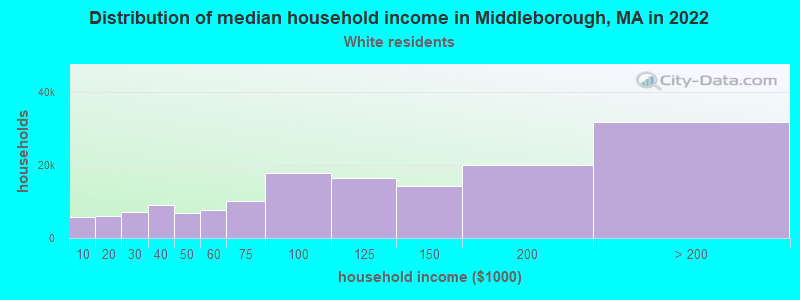
- $98,663White non-Hispanic householders
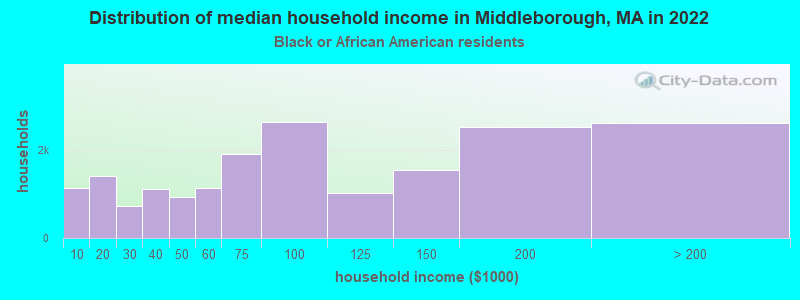
- $105,848Black householders
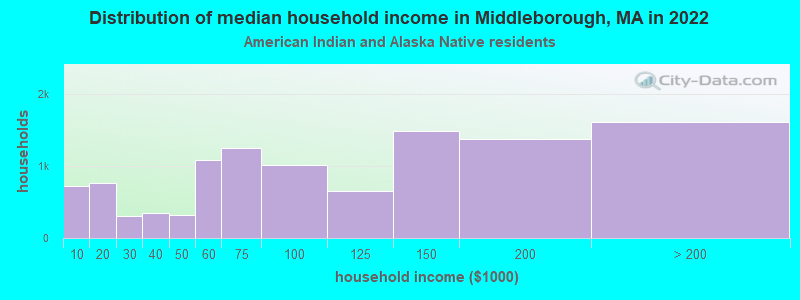
- over $200,000American Indian and Alaska Native householders
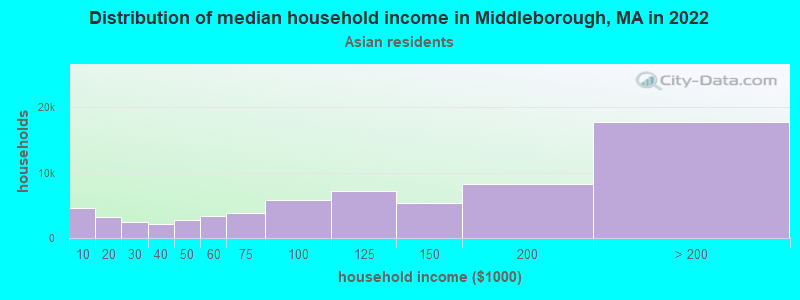
- $30,795Asian householders
- $53,207Some other race householders
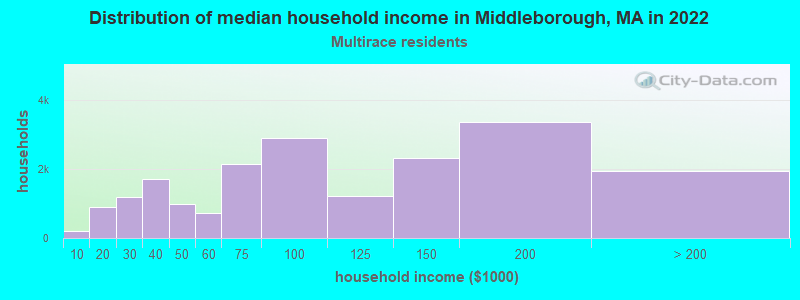
- $126,437Two or more races householders
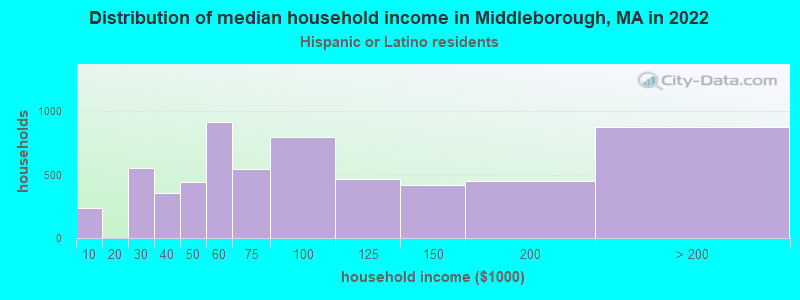
- $65,589Hispanic or Latino race householders
- Median 2022 house value
- $495,163White Non-Hispanic householders
- $544,991Black or African American householders
- $277,789American Indian or Alaska Native householders
- $700,703Asian householders
- $506,063Two or more races householders
- $658,661Hispanic or Latino householders
Household income for White non-Hispanic householders
Household income for Black householders
Household income for American Indian and Alaska Native householders
Household income for Asian householders
Household income for Two or more races householders
Household income for Hispanic or Latino race householders
Foreign-born residents in Middleborough
672 residents are foreign born (1.5% Europe, 0.7% Asia, 0.6% Latin America, 0.4% North America).
| This city: | 3.4% |
| Massachusetts: | 12.2% |
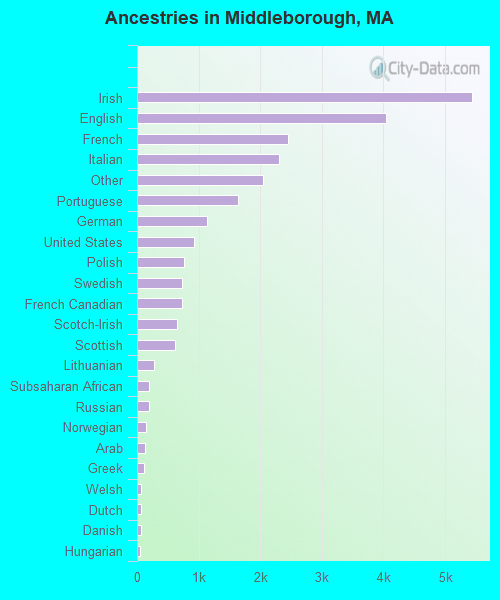
Ancestries in Middleborough

- 5,44021.9%Irish
- 4,03716.3%English
- 2,4449.8%French
- 2,2989.3%Italian
- 2,0508.3%Other
- 1,6346.6%Portuguese
- 1,1364.6%German
- 9273.7%United States
- 7553.0%Polish
- 7383.0%Swedish
- 7242.9%French Canadian
- 6462.6%Scotch-Irish
- 6142.5%Scottish
- 2751.1%Lithuanian
- 1980.8%Subsaharan African
- 1910.8%Russian
- 1540.6%Norwegian
- 1320.5%Arab
- 1100.4%Greek
- 680.3%Welsh
- 670.3%Dutch
- 620.2%Danish
- 500.2%Hungarian
- 330.1%West Indian
- 240.10%Swiss
- 80.03%Czech
- 60.02%Slovak
- 60.02%Ukrainian
Zip codes: 02346.