Races in Hewitt, Texas (TX) Detailed Stats
Data:
Races - White alone (%)
Races - White alone (% change since 2000)
Races - Black alone (%)
Races - Black alone (% change since 2000)
Races - American Indian alone (%)
Races - American Indian alone (% change since 2000)
Races - Asian alone (%)
Races - Asian alone (% change since 2000)
Races - Hispanic (%)
Races - Hispanic (% change since 2000)
Races - Native Hawaiian and Other Pacific Islander alone (%)
Races - Native Hawaiian and Other Pacific Islander alone (% change since 2000)
Races - Two or more races(%)
Races - Two or more races(% change since 2000)
Races - Other race alone (%)
Races - Other race alone (% change since 2000)
Racial diversity
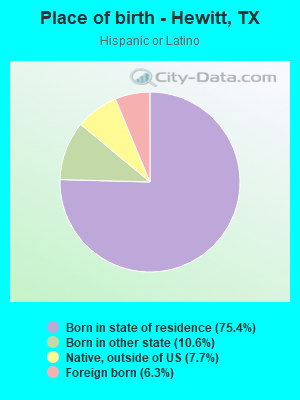
Place of birth - Born in state of residence (%)
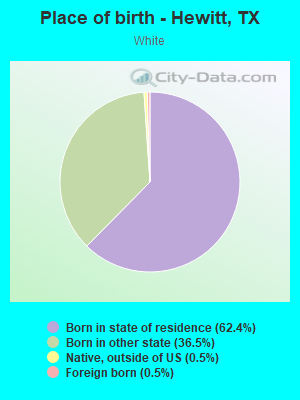
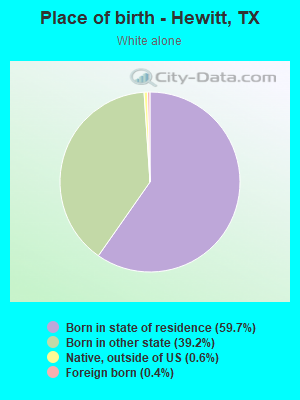
Place of birth - Born in state of residence (%) - White
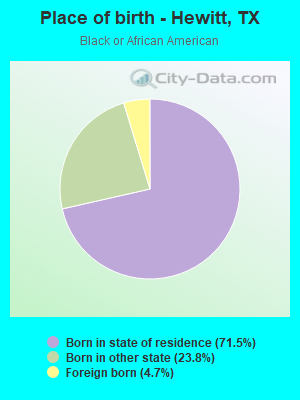
Place of birth - Born in state of residence (%) - Black or African American
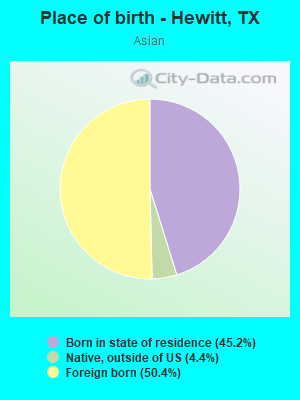
Place of birth - Born in state of residence (%) - Asian
Place of birth - Born in state of residence (%) - Hispanic or Latino
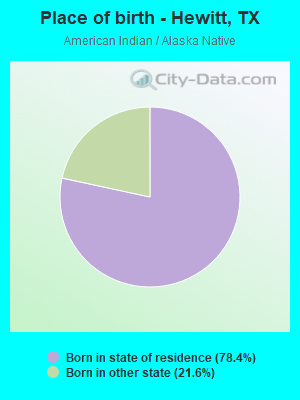
Place of birth - Born in state of residence (%) - American Indian and Alaska Native
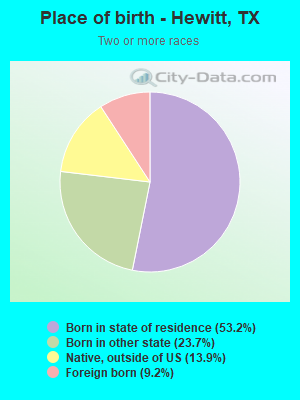
Place of birth - Born in state of residence (%) - Multirace
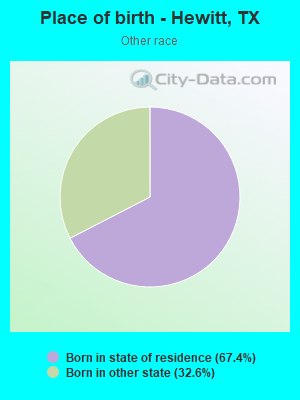
Place of birth - Born in state of residence (%) - Other Race
Place of birth - Born in other state (%)
Place of birth - Born in other state (%) - White
Place of birth - Born in other state (%) - Black or African American
Place of birth - Born in other state (%) - Asian
Place of birth - Born in other state (%) - Hispanic or Latino
Place of birth - Born in other state (%) - American Indian and Alaska Native
Place of birth - Born in other state (%) - Multirace
Place of birth - Born in other state (%) - Other Race
Place of birth - Native, outside of US (%)
Place of birth - Native, outside of US (%) - White
Place of birth - Native, outside of US (%) - Black or African American
Place of birth - Native, outside of US (%) - Asian
Place of birth - Native, outside of US (%) - Hispanic or Latino
Place of birth - Native, outside of US (%) - American Indian and Alaska Native
Place of birth - Native, outside of US (%) - Multirace
Place of birth - Native, outside of US (%) - Other Race
Place of birth - Foreign born (%)
Place of birth - Foreign born (%) - White
Place of birth - Foreign born (%) - Black or African American
Place of birth - Foreign born (%) - Asian
Place of birth - Foreign born (%) - Hispanic or Latino
Place of birth - Foreign born (%) - American Indian and Alaska Native
Place of birth - Foreign born (%) - Multirace
Place of birth - Foreign born (%) - Other Race
Residents speaking English at home (%)
Residents speaking English at home - Born in the United States (%)
Residents speaking English at home - Native, born elsewhere (%)
Residents speaking English at home - Foreign born (%)
Residents speaking Spanish at home (%)
Residents speaking Spanish at home - Born in the United States (%)
Residents speaking Spanish at home - Native, born elsewhere (%)
Residents speaking Spanish at home - Foreign born (%)
Residents speaking other language at home (%)
Residents speaking other language at home - Born in the United States (%)
Residents speaking other language at home - Native, born elsewhere (%)
Residents speaking other language at home - Foreign born (%)
Marital status - Never married (%)
Marital status - Now married (%)
Marital status - Separated (%)
Marital status - Widowed (%)
Marital status - Divorced (%)
Ancestries Reported - Arab (%)
Ancestries Reported - Czech (%)
Ancestries Reported - Danish (%)
Ancestries Reported - Dutch (%)
Ancestries Reported - English (%)
Ancestries Reported - French (%)
Ancestries Reported - French Canadian (%)
Ancestries Reported - German (%)
Ancestries Reported - Greek (%)
Ancestries Reported - Hungarian (%)
Ancestries Reported - Irish (%)
Ancestries Reported - Italian (%)
Ancestries Reported - Lithuanian (%)
Ancestries Reported - Norwegian (%)
Ancestries Reported - Polish (%)
Ancestries Reported - Portuguese (%)
Ancestries Reported - Russian (%)
Ancestries Reported - Scotch-Irish (%)
Ancestries Reported - Scottish (%)
Ancestries Reported - Slovak (%)
Ancestries Reported - Subsaharan African (%)
Ancestries Reported - Swedish (%)
Ancestries Reported - Swiss (%)
Ancestries Reported - Ukrainian (%)
Ancestries Reported - United States (%)
Ancestries Reported - Welsh (%)
Ancestries Reported - West Indian (%)
Ancestries Reported - Other (%)
Geographical mobility - Same house 1 year ago (%)
Geographical mobility - Same house 1 year ago (%) - White
Geographical mobility - Same house 1 year ago (%) - Black or African American
Geographical mobility - Same house 1 year ago (%) - Asian
Geographical mobility - Same house 1 year ago (%) - Hispanic or Latino
Geographical mobility - Same house 1 year ago (%) - American Indian and Alaska Native
Geographical mobility - Same house 1 year ago (%) - Multirace
Geographical mobility - Same house 1 year ago (%) - Other Race
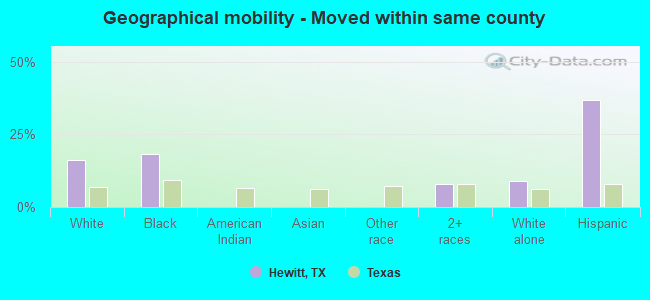
Geographical mobility - Moved within same county (%)
Geographical mobility - Moved within same county (%) - White
Geographical mobility - Moved within same county (%) - Black or African American
Geographical mobility - Moved within same county (%) - Asian
Geographical mobility - Moved within same county (%) - Hispanic or Latino
Geographical mobility - Moved within same county (%) - American Indian and Alaska Native
Geographical mobility - Moved within same county (%) - Multirace
Geographical mobility - Moved within same county (%) - Other Race
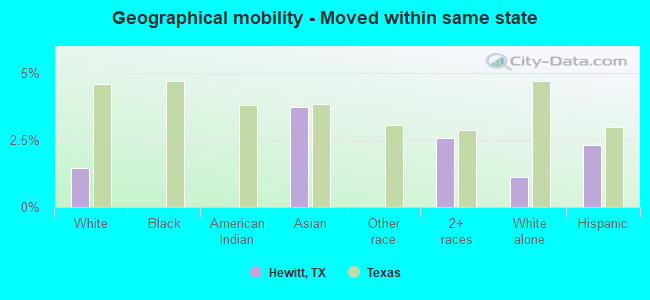
Geographical mobility - Moved from different county within same state (%)
Geographical mobility - Moved from different county within same state (%) - White
Geographical mobility - Moved from different county within same state (%) - Black or African American
Geographical mobility - Moved from different county within same state (%) - Asian
Geographical mobility - Moved from different county within same state (%) - Hispanic or Latino
Geographical mobility - Moved from different county within same state (%) - American Indian and Alaska Native
Geographical mobility - Moved from different county within same state (%) - Multirace
Geographical mobility - Moved from different county within same state (%) - Other Race
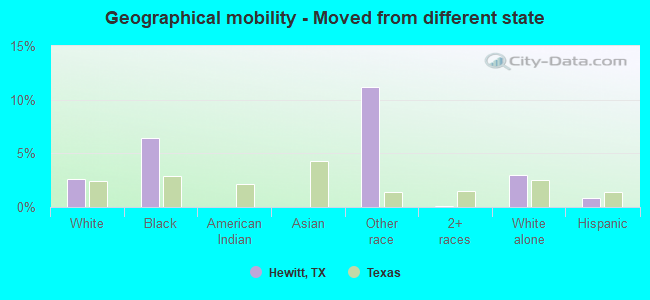
Geographical mobility - Moved from different state (%)
Geographical mobility - Moved from different state (%) - White
Geographical mobility - Moved from different state (%) - Black or African American
Geographical mobility - Moved from different state (%) - Asian
Geographical mobility - Moved from different state (%) - Hispanic or Latino
Geographical mobility - Moved from different state (%) - American Indian and Alaska Native
Geographical mobility - Moved from different state (%) - Multirace
Geographical mobility - Moved from different state (%) - Other Race
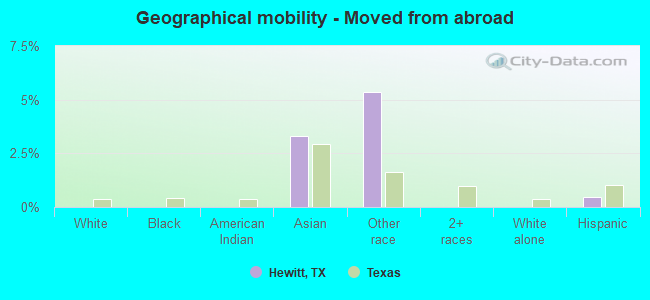
Geographical mobility - Moved from abroad (%)
Geographical mobility - Moved from abroad (%) - White
Geographical mobility - Moved from abroad (%) - Black or African American
Geographical mobility - Moved from abroad (%) - Asian
Geographical mobility - Moved from abroad (%) - Hispanic or Latino
Geographical mobility - Moved from abroad (%) - American Indian and Alaska Native
Geographical mobility - Moved from abroad (%) - Multirace
Geographical mobility - Moved from abroad (%) - Other Race
Place of birth for the foreign-born population - Ireland (%)
Place of birth for the foreign-born population - Denmark (%)
Place of birth for the foreign-born population - Norway (%)
Place of birth for the foreign-born population - Sweden (%)
Place of birth for the foreign-born population - United Kingdom (%)
Place of birth for the foreign-born population - England (%)
Place of birth for the foreign-born population - Scotland (%)
Place of birth for the foreign-born population - Other Northern Europe (%)
Place of birth for the foreign-born population - Austria (%)
Place of birth for the foreign-born population - Belgium (%)
Place of birth for the foreign-born population - France (%)
Place of birth for the foreign-born population - Germany (%)
Place of birth for the foreign-born population - Netherlands (%)
Place of birth for the foreign-born population - Switzerland (%)
Place of birth for the foreign-born population - Other Western Europe (%)
Place of birth for the foreign-born population - Greece (%)
Place of birth for the foreign-born population - Italy (%)
Place of birth for the foreign-born population - Portugal (%)
Place of birth for the foreign-born population - Spain (%)
Place of birth for the foreign-born population - Other Southern Europe (%)
Place of birth for the foreign-born population - Albania (%)
Place of birth for the foreign-born population - Belarus (%)
Place of birth for the foreign-born population - Bosnia and Herzegovina (%)
Place of birth for the foreign-born population - Bulgaria (%)
Place of birth for the foreign-born population - Croatia (%)
Place of birth for the foreign-born population - Czechoslovakia (%)
Place of birth for the foreign-born population - Hungary (%)
Place of birth for the foreign-born population - Latvia (%)
Place of birth for the foreign-born population - Lithuania (%)
Place of birth for the foreign-born population - North Macedonia (Macedonia) (%)
Place of birth for the foreign-born population - Moldova (%)
Place of birth for the foreign-born population - Poland (%)
Place of birth for the foreign-born population - Romania (%)
Place of birth for the foreign-born population - Russia (%)
Place of birth for the foreign-born population - Serbia (%)
Place of birth for the foreign-born population - Ukraine (%)
Place of birth for the foreign-born population - Other Eastern Europe (%)
Place of birth for the foreign-born population - China (%)
Place of birth for the foreign-born population - Hong Kong (%)
Place of birth for the foreign-born population - Taiwan (%)
Place of birth for the foreign-born population - Japan (%)
Place of birth for the foreign-born population - Korea (%)
Place of birth for the foreign-born population - Other Eastern Asia (%)
Place of birth for the foreign-born population - Afghanistan (%)
Place of birth for the foreign-born population - Bangladesh (%)
Place of birth for the foreign-born population - India (%)
Place of birth for the foreign-born population - Iran (%)
Place of birth for the foreign-born population - Kazakhstan (%)
Place of birth for the foreign-born population - Nepal (%)
Place of birth for the foreign-born population - Pakistan (%)
Place of birth for the foreign-born population - Sri Lanka (%)
Place of birth for the foreign-born population - Uzbekistan (%)
Place of birth for the foreign-born population - Other South Central Asia (%)
Place of birth for the foreign-born population - Burma (%)
Place of birth for the foreign-born population - Cambodia (%)
Place of birth for the foreign-born population - Indonesia (%)
Place of birth for the foreign-born population - Laos (%)
Place of birth for the foreign-born population - Malaysia (%)
Place of birth for the foreign-born population - Philippines (%)
Place of birth for the foreign-born population - Singapore (%)
Place of birth for the foreign-born population - Thailand (%)
Place of birth for the foreign-born population - Vietnam (%)
Place of birth for the foreign-born population - Other South Eastern Asia (%)
Place of birth for the foreign-born population - Armenia (%)
Place of birth for the foreign-born population - Iraq (%)
Place of birth for the foreign-born population - Israel (%)
Place of birth for the foreign-born population - Jordan (%)
Place of birth for the foreign-born population - Kuwait (%)
Place of birth for the foreign-born population - Lebanon (%)
Place of birth for the foreign-born population - Saudi Arabia (%)
Place of birth for the foreign-born population - Syria (%)
Place of birth for the foreign-born population - Turkey (%)
Place of birth for the foreign-born population - Yemen (%)
Place of birth for the foreign-born population - Other Western Asia (%)
Place of birth for the foreign-born population - Eritrea (%)
Place of birth for the foreign-born population - Ethiopia (%)
Place of birth for the foreign-born population - Kenya (%)
Place of birth for the foreign-born population - Somalia (%)
Place of birth for the foreign-born population - Uganda (%)
Place of birth for the foreign-born population - Zimbabwe (%)
Place of birth for the foreign-born population - Other Eastern Africa (%)
Place of birth for the foreign-born population - Cameroon (%)
Place of birth for the foreign-born population - Congo (%)
Place of birth for the foreign-born population - Democratic Republic of Congo (Zaire) (%)
Place of birth for the foreign-born population - Other Middle Africa (%)
Place of birth for the foreign-born population - Egypt (%)
Place of birth for the foreign-born population - Morocco (%)
Place of birth for the foreign-born population - Sudan (%)
Place of birth for the foreign-born population - Other Northern Africa (%)
Place of birth for the foreign-born population - South Africa (%)
Place of birth for the foreign-born population - Other Southern Africa (%)
Place of birth for the foreign-born population - Cabo Verde (%)
Place of birth for the foreign-born population - Ghana (%)
Place of birth for the foreign-born population - Liberia (%)
Place of birth for the foreign-born population - Nigeria (%)
Place of birth for the foreign-born population - Senegal (%)
Place of birth for the foreign-born population - Sierra Leone (%)
Place of birth for the foreign-born population - Other Western Africa (%)
Place of birth for the foreign-born population - Australia (%)
Place of birth for the foreign-born population - New Zealand (%)
Place of birth for the foreign-born population - Fiji (%)
Place of birth for the foreign-born population - Micronesia (%)
Place of birth for the foreign-born population - Bahamas (%)
Place of birth for the foreign-born population - Barbados (%)
Place of birth for the foreign-born population - Cuba (%)
Place of birth for the foreign-born population - Dominica (%)
Place of birth for the foreign-born population - Dominican Republic (%)
Place of birth for the foreign-born population - Grenada (%)
Place of birth for the foreign-born population - Haiti (%)
Place of birth for the foreign-born population - Jamaica (%)
Place of birth for the foreign-born population - St. Vincent and the Grenadines (%)
Place of birth for the foreign-born population - Trinidad and Tobago (%)
Place of birth for the foreign-born population - West Indies (%)
Place of birth for the foreign-born population - Other Caribbean (%)
Place of birth for the foreign-born population - Belize (%)
Place of birth for the foreign-born population - Costa Rica (%)
Place of birth for the foreign-born population - El Salvador (%)
Place of birth for the foreign-born population - Guatemala (%)
Place of birth for the foreign-born population - Honduras (%)
Place of birth for the foreign-born population - Mexico (%)
Place of birth for the foreign-born population - Nicaragua (%)
Place of birth for the foreign-born population - Panama (%)
Place of birth for the foreign-born population - Other Central America (%)
Place of birth for the foreign-born population - Argentina (%)
Place of birth for the foreign-born population - Bolivia (%)
Place of birth for the foreign-born population - Brazil (%)
Place of birth for the foreign-born population - Chile (%)
Place of birth for the foreign-born population - Colombia (%)
Place of birth for the foreign-born population - Ecuador (%)
Place of birth for the foreign-born population - Guyana (%)
Place of birth for the foreign-born population - Peru (%)
Place of birth for the foreign-born population - Uruguay (%)
Place of birth for the foreign-born population - Venezuela (%)
Place of birth for the foreign-born population - Other South America (%)
Place of birth for the foreign-born population - Canada (%)
Place of birth for the foreign-born population - Other Northern America (%)
Place of birth for the foreign-born population - Other (%)
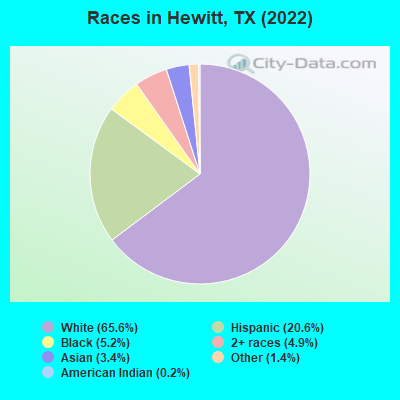
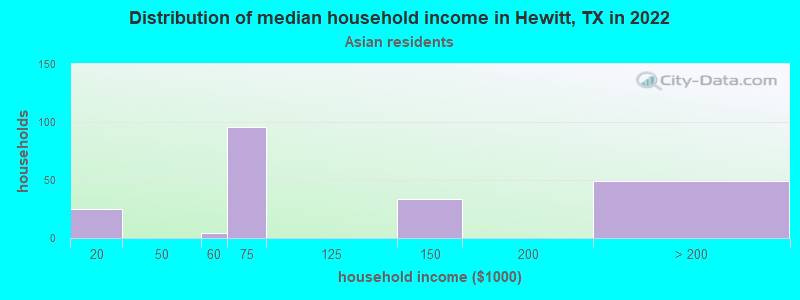
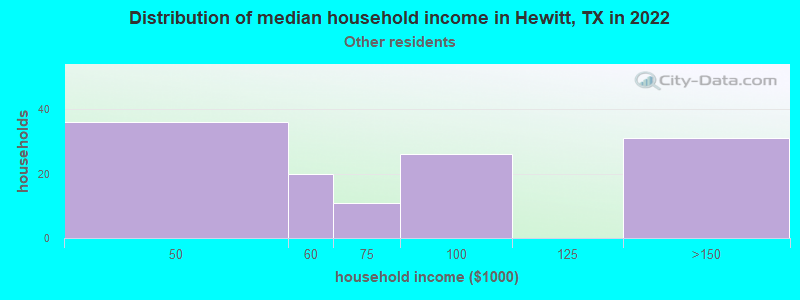
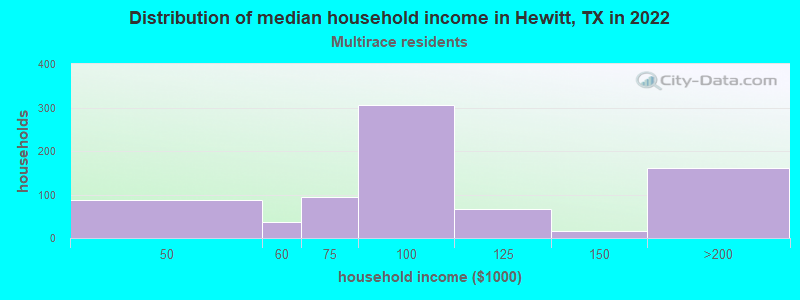
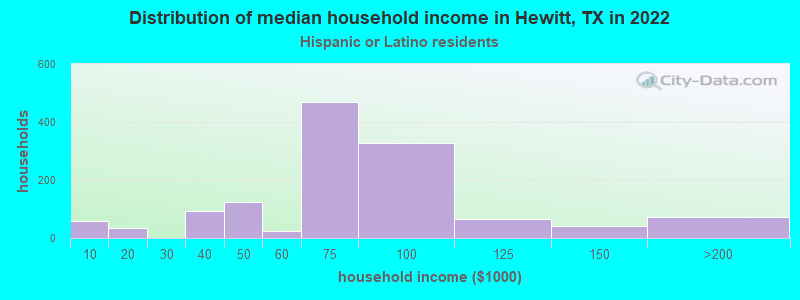
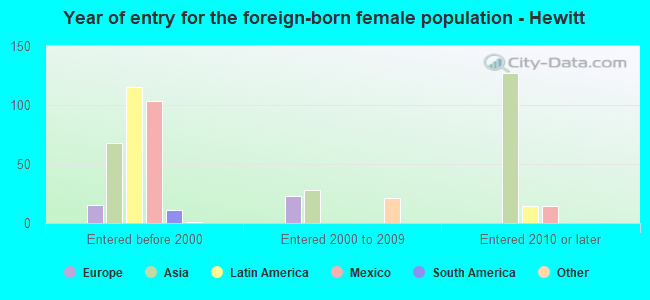
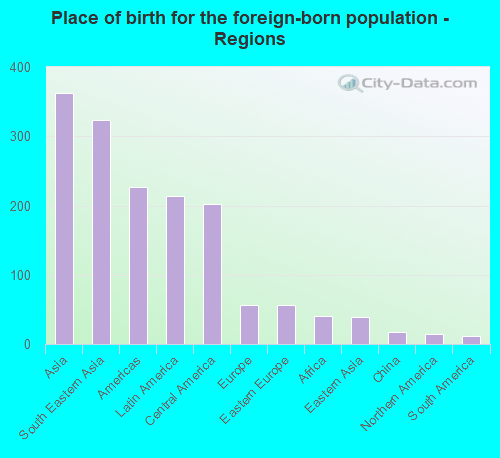
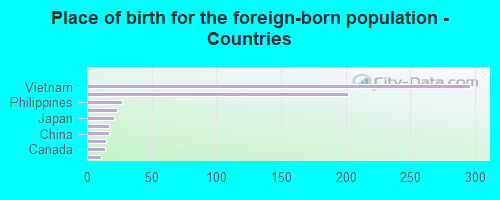
According to 2022 data, the most numerous races in Hewitt, TX are Hispanic (3,371 residents), White alone (10,752 residents), and Black alone (846 residents). 87.1% of Hewitt residents speak English at home. 4.2% of Hewitt, TX residents are foreign-born (2.2% born in Asia, 1.3% born in Latin America), which is 303.7% less than the foreign-born rate of 17.0% across the entire state of Texas.
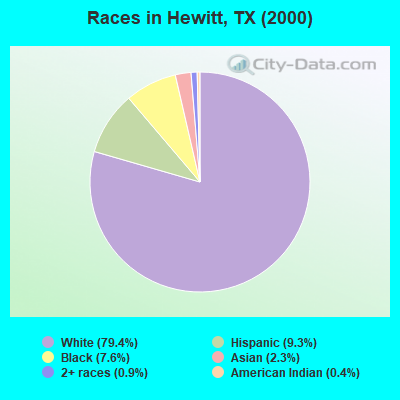
Race distribution in Hewitt
2000 2022
10,933,313 52.4% White alone 6,669,666 32.0% Hispanic 2,364,255 11.3% Black alone 554,445 2.7% Asian alone 230,567 1.1% Two or more races 68,859 0.3% American Indian alone 19,958 0.10% Other race alone 10,757 0.05% Native Hawaiian and Other
12,070,642 40.2% Hispanic 11,683,430 38.9% White alone 3,508,706 11.7% Black alone 1,608,173 5.4% Asian alone 956,560 3.2% Two or more races 125,763 0.4% Other race alone 47,023 0.2% American Indian alone 29,275 0.10% Native Hawaiian and Other
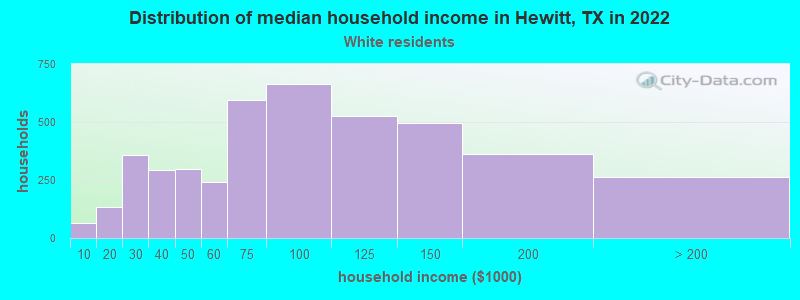
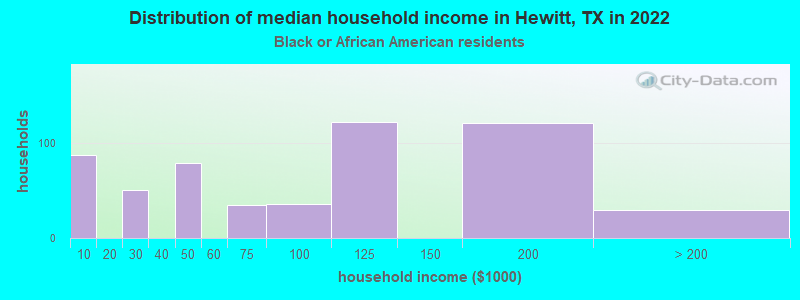
Income and house value in Hewitt Median household income in 2022 $81,987 White non-Hispanic householders$89,513 Black householders$64,591 Asian householders$66,078 Some other race householders$83,697 Two or more races householders$74,103 Hispanic or Latino race householdersMedian 2022 house value $279,928 White Non-Hispanic householders$301,945 Black or African American householders $235,894 Asian householders$221,112 Some other race householders$102,221 Two or more races householders$228,346 Hispanic or Latino householders
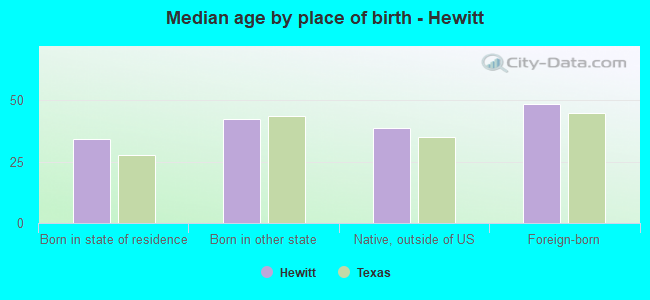
Median age by race in Hewitt
38.4 Median age for White residents38.1 39.1 41.2 Median age for Black or African American residents57.4 37.4 31.1 Median age for American Indian / Alaska Native residents-647,780,924.8 -711,764,705.2 56.8 Median age for Asian residents35.8 75.0 -581,560,283.1 Median age for Native Hawaiian / Pacific Islander residents-612,729,233.5 -577,777,777.2 41.3 Median age for Other race residents23.2 47.1 27.7 Median age for Two or more races residents30.5 24.9 40.6 Median age for White alone residents37.5 42.1 31.8 Median age for Hispanic or Latino residents34.0 24.4
Owner/renter occupied households by race in Hewitt
House owners and renters - White residents 2,997 69.9% Owner occupied1,293 30.1% Renter occupiedHouse owners and renters - Black or African American residents 198 51.1% Owner occupied190 48.9% Renter occupiedHouse owners and renters - Asian residents 171 93.2% Owner occupied13 6.8% Renter occupiedHouse owners and renters - Other race residents 71 65.5% Owner occupied37 34.5% Renter occupiedHouse owners and renters - Two or more races residents 400 53.9% Owner occupied342 46.1% Renter occupiedHouse owners and renters - White alone residents 2,854 72.4% Owner occupied1,087 27.6% Renter occupiedHouse owners and renters - Hispanic or Latino residents 646 49.0% Owner occupied674 51.0% Renter occupied
Language usage in Hewitt
English speakers - Total 87.1% of residents of Hewitt speak English at home.
8.8% of residents speak Spanish at home 662 47.8% Speak English very well724 52.2% Speak English less than very well4.5% of residents speak other language at home 405 56.6% Speak English very well311 43.4% Speak English less than very well
English speakers - Born in the United States 95.5% of residents of Hewitt speak English at home.
3.8% of residents speak Spanish at home 88 47.1% Speak English very well99 52.9% Speak English less than very well0.7% of residents speak other language at home 36 100.0% Speak English very well
English speakers - Native, born elsewhere 25.6% of residents of Hewitt speak English at home.
102.1% of residents speak Spanish at home 77 22.7% Speak English very well262 77.3% Speak English less than very well
English speakers - Foreign-born 13.4% of residents of Hewitt speak English at home.
26.6% of residents speak Spanish at home 10 5.7% Speak English very well165 94.3% Speak English less than very well51.9% of residents speak other language at home 134 39.3% Speak English very well207 60.7% Speak English less than very well
White (Caucasian) - Speak only English Native:
99.6% (11,035)Foreign-born:
65.9% (39)
White (Caucasian) - Speak another language Native:
2.5% (276)Foreign-born:
62.8% (37)
Asian - Speak only English Native:
12.6% (26)Foreign-born:
8.3% (30)
Asian - Speak another language Native:
100.0% (203)Foreign-born:
90.4% (328)
Two or more races - Speak only English Native:
43.8% (971)Foreign-born:
13.0% (32)
Two or more races - Speak another language Native:
54.3% (1,202)Foreign-born:
78.0% (191)
White alone - Speak only English Native:
97.8% (10,173)Foreign-born:
93.5% (45)
White alone - Speak another language Native:
2.2% (230)Foreign-born:
64.4% (31)
Hispanic or Latino - Speak only English Native:
69.5% (2,102)Foreign-born:
15.7% (33)
Hispanic or Latino - Speak another language Native:
33.4% (1,011)Foreign-born:
83.2% (175)
Foreign-born residents in Hewitt 690 residents are foreign born (2.2% Asia , 1.3% Latin America ).
This city:
4.2%Texas:
17.1%
Marital status for residents in Hewitt Marital status - White (Caucasian) population 15 years and over
Males 31.8% Never married60.7% Now married0.0% Separated2.8% Widowed4.7% DivorcedFemales 24.3% Never married54.9% Now married0.0% Separated10.7% Widowed10.2% DivorcedWomen who gave birth in the past 12 months Now married:
100.0% (51)Unmarried:
0.0% (0)
Women who did not give birth in the past 12 months Now married:
53.4% (1,456)Unmarried:
46.6% (1,270)
Marital status - Black or African American population 15 years and over
Males 15.9% Never married84.1% Now married0.0% Separated0.0% Widowed0.0% DivorcedFemales 28.6% Never married52.9% Now married0.0% Separated5.7% Widowed12.8% DivorcedWomen who did not give birth in the past 12 months Now married:
41.9% (146)Unmarried:
58.1% (202)
Marital status - American Indian / Alaska Native population 15 years and over
Males 100.0% Never married0.0% Now married0.0% Separated0.0% Widowed0.0% DivorcedFemales 100.0% Never married0.0% Now married0.0% Separated0.0% Widowed0.0% DivorcedWomen who did not give birth in the past 12 months Now married:
0.0% (0)Unmarried:
100.0% (40)
Marital status - Asian population 15 years and over
Males 43.2% Never married56.8% Now married0.0% Separated0.0% Widowed0.0% DivorcedFemales 0.0% Never married78.9% Now married0.0% Separated12.9% Widowed8.1% DivorcedWomen who did not give birth in the past 12 months Now married:
73.4% (51)Unmarried:
26.6% (18)
Marital status - Other race population 15 years and over
Males 55.3% Never married44.7% Now married0.0% Separated0.0% Widowed0.0% DivorcedFemales 9.3% Never married59.3% Now married0.0% Separated14.0% Widowed17.4% DivorcedWomen who did not give birth in the past 12 months Now married:
70.0% (32)Unmarried:
30.0% (14)
Marital status - Two or more races population 15 years and over
Males 30.7% Never married54.5% Now married3.2% Separated0.0% Widowed11.7% DivorcedFemales 59.4% Never married22.9% Now married0.0% Separated1.9% Widowed15.8% DivorcedWomen who did not give birth in the past 12 months Now married:
25.3% (189)Unmarried:
74.7% (558)
Marital status - White alone, not Hispanic / Latino population 15 years and over
Males 28.2% Never married63.7% Now married0.0% Separated3.3% Widowed4.9% DivorcedFemales 24.8% Never married54.0% Now married0.0% Separated10.1% Widowed11.1% DivorcedWomen who gave birth in the past 12 months Now married:
100.0% (60)Unmarried:
0.0% (0)
Women who did not give birth in the past 12 months Now married:
49.5% (1,372)Unmarried:
50.5% (1,398)
Marital status - Hispanic or Latino population 15 years and over
Males 42.1% Never married49.3% Now married1.4% Separated0.0% Widowed7.2% DivorcedFemales 39.7% Never married44.9% Now married0.0% Separated9.9% Widowed5.4% DivorcedWomen who did not give birth in the past 12 months Now married:
53.9% (470)Unmarried:
46.1% (403)
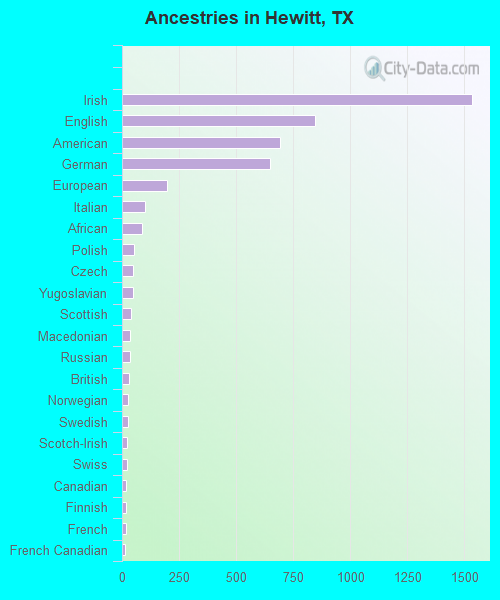
Ancestries in Hewitt
1,531 19.6% Irish845 10.8% English694 8.9% American649 8.3% German196 2.5% European99 1.3% Italian86 1.1% African52 0.7% Polish50 0.6% Czech46 0.6% Yugoslavian40 0.5% Scottish36 0.5% Macedonian36 0.5% Russian30 0.4% British27 0.3% Norwegian27 0.3% Swedish22 0.3% Scotch-Irish22 0.3% Swiss16 0.2% Canadian16 0.2% Finnish16 0.2% French14 0.2% French Canadian11 0.1% Welsh
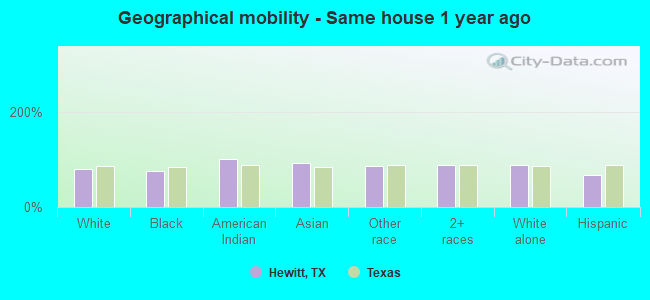
Geographical mobility in Hewitt Same house 1 year ago 9,078 80.4% White (Caucasian)687 74.7% Black or African American56 100.0% American Indian / Alaska Native557 93.0% Asian324 86.4% Other race2,405 88.4% Two or more races9,344 86.6% White alone, not Hispanic / Latino2,252 66.8% Hispanic or LatinoMoved within same county 1,819 16.1% White / Caucasian168 18.2% Black or African American212 7.8% Two or more races981 9.1% White alone, not Hispanic / Latino1,249 37.0% Hispanic or LatinoMoved within same state 165 1.5% White / Caucasian22 3.7% Asian70 2.6% Two or more races120 1.1% White alone, not Hispanic / Latino79 2.3% Hispanic or LatinoMoved from different state 297 2.6% White / Caucasian59 6.4% Black or African American42 11.1% Other race3 0.1% Two or more races324 3.0% White alone, not Hispanic / Latino29 0.9% Hispanic or LatinoMoved from abroad 20 3.3% Asian20 5.4% Other race15 0.4% Hispanic or Latino
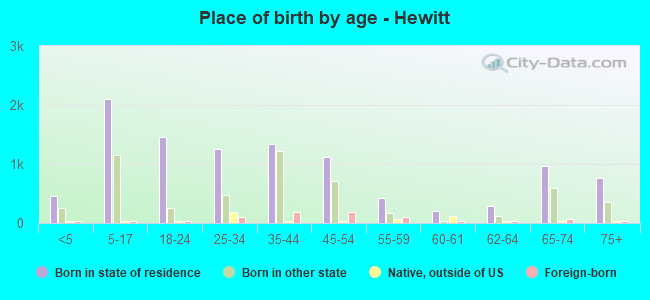
Children Nativity (place of birth) in Hewitt
Children under 6 years - Living with two parents Both parents native 490 100.0% NativeBoth parents foreign-born 18 100.0% NativeChildren under 6 years - Living with one parent Native parent 343 100.0% NativeChildren 6 to 17 years - Living with two parents Both parents native 2,236 100.0% NativeBoth parents foreign-born 93 100.0% NativeOne native, one foreign-born parent 28 100.0% NativeChildren 6 to 17 years - Living with one parent Native parent 554 100.0% NativeForeign-born parent 79 55.1% Native64 44.9% Foreign-born
Grandparents responsible for own grandchildren in Hewitt
Grandparents (30 to 59 years) White / Caucasian 82 78.2% Responsible for grandchildren23 21.8% Not responsible for grandchildrenWhite alone, not Hispanic / Latino 95 74.8% Responsible for grandchildren32 25.2% Not responsible for grandchildrenGrandparents (60 years and over) White / Caucasian 50 45.2% Responsible for grandchildren61 54.8% Not responsible for grandchildrenWhite alone, not Hispanic / Latino 59 43.0% Responsible for grandchildren78 57.0% Not responsible for grandchildren