Estimated zip code population in 2022: 41,866 Zip code population in 2010: 35,015 Zip code population in 2000: 29,449
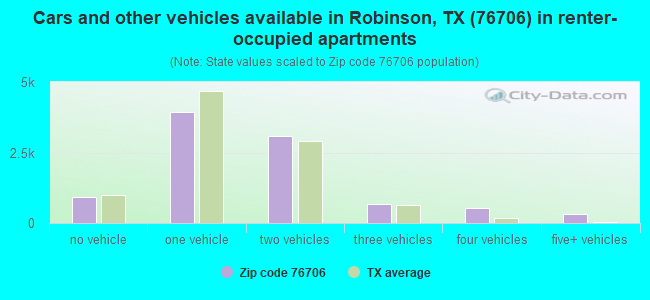
Houses and condos: 17,167 Renter-occupied apartments: 9,500
% of renters here:
62%
State:
38%
March 2022 cost of living index in zip code 76706: 86.1 (less than average, U.S. average is 100)
Land area: 70.9 sq. mi. Water area: 1.4 sq. mi.
Population density: 590 people per square mile
(low).
OSM Map
General Map
Google Map
MSN Map
OSM Map
General Map
Google Map
MSN Map
OSM Map
General Map
Google Map
MSN Map
OSM Map
General Map
Google Map
MSN Map
Please wait while loading the map...
Real estate property taxes paid for housing units in 2022:
This zip code:
1.6% ($2,981)
Texas:
1.5% ($4,050)
Median real estate property taxes paid for housing units with mortgages in 2022: $4,351 (1.7%) Median real estate property taxes paid for housing units with no mortgage in 2022: $2,207 (1.8%)
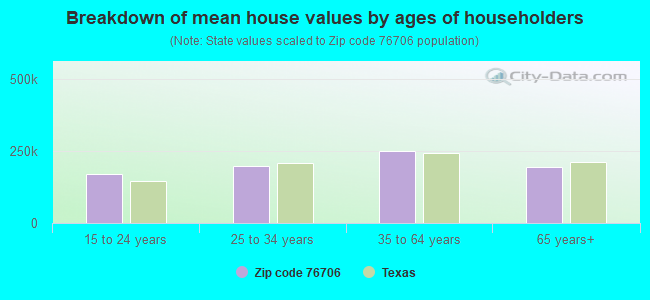
Estimated median house/condo value in 2022: $188,499
76706:
$188,499
Texas:
$275,400
According to our research of Texas and other state lists, there were 94 registered sex offenders living in 76706 zip code as of May 16, 2024. The ratio of all residents to sex offenders in zip code 76706 is 400 to 1. The ratio of registered sex offenders to all residents in this zip code is near the state average.
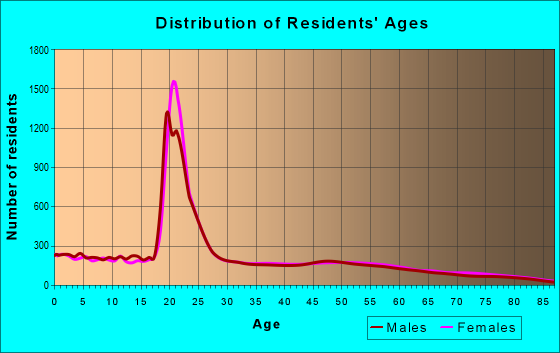
Median resident age:
This zip code:
23.7 years
Texas median age:
35.6 years
Average household size:
This zip code:
2.6 people
Texas:
2.6 people
Averages for the 2020 tax year for zip code 76706, filed in 2021:
Average Adjusted Gross Income (AGI) in 2020: $45,576 (Individual Income Tax Returns)
Here:
$45,576
State:
$77,054
Salary/wage: $40,547 (reported on 88.3% of returns)
Here:
$40,547
State:
$62,766
(% of AGI for various income ranges: 1232.1% for AGIs below $25k, 3661.7% for AGIs $25k-50k, 6546.1% for AGIs $50k-75k, 9370.6% for AGIs $75k-100k, 17306.9% for AGIs $100k-200k, 63711.4% for AGIs over 200k)
Taxable interest for individuals: $853 (reported on 18.5% of returns)
This zip code:
$853
Texas:
$2,665
(% of AGI for various income ranges: 5.5% for AGIs below $25k, 9.5% for AGIs $25k-50k, 32.7% for AGIs $50k-75k, 41.2% for AGIs $75k-100k, 55.2% for AGIs $100k-200k, 750.0% for AGIs over 200k)
Ordinary dividends: $3,070 (reported on 8.4% of returns)
Here:
$3,070
State:
$10,044
(% of AGI for various income ranges: 7.1% for AGIs below $25k, 10.4% for AGIs $25k-50k, 27.2% for AGIs $50k-75k, 62.9% for AGIs $75k-100k, 80.8% for AGIs $100k-200k, 2208.6% for AGIs over 200k)
Net capital gain/loss in AGI: +$9,622 (reported on 8.5% of returns)
Here:
+$9,622
State:
+$39,590
(% of AGI for various income ranges: 5.7% for AGIs below $25k, 15.1% for AGIs $25k-50k, 43.1% for AGIs $50k-75k, 97.0% for AGIs $75k-100k, 432.8% for AGIs $100k-200k, 9178.6% for AGIs over 200k)
Profit/loss from business: +$11,040 (reported on 13.8% of returns)
Here:
+$11,040
State:
+$10,888
(% of AGI for various income ranges: 81.9% for AGIs below $25k, 84.9% for AGIs $25k-50k, 212.2% for AGIs $50k-75k, 252.6% for AGIs $75k-100k, 737.0% for AGIs $100k-200k, 6794.3% for AGIs over 200k)
Taxable individual retirement arrangement distribution: $17,377 (reported on 4.9% of returns)
76706:
$17,377
Texas:
$24,740
(% of AGI for various income ranges: 20.6% for AGIs below $25k, 37.9% for AGIs $25k-50k, 138.2% for AGIs $50k-75k, 211.7% for AGIs $75k-100k, 616.8% for AGIs $100k-200k, 2827.1% for AGIs over 200k)
Total itemized deductions: $32,389 (reported on 2.7% of returns)
Here:
$32,389
State:
$40,428
(% of AGI for various income ranges: 15.5% for AGIs below $25k, 26.5% for AGIs $25k-50k, 146.7% for AGIs $50k-75k, 191.6% for AGIs $75k-100k, 529.6% for AGIs $100k-200k, 5111.4% for AGIs over 200k)
Charity contributions: $13,917 (reported on 2.1% of returns)
Here:
$13,917
State:
$18,201
(% of AGI for various income ranges: 7.4% for AGIs $25k-50k, 22.2% for AGIs $50k-75k, 43.2% for AGIs $75k-100k, 187.7% for AGIs $100k-200k, 2848.6% for AGIs over 200k)
Taxes paid: $6,734 (reported on 2.7% of returns)
76706:
$6,734
State:
$7,821
(% of AGI for various income ranges: 2.6% for AGIs below $25k, 4.9% for AGIs $25k-50k, 28.7% for AGIs $50k-75k, 46.7% for AGIs $75k-100k, 130.0% for AGIs $100k-200k, 905.7% for AGIs over 200k)
Earned income credit: $2,546 (reported on 23.1% of returns)
Here:
$2,546
State:
$2,584
(% of AGI for various income ranges: 111.0% for AGIs below $25k, 82.9% for AGIs $25k-50k, 1.6% for AGIs $50k-75k)
Percentage of individuals using paid preparers for their 2020 taxes: 92.6%
Here:
93%
State:
92%
(% for various income ranges: 92.3% for AGIs below $25k, 92.8% for AGIs $25k-50k, 92.7% for AGIs $50k-75k, 92.6% for AGIs $75k-100k, 94.0% for AGIs $100k-200k, 91.3% for AGIs over 200k)
Averages for the 2012 tax year for zip code 76706, filed in 2013:
Average Adjusted Gross Income (AGI) in 2012: $36,745 (Individual Income Tax Returns)
Here:
$36,745
State:
$65,384
Salary/wage: $32,988 (reported on 89.7% of returns)
Here:
$32,988
State:
$52,524
(% of AGI for various income ranges: 85.6% for AGIs below $25k, 86.9% for AGIs $25k-50k, 80.4% for AGIs $50k-75k, 82.0% for AGIs $75k-100k, 79.9% for AGIs $100k-200k, 47.3% for AGIs over 200k)
Taxable interest for individuals: $990 (reported on 21.0% of returns)
This zip code:
$990
Texas:
$2,372
(% of AGI for various income ranges: 0.7% for AGIs below $25k, 0.4% for AGIs $25k-50k, 0.5% for AGIs $50k-75k, 0.5% for AGIs $75k-100k, 0.7% for AGIs $100k-200k, 1.0% for AGIs over 200k)
Ordinary dividends: $2,757 (reported on 8.4% of returns)
Here:
$2,757
State:
$9,721
(% of AGI for various income ranges: 0.7% for AGIs below $25k, 0.3% for AGIs $25k-50k, 0.7% for AGIs $50k-75k, 0.5% for AGIs $75k-100k, 0.8% for AGIs $100k-200k, 1.2% for AGIs over 200k)
Net capital gain/loss in AGI: +$11,877 (reported on 6.3% of returns)
Here:
+$11,877
State:
+$35,319
(% of AGI for various income ranges: 0.2% for AGIs $25k-50k, 0.5% for AGIs $50k-75k, 0.3% for AGIs $75k-100k, 1.1% for AGIs $100k-200k, 21.7% for AGIs over 200k)
Profit/loss from business: +$9,206 (reported on 12.2% of returns)
Here:
+$9,206
State:
+$13,732
(% of AGI for various income ranges: 5.4% for AGIs below $25k, 2.2% for AGIs $25k-50k, 1.9% for AGIs $50k-75k, 2.3% for AGIs $75k-100k, 3.9% for AGIs $100k-200k, 1.8% for AGIs over 200k)
Taxable individual retirement arrangement distribution: $11,965 (reported on 6.0% of returns)
76706:
$11,965
Texas:
$19,511
(% of AGI for various income ranges: 1.4% for AGIs below $25k, 1.5% for AGIs $25k-50k, 2.0% for AGIs $50k-75k, 2.2% for AGIs $75k-100k, 2.2% for AGIs $100k-200k, 3.4% for AGIs over 200k)
Total itemized deductions: $19,267 (21% of AGI, reported on 11.5% of returns)
Here:
$19,267
State:
$24,724
Here:
20.7% of AGI
State:
15.9% of AGI
(% of AGI for various income ranges: 2.4% for AGIs below $25k, 4.1% for AGIs $25k-50k, 6.6% for AGIs $50k-75k, 7.2% for AGIs $75k-100k, 9.4% for AGIs $100k-200k, 8.2% for AGIs over 200k)
Charity contributions: $5,721 (reported on 8.4% of returns)
Here:
$5,721
State:
$6,808
(% of AGI for various income ranges: 0.2% for AGIs below $25k, 0.5% for AGIs $25k-50k, 1.0% for AGIs $50k-75k, 1.4% for AGIs $75k-100k, 2.5% for AGIs $100k-200k, 3.9% for AGIs over 200k)
Taxes paid: $4,961 (reported on 11.3% of returns)
76706:
$4,961
State:
$6,921
(% of AGI for various income ranges: 0.4% for AGIs below $25k, 0.9% for AGIs $25k-50k, 1.6% for AGIs $50k-75k, 2.0% for AGIs $75k-100k, 2.8% for AGIs $100k-200k, 1.9% for AGIs over 200k)
Earned income credit: $2,598 (reported on 29.3% of returns)
Here:
$2,598
State:
$2,570
(% of AGI for various income ranges: 9.4% for AGIs below $25k, 1.6% for AGIs $25k-50k)
Percentage of individuals using paid preparers for their 2012 taxes: 41.1%
Here:
41%
State:
51%
(% for various income ranges: 39.8% for AGIs below $25k, 39.2% for AGIs $25k-50k, 45.2% for AGIs $50k-75k, 43.4% for AGIs $75k-100k, 46.3% for AGIs $100k-200k, 77.8% for AGIs over 200k)
Averages for the 2004 tax year for zip code 76706, filed in 2005:
Average Adjusted Gross Income (AGI) in 2004: $28,717 (Individual Income Tax Returns)
Here:
$28,717
State:
$47,881
Salary/wage: $26,634 (reported on 89.3% of returns)
Here:
$26,634
State:
$41,947
(% of AGI for various income ranges: 118.9% for AGIs below $10k, 86.8% for AGIs $10k-25k, 84.4% for AGIs $25k-50k, 83.1% for AGIs $50k-75k, 84.0% for AGIs $75k-100k, 66.5% for AGIs over 100k)
Taxable interest for individuals: $1,454 (reported on 26.8% of returns)
This zip code:
$1,454
Texas:
$2,255
(% of AGI for various income ranges: 3.0% for AGIs below $10k, 1.0% for AGIs $10k-25k, 1.2% for AGIs $25k-50k, 1.1% for AGIs $50k-75k, 0.6% for AGIs $75k-100k, 2.5% for AGIs over 100k)
Taxable dividends: $1,719 (reported on 10.2% of returns)
Here:
$1,719
State:
$4,261
(% of AGI for various income ranges: 1.1% for AGIs below $10k, 0.3% for AGIs $10k-25k, 0.3% for AGIs $25k-50k, 0.6% for AGIs $50k-75k, 0.7% for AGIs $75k-100k, 1.1% for AGIs over 100k)
Net capital gain/loss: +$4,054 (reported on 8.3% of returns)
Here:
+$4,054
State:
+$16,110
(% of AGI for various income ranges: -0.1% for AGIs below $10k, 0.2% for AGIs $10k-25k, 0.2% for AGIs $25k-50k, 0.8% for AGIs $50k-75k, 1.0% for AGIs $75k-100k, 4.8% for AGIs over 100k)
Profit/loss from business: +$7,944 (reported on 12.3% of returns)
Here:
+$7,944
State:
+$11,013
(% of AGI for various income ranges: 1.4% for AGIs below $10k, 3.9% for AGIs $10k-25k, 3.2% for AGIs $25k-50k, 2.4% for AGIs $50k-75k, 2.7% for AGIs $75k-100k, 5.3% for AGIs over 100k)
IRA payment deduction: $3,117 (reported on 1.3% of returns)
76706:
$3,117
Texas:
$3,120
(% of AGI for various income ranges: 0.1% for AGIs $10k-25k, 0.2% for AGIs $25k-50k, 0.2% for AGIs $50k-75k, 0.2% for AGIs $75k-100k, 0.1% for AGIs over 100k)
Self-employed pension: $9,565 (reported on 0.2% of returns)
Here:
$9,565
Texas:
$16,401
Total itemized deductions: $16,023 (22% of AGI, reported on 10.8% of returns)
Here:
$16,023
State:
$19,631
Here:
22.1% of AGI
State:
18.9% of AGI
(% of AGI for various income ranges: 2.8% for AGIs below $10k, 2.7% for AGIs $10k-25k, 4.5% for AGIs $25k-50k, 6.3% for AGIs $50k-75k, 9.5% for AGIs $75k-100k, 9.6% for AGIs over 100k)
Charity contributions deductions: $4,715 (6% of AGI, reported on 8.6% of returns)
Here:
$4,715
State:
$4,753
Here:
6.1% of AGI
State:
4.2% of AGI
(% of AGI for various income ranges: 0.3% for AGIs below $10k, 0.4% for AGIs $10k-25k, 0.8% for AGIs $25k-50k, 1.1% for AGIs $50k-75k, 2.2% for AGIs $75k-100k, 3.5% for AGIs over 100k)
Total tax: $4,047 (reported on 59.4% of returns)
76706:
$4,047
State:
$9,058
(% of AGI for various income ranges: 2.2% for AGIs below $10k, 3.0% for AGIs $10k-25k, 6.0% for AGIs $25k-50k, 8.8% for AGIs $50k-75k, 10.6% for AGIs $75k-100k, 17.4% for AGIs over 100k)
Earned income credit: $2,036 (reported on 30.0% of returns)
Here:
$2,036
State:
$2,024
Percentage of individuals using paid preparers for their 2004 taxes: 52.6%
Here:
53%
State:
57%
(% for various income ranges: 47.1% for AGIs below $10k, 57.5% for AGIs $10k-25k, 53.7% for AGIs $25k-50k, 48.5% for AGIs $50k-75k, 48.5% for AGIs $75k-100k, 62.2% for AGIs over 100k)
Likely homosexual households (counted as self-reported same-sex unmarried-partner households)
Lesbian couples: 0.0% of all households
Gay men: 0.0% of all households
Household received Food Stamps/SNAP in the past 12 months: 2,021 Household did not receive Food Stamps/SNAP in the past 12 months: 13,203
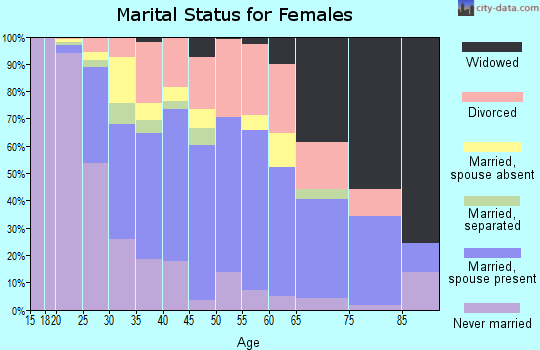
Women who had a birth in the past 12 months: 667 (443 now married, 223 unmarried) Women who did not have a birth in the past 12 months: 12,512 (2,848 now married, 9,747 unmarried)
Housing units in zip code 76706 with a mortgage: 2,479 (76 second mortgage, 57 both second mortgage and home equity loan) Houses without a mortgage: 70
Median monthly owner costs for units with a mortgage: $1,734 Median monthly owner costs for units without a mortgage: $603
Residents with income below the poverty level in 2022:
This zip code:
33.5%
Whole state:
14.0%
Residents with income below 50% of the poverty level in 2022:
This zip code:
12.2%
Whole state:
7.4%
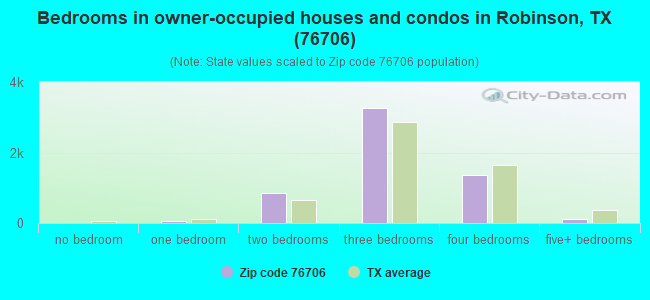
Median number of rooms in houses and condos:
Here:
6.0
State:
6.3
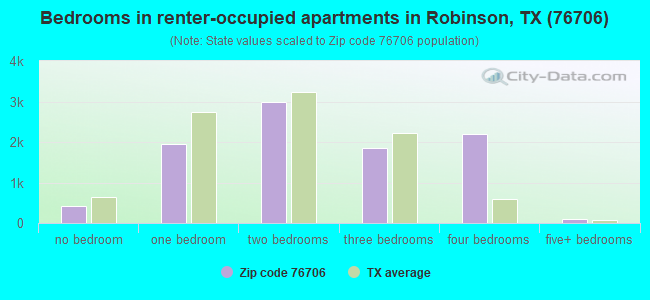
Median number of rooms in apartments:
Here:
4.3
State:
4.0
Notable locations in this zip code not listed on our city pages
Notable locations in zip code 76706: Historic Waco Foundation (A), Governor Bill and Vara Daniel Historic Village (B), Strecker Museum Complex (C), Texas Sports Hall of Fame (D), Robinson Volunteer Fire Department Station 1 (E), Waco Fire Department Station 1 (F), Waco Fire Department Station 4 (G), Robinson Volunteer Fire Department Station 2 (H). Display/hide their locations on the map
Churches in zip code 76706 include: Asbury Church (A), Cornerstone Church (B), Emmanuel Church (C), Kendall Church (D), Mount Olive Church (E), Asbury Church (F), Waco Spanish Seventh Day Adventist Church (G), Saint Pauls Church (H), Victory Temple Assembly of God Church (I). Display/hide their locations on the map
Cemeteries: Rosemound Cemetery (1), Oakwood Cemetery (2), Jacob-Sholom Cemetery (3), Restland Cemetery (4), Fletcher Cemetery (5), Mount Olive Cemetery (6), Mount Pleasant Cemetery (7). Display/hide their locations on the map
Reservoirs: Soil Conservation Service Site 1 Reservoir (A), Soil Conservation Service Site 2 Reservoir (B), Soil Conservation Service Site 3 Reservoir (C), Soil Conservation Service Site 6 Reservoir (D), Eastland Lake (E), Willow Lake (F). Display/hide their locations on the map
Creeks: Castleman Creek (A), Waco Creek (B), Chambers Creek (C), Flat Creek (D), Crow Creek (E), Cottonwood Creek (F). Display/hide their locations on the map
Parks in zip code 76706 include: Baylor Ball Park (1), Kiwanis Field (2), Kathy Ball Park (3), Waco Municipal Stadium (4), Betty Lou Mays Soccer Field (5), Getterman Stadium (6), The Ferrell Center (7), Baylor Ballpark (8), Alta Vista Park (9). Display/hide their locations on the map
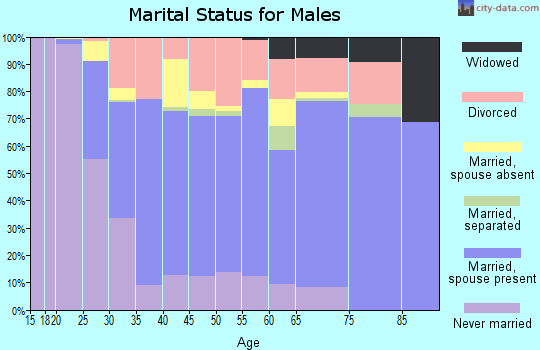
4,205 married couples with children.
2,802 single-parent households (741 men, 2,061 women).
76.2% of residents of 76706 zip code speak English at home.
19.8% of residents speak Spanish at home (44% very well, 34% well, 14% not well, 8% not at all).
1.4% of residents speak other Indo-European language at home (96% very well, 4% well).
1.2% of residents speak Asian or Pacific Island language at home (39% very well, 52% well, 8% not well, 1% not at all).
0.9% of residents speak other language at home (27% very well, 72% well, 1% not well).
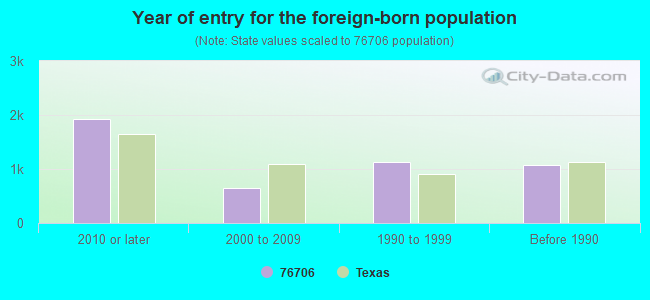
Foreign born population: 4,096 (9.8%) (20.8% of them are naturalized citizens)
Housing units lacking complete plumbing facilities: 0.9% Housing units lacking complete kitchen facilities: 2.0%
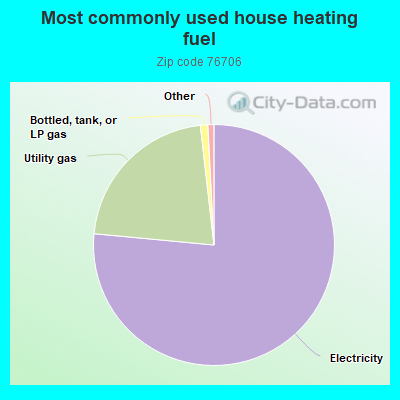
76.5%Electricity
21.7%Utility gas
1.0%Bottled, tank, or LP gas
Population in 1990: 31,263.
Place of birth for U.S.-born residents:
This state: 26,675
Northeast: 968
Midwest: 2,506
South: 3,287
West: 3,723
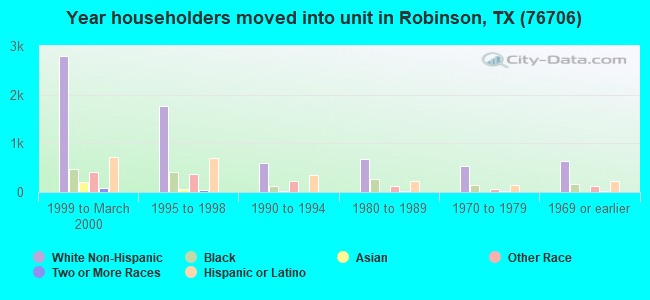
43% of the 76706 zip code residents lived in the same house 5 years ago. Out of people who lived in different houses, 48% lived in this county. Out of people who lived in different counties, 50% lived in Texas.
86% of the 76706 zip code residents lived in the same house 1 year ago. Out of people who lived in different houses, 45% moved from this county. Out of people who lived in different houses, 25% moved from different county within same state. Out of people who lived in different houses, 19% moved from different state. Out of people who lived in different houses, 12% moved from abroad.
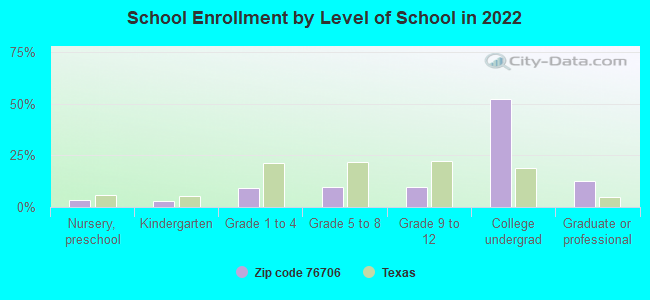
Private vs. public school enrollment:
Students in private schools in grades 1 to 8 (elementary and middle school): 302
Here:
9.0%
Texas:
8.8%
Students in private schools in grades 9 to 12 (high school): 183
Here:
10.3%
Texas:
8.0%
Students in private undergraduate colleges: 7,999
Here:
84.4%
Texas:
16.2%
Occupation by median earnings in the past 12 months ($)
94,670Legal occupations
81,795Health diagnosing and treating practitioners and other technical occupations
72,982Computer and mathematical occupations
62,356Transportation occupations
56,083Architecture and engineering occupations
55,956Management occupations
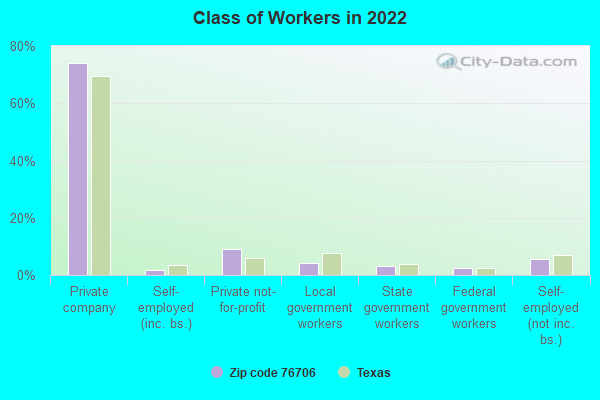
Companies with federal contracts located in this zip code (WACO, TX):
BAYLOR UNIVERSITY (700 S UNIVERSITY PARKS DR) : $4,534,398 in 46 contractsfrom 2000 to 2006
Contracts for Tuition, Registration, and Membership Fees, Certifications and Accreditations for Educational Institutions, Educational Services, Education Services, and moreby Air Force, Army, Centers for Disease Control and Prevention, Geological Survey, and others Signed by year:2000: $683,692; 2001: $508,857; 2002: $598,299; 2003: $692,229; 2004: $1,766,453; 2005: $280,958; 2006: $3,910.
Biggest contracts:
$532,679 with Air Force for Tuition, Registration, and Membership Fees. Signed on 2004-03-24. Completion date: 2004-09-30.
$514,888, same as above.Signed on 2004-08-31. Completion date: 2004-09-30.
$449,240, same as above.Signed on 2004-12-16. Completion date: 2005-09-30.
$397,030, same as above.Signed on 2003-09-27. Completion date: 2003-09-30.
REDDY ICE CORPORATION (421 S 9TH ST) : $297,211 in 31 contractsfrom 1999 to 2005
Contracts for Special Dietary Foods and Food Specialty Preparations, Dairy Foods and Eggs, Beverages, Nonalcoholic, Composite Food Packages by Army Signed by year:2000: $33,797; 2001: $223,040; 2002: -$6,213; 2003: $0; 2004: $0; 2005: -$5,143; 2006: $0.
Biggest contracts:
$94,590 with Army for Special Dietary Foods and Food Specialty Preparations. Signed on 2001-08-11. Completion date: 2001-07-31.
$84,465, same as above.Signed on 2001-07-23. Completion date: 2001-06-30.
$65,715, same as above.Signed on 2000-09-09. Completion date: 2000-09-30.
$55,340 with Army for Dairy Foods and Eggs. Signed on 1999-10-18. Completion date: 1999-10-31.
STEWART & STEVENSON SERVICES, (1247 SUN VALLEY RD)
$93,106 with Army for Warehouse Trucks and Tractors, Self-Propelled. Signed on 2003-08-20. Completion date: 2003-12-31.
DUNCAN TRUCK SALES COMPANY (3333 INTERSTATE 35 S; small business)
$39,800 with Army for Tractors, Full Tracked, Low Speed. Signed on 2001-09-13. Completion date: 2002-01-07.
APS FREEFLIGHT SYSTEMS, LTD (3700 S INTERSTATE 35; small business) 50 employees, $0 revenue. : $29,901 in 6 contractsfrom 2003 to 2005
Contracts for Radio Navigation Equipment, Airborne, Navigational Instruments, Other Defense -- Applied Research and Exploratory Development (R&D) by Army, Navy Signed by year:2000: $0; 2001: $0; 2002: $0; 2003: $13,756; 2004: $0; 2005: $16,145; 2006: $0.
Biggest contracts:
$8,306 with Army for Radio Navigation Equipment, Airborne. Signed on 2003-05-14. Completion date: 2003-05-21.
$8,095 with Army for Navigational Instruments. Signed on 2005-03-11. Completion date: 2005-03-31.
$8,095, same as above.Signed on 2005-02-15. Completion date: 2005-03-04.
$8,050 with Navy for Other Defense -- Applied Research and Exploratory Development (R&D). Signed on 2005-03-15. Completion date: 2005-04-29.
DIESEL POWER SUPPLY COMPANY (2525 S UNIVERSITY PARKS DR; small business) : $27,780 in 4 contractsfrom 2004 to 2005
$9,520 with Army for Compressors and Vacuum Pumps. Signed on 2005-06-21. Completion date: 2005-07-04.
$9,167 with Army for Maintenance, Repair and Rebuilding of Equipment -- Weapons. Signed on 2005-09-15. Completion date: 2005-09-30.
$4,980, same as above.Signed on 2004-01-27. Completion date: 2004-02-17.
$4,113 with Army for Diesel Engines and Components. Signed on 2004-10-22. Completion date: 2004-10-27.
BRAZOS VALLEY EQUIPMENT CO (1601 LA SALLE AVE; small business) : $18,794 in 2 contractsfrom 2004 to 2005
$16,248 with Army for Miscellaneous Vehicular Components. Signed on 2004-07-16. Completion date: 2004-08-29.
$2,546 with Army for Sets, Kits, and Outfits of Hand Tools. Signed on 2005-09-25. Completion date: 2005-10-26.
MARINELAND OF WACO INC (5098 S LOOP 340; small business)
$16,744 with Army for Gasoline Reciprocating Engines, Except Aircraft; and Components. Signed on 2003-01-31. Completion date: 2003-01-31.
FESTIVE OCCASIONS INC (425 N ROBINSON DR STE B; small business)
$3,080 with Army for Condiments and Related Products. Signed on 2005-09-06. Completion date: 2005-09-11.
QUALITY PEST CONTROL CO (243 HICKS LANE; small business)
$2,100 with Navy for Insect and Rodent Control Services. Signed on 2003-08-25. Completion date: 2003-08-27.
Top industries in this zip code by the number of employees in 2005:
Educational Services: Colleges, Universities, and Professional Schools (over 1000 employees: 1 establishment)
2002 - 2018 National Fire Incident Reporting System (NFIRS) incidents
Based on the data from the years 2002 - 2018 the average number of fire incidents per year is 141. The highest number of reported fire incidents - 189 took place in 2003, and the least - 45 in 2002. The data has an increasing trend.
When looking into fire subcategories, the most incidents belonged to: Outside Fires (48.7%), and Structure Fires (30.9%).
Fire incident types reported to NFIRS in Zip Code 76706
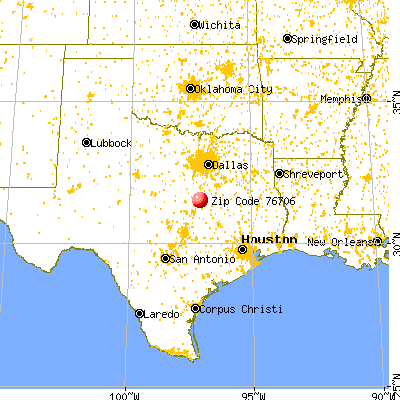


 Nearest zip codes: 76711, 76798, 76701, 76704, 76707, 76643.


 : $4,534,398 in 46 contracts from 2000 to 2006
 Based on the data from the years 2002 - 2018 the average number of fire incidents per year is 141. The highest number of reported fire incidents - 189 took place in 2003, and the least - 45 in 2002. The data has an increasing trend.
 When looking into fire subcategories, the most incidents belonged to: Outside Fires (48.7%), and Structure Fires (30.9%).