Races in Hartsville, Tennessee (TN) Detailed Stats
Ancestries, Foreign-born residents, place of birth

Recent posts about races in Hartsville, Tennessee on our local forum with over 2,400,000 registered users:
 | Tennessee's 2020 Census results (74 replies) |
| Bethpage or Hartsville? (3 replies) |
| Half of our hearts are in Maine; the other half in Hendersonville; need to find land to live half time by granddaughter. (3 replies) |
| 2013 Nashville Metro city and town populations (8 replies) |
| Staying in Tn. (3 replies) |
| Metro Nashville city and town populations (2012) (1 reply) |
1.5% of Hartsville, TN residents are foreign-born , which is 223.6% less than the foreign-born rate of 5.0% across the entire state of Tennessee.
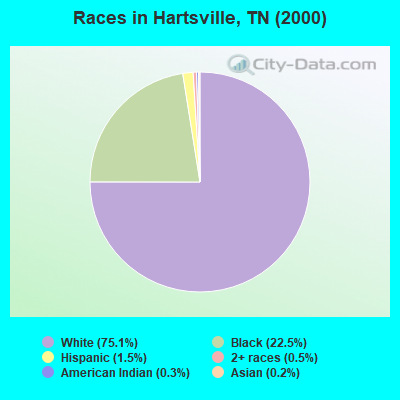
Race distribution in Hartsville

- 1,79875.1%White alone
- 53822.5%Black alone
- 351.5%Hispanic
- 110.5%Two or more races
- 70.3%American Indian alone
- 50.2%Asian alone
- 10.04%Native Hawaiian and Other
Pacific Islander alone
2000
2022
-
- 4,505,93079.2%White alone
- 928,20416.3%Black alone
- 123,8382.2%Hispanic
- 54,8241.0%Two or more races
- 56,0771.0%Asian alone
- 13,8200.2%American Indian alone
- 4,7800.08%Other race alone
- 1,8100.03%Native Hawaiian and Other
Pacific Islander alone

-
- 5,070,02671.9%White alone
- 1,089,73815.5%Black alone
- 442,6296.3%Hispanic
- 279,3814.0%Two or more races
- 131,8171.9%Asian alone
- 26,9720.4%Other race alone
- 6,3870.09%American Indian alone
- 4,3890.06%Native Hawaiian and Other
Pacific Islander alone

Income and house value in Hartsville
- Median household income in 2022
- $53,080White non-Hispanic householders
- $38,342Black householders
- $51,409Asian householders
- $41,518Some other race householders
- $84,527Hispanic or Latino race householders
- Median 2022 house value
- $249,727White Non-Hispanic householders
- $178,863Black or African American householders
- $187,380Some other race householders
- $187,380Hispanic or Latino householders
Household income for White non-Hispanic householders

Household income for Black householders

Household income for Asian householders

Household income for Hispanic or Latino race householders

Foreign-born residents in Hartsville
37 residents are foreign born
| This city: | 1.5% |
| Tennessee: | 2.8% |
Ancestries in Hartsville

- 42829.7%Other
- 36725.5%United States
- 27118.8%English
- 1208.3%Irish
- 694.8%Subsaharan African
- 574.0%German
- 312.2%Scotch-Irish
- 271.9%French
- 221.5%Italian
- 191.3%Scottish
- 130.9%Dutch
- 60.4%Swiss
- 40.3%Hungarian
- 40.3%West Indian
- 30.2%Danish

Zip codes: 37074.