Races in Harleton, Texas (TX) Detailed Stats
Ancestries, Foreign-born residents, place of birth
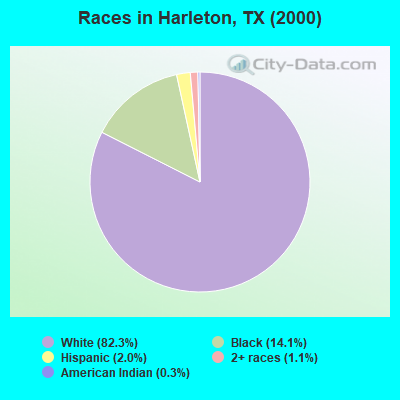
Race distribution in Harleton

- 5,12082.3%White alone
- 87814.1%Black alone
- 1272.0%Hispanic
- 711.1%Two or more races
- 160.3%American Indian alone
- 50.08%Asian alone
- 20.03%Other race alone
- 20.03%Native Hawaiian and Other
Pacific Islander alone
2000
2022
-
- 10,933,31352.4%White alone
- 6,669,66632.0%Hispanic
- 2,364,25511.3%Black alone
- 554,4452.7%Asian alone
- 230,5671.1%Two or more races
- 68,8590.3%American Indian alone
- 19,9580.10%Other race alone
- 10,7570.05%Native Hawaiian and Other
Pacific Islander alone

-
- 12,070,64240.2%Hispanic
- 11,683,43038.9%White alone
- 3,508,70611.7%Black alone
- 1,608,1735.4%Asian alone
- 956,5603.2%Two or more races
- 125,7630.4%Other race alone
- 47,0230.2%American Indian alone
- 29,2750.10%Native Hawaiian and Other
Pacific Islander alone

Income and house value in Harleton
- Median household income in 2022
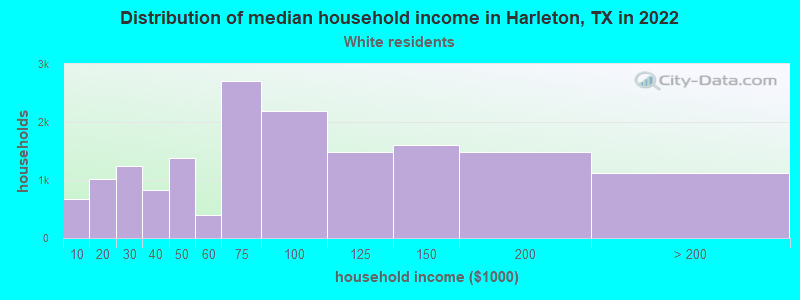
- $68,814White non-Hispanic householders
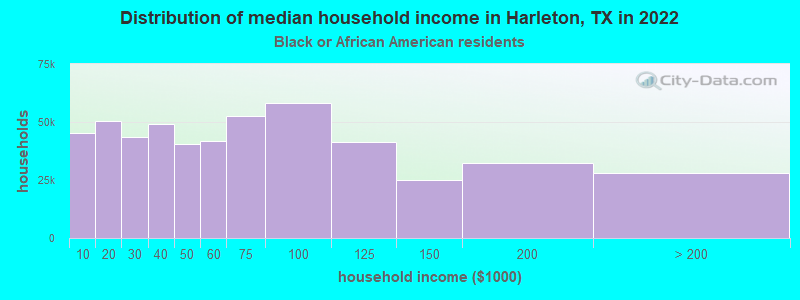
- $54,682Black householders
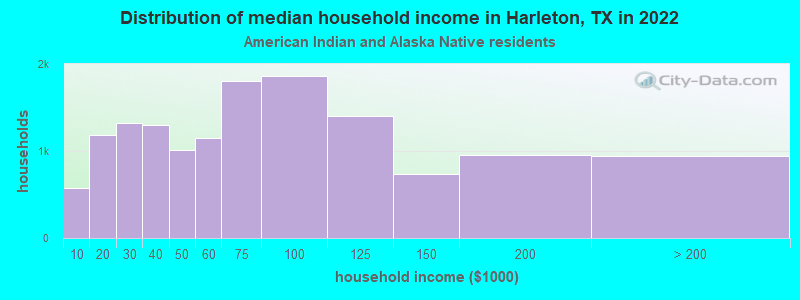
- $24,094American Indian and Alaska Native householders
- $72,201Some other race householders
- $57,260Two or more races householders
- $65,785Hispanic or Latino race householders
- Median 2022 house value
- $170,275White Non-Hispanic householders
- $162,763Black or African American householders
- $184,047American Indian or Alaska Native householders
- $187,803Some other race householders
- $56,341Two or more races householders
- $187,803Hispanic or Latino householders
Household income for White non-Hispanic householders
Household income for Black householders
Household income for American Indian and Alaska Native householders
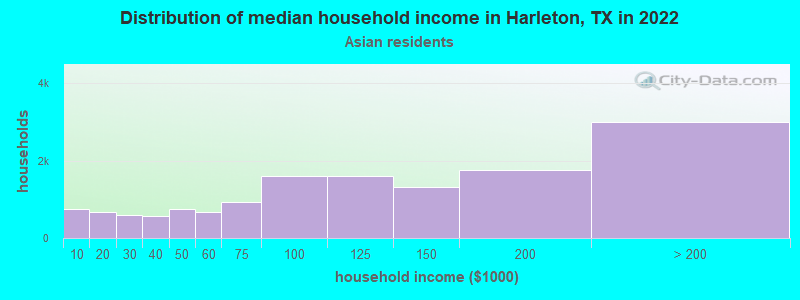
Household income for Asian householders
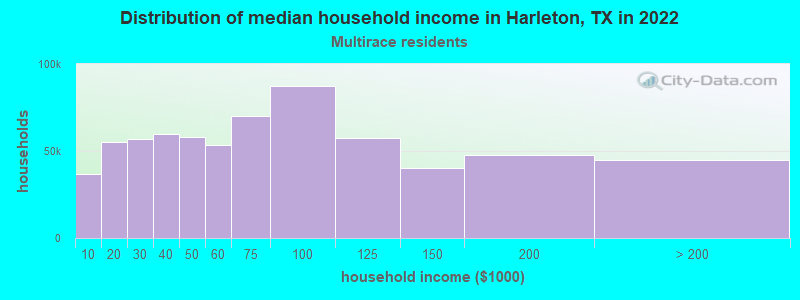
Household income for Two or more races householders
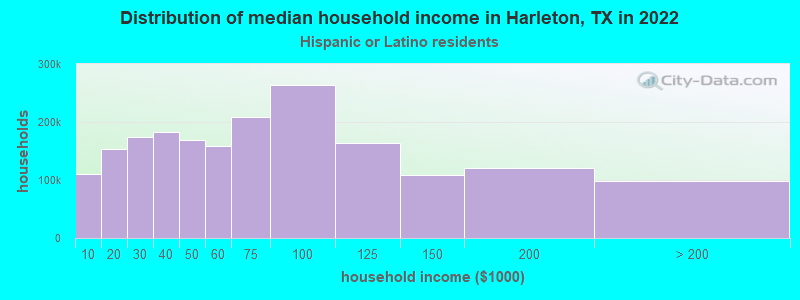
Household income for Hispanic or Latino race householders
Zip code: 75651