Races in East Coal, Oklahoma (OK) Detailed Stats
Ancestries, Foreign-born residents, place of birth
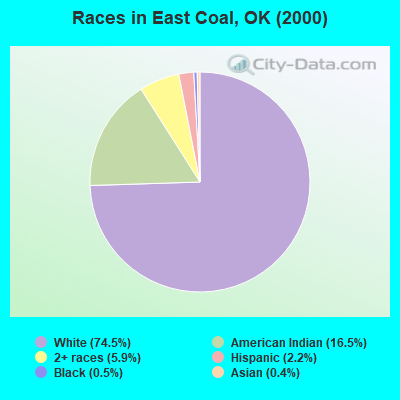
Race distribution in East Coal

- 3,00574.5%White alone
- 66616.5%American Indian alone
- 2365.9%Two or more races
- 892.2%Hispanic
- 200.5%Black alone
- 150.4%Asian alone
2000
2022
-
- 2,556,36874.1%White alone
- 266,1587.7%American Indian alone
- 257,9817.5%Black alone
- 179,3045.2%Hispanic
- 140,2494.1%Two or more races
- 46,1721.3%Asian alone
- 2,3220.07%Other race alone
- 2,1000.06%Native Hawaiian and Other
Pacific Islander alone

-
- 2,517,40362.6%White alone
- 486,69212.1%Hispanic
- 364,4539.1%Two or more races
- 273,6506.8%American Indian alone
- 268,5436.7%Black alone
- 92,6722.3%Asian alone
- 10,7860.3%Other race alone
- 5,6010.1%Native Hawaiian and Other
Pacific Islander alone

Income and house value in East Coal
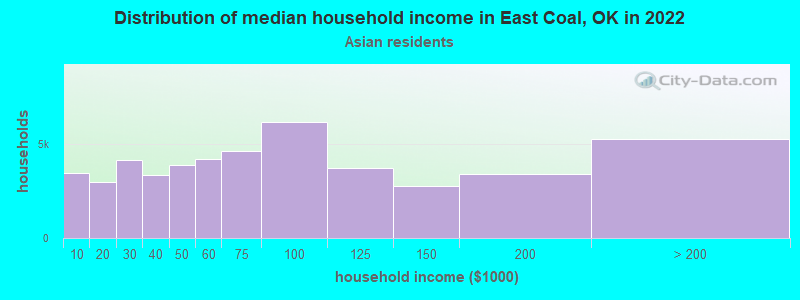
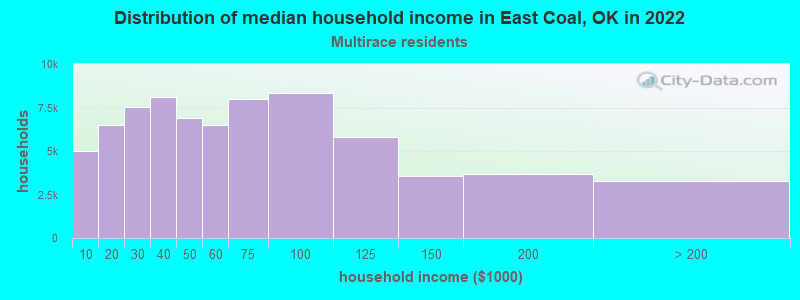
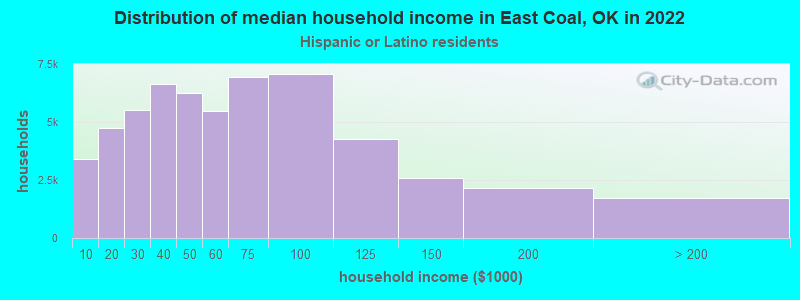
- Median household income in 2022
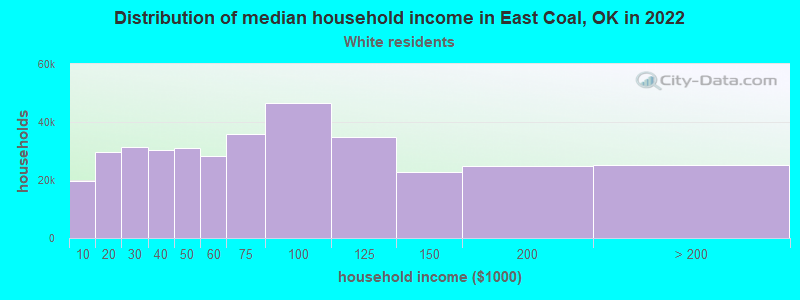
- $42,192White non-Hispanic householders
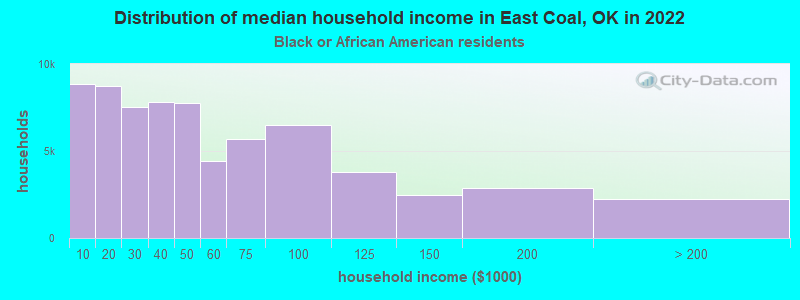
- $66,953Black householders
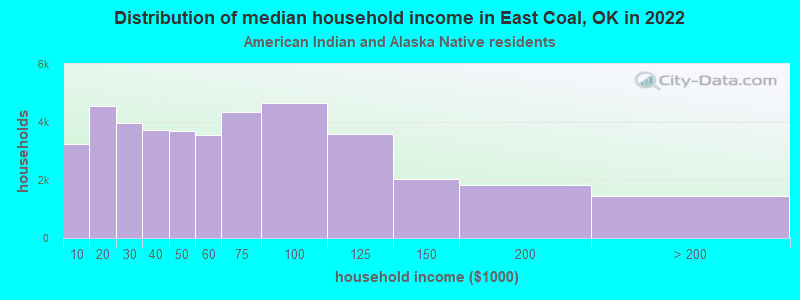
- $43,613American Indian and Alaska Native householders
- $152,585Asian householders
- $41,164Some other race householders
- $44,731Two or more races householders
- $53,082Hispanic or Latino race householders
- Median 2022 house value
- $91,115White Non-Hispanic householders
- $35,221Black or African American householders
- $89,328American Indian or Alaska Native householders
- $82,948Some other race householders
- $89,328Two or more races householders
- $82,948Hispanic or Latino householders
Household income for White non-Hispanic householders
Household income for Black householders
Household income for American Indian and Alaska Native householders
Household income for Asian householders
Household income for Two or more races householders
Household income for Hispanic or Latino race householders
Zip code: 74538