Races in Deer Park, New York (NY) Detailed Stats
Data:
Races - White alone (%)
Races - White alone (% change since 2000)
Races - Black alone (%)
Races - Black alone (% change since 2000)
Races - American Indian alone (%)
Races - American Indian alone (% change since 2000)
Races - Asian alone (%)
Races - Asian alone (% change since 2000)
Races - Hispanic (%)
Races - Hispanic (% change since 2000)
Races - Native Hawaiian and Other Pacific Islander alone (%)
Races - Native Hawaiian and Other Pacific Islander alone (% change since 2000)
Races - Two or more races(%)
Races - Two or more races(% change since 2000)
Races - Other race alone (%)
Races - Other race alone (% change since 2000)
Racial diversity
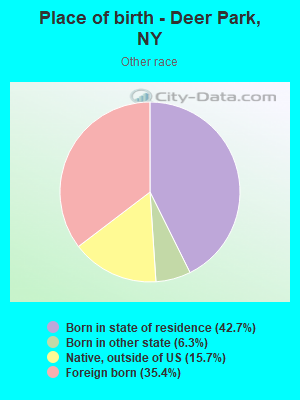
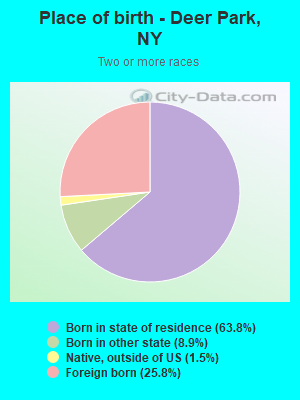
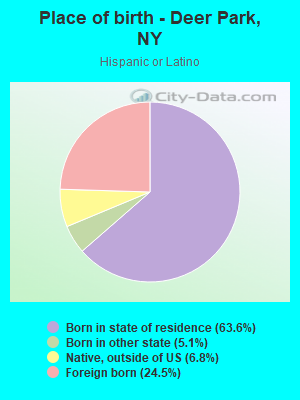
Place of birth - Born in state of residence (%)
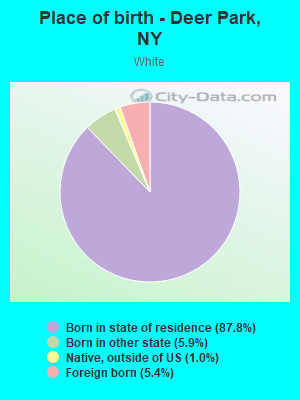
Place of birth - Born in state of residence (%) - White
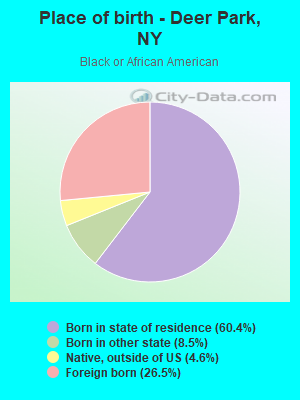
Place of birth - Born in state of residence (%) - Black or African American
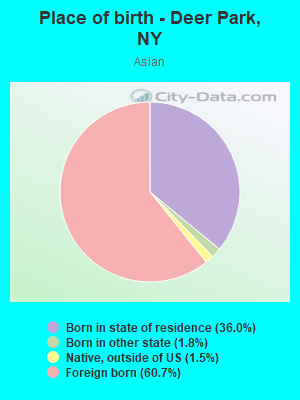
Place of birth - Born in state of residence (%) - Asian
Place of birth - Born in state of residence (%) - Hispanic or Latino
Place of birth - Born in state of residence (%) - American Indian and Alaska Native
Place of birth - Born in state of residence (%) - Multirace
Place of birth - Born in state of residence (%) - Other Race
Place of birth - Born in other state (%)
Place of birth - Born in other state (%) - White
Place of birth - Born in other state (%) - Black or African American
Place of birth - Born in other state (%) - Asian
Place of birth - Born in other state (%) - Hispanic or Latino
Place of birth - Born in other state (%) - American Indian and Alaska Native
Place of birth - Born in other state (%) - Multirace
Place of birth - Born in other state (%) - Other Race
Place of birth - Native, outside of US (%)
Place of birth - Native, outside of US (%) - White
Place of birth - Native, outside of US (%) - Black or African American
Place of birth - Native, outside of US (%) - Asian
Place of birth - Native, outside of US (%) - Hispanic or Latino
Place of birth - Native, outside of US (%) - American Indian and Alaska Native
Place of birth - Native, outside of US (%) - Multirace
Place of birth - Native, outside of US (%) - Other Race
Place of birth - Foreign born (%)
Place of birth - Foreign born (%) - White
Place of birth - Foreign born (%) - Black or African American
Place of birth - Foreign born (%) - Asian
Place of birth - Foreign born (%) - Hispanic or Latino
Place of birth - Foreign born (%) - American Indian and Alaska Native
Place of birth - Foreign born (%) - Multirace
Place of birth - Foreign born (%) - Other Race
Residents speaking English at home (%)
Residents speaking English at home - Born in the United States (%)
Residents speaking English at home - Native, born elsewhere (%)
Residents speaking English at home - Foreign born (%)
Residents speaking Spanish at home (%)
Residents speaking Spanish at home - Born in the United States (%)
Residents speaking Spanish at home - Native, born elsewhere (%)
Residents speaking Spanish at home - Foreign born (%)
Residents speaking other language at home (%)
Residents speaking other language at home - Born in the United States (%)
Residents speaking other language at home - Native, born elsewhere (%)
Residents speaking other language at home - Foreign born (%)
Marital status - Never married (%)
Marital status - Now married (%)
Marital status - Separated (%)
Marital status - Widowed (%)
Marital status - Divorced (%)
Ancestries Reported - Arab (%)
Ancestries Reported - Czech (%)
Ancestries Reported - Danish (%)
Ancestries Reported - Dutch (%)
Ancestries Reported - English (%)
Ancestries Reported - French (%)
Ancestries Reported - French Canadian (%)
Ancestries Reported - German (%)
Ancestries Reported - Greek (%)
Ancestries Reported - Hungarian (%)
Ancestries Reported - Irish (%)
Ancestries Reported - Italian (%)
Ancestries Reported - Lithuanian (%)
Ancestries Reported - Norwegian (%)
Ancestries Reported - Polish (%)
Ancestries Reported - Portuguese (%)
Ancestries Reported - Russian (%)
Ancestries Reported - Scotch-Irish (%)
Ancestries Reported - Scottish (%)
Ancestries Reported - Slovak (%)
Ancestries Reported - Subsaharan African (%)
Ancestries Reported - Swedish (%)
Ancestries Reported - Swiss (%)
Ancestries Reported - Ukrainian (%)
Ancestries Reported - United States (%)
Ancestries Reported - Welsh (%)
Ancestries Reported - West Indian (%)
Ancestries Reported - Other (%)
Geographical mobility - Same house 1 year ago (%)
Geographical mobility - Same house 1 year ago (%) - White
Geographical mobility - Same house 1 year ago (%) - Black or African American
Geographical mobility - Same house 1 year ago (%) - Asian
Geographical mobility - Same house 1 year ago (%) - Hispanic or Latino
Geographical mobility - Same house 1 year ago (%) - American Indian and Alaska Native
Geographical mobility - Same house 1 year ago (%) - Multirace
Geographical mobility - Same house 1 year ago (%) - Other Race
Geographical mobility - Moved within same county (%)
Geographical mobility - Moved within same county (%) - White
Geographical mobility - Moved within same county (%) - Black or African American
Geographical mobility - Moved within same county (%) - Asian
Geographical mobility - Moved within same county (%) - Hispanic or Latino
Geographical mobility - Moved within same county (%) - American Indian and Alaska Native
Geographical mobility - Moved within same county (%) - Multirace
Geographical mobility - Moved within same county (%) - Other Race
Geographical mobility - Moved from different county within same state (%)
Geographical mobility - Moved from different county within same state (%) - White
Geographical mobility - Moved from different county within same state (%) - Black or African American
Geographical mobility - Moved from different county within same state (%) - Asian
Geographical mobility - Moved from different county within same state (%) - Hispanic or Latino
Geographical mobility - Moved from different county within same state (%) - American Indian and Alaska Native
Geographical mobility - Moved from different county within same state (%) - Multirace
Geographical mobility - Moved from different county within same state (%) - Other Race
Geographical mobility - Moved from different state (%)
Geographical mobility - Moved from different state (%) - White
Geographical mobility - Moved from different state (%) - Black or African American
Geographical mobility - Moved from different state (%) - Asian
Geographical mobility - Moved from different state (%) - Hispanic or Latino
Geographical mobility - Moved from different state (%) - American Indian and Alaska Native
Geographical mobility - Moved from different state (%) - Multirace
Geographical mobility - Moved from different state (%) - Other Race
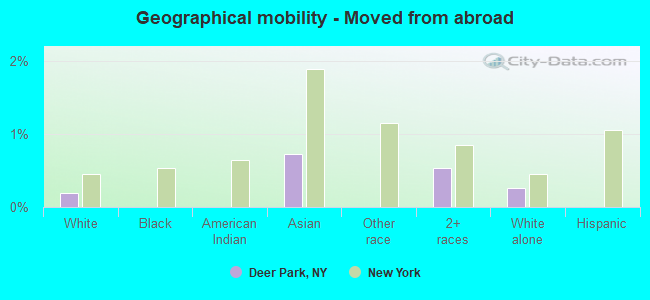
Geographical mobility - Moved from abroad (%)
Geographical mobility - Moved from abroad (%) - White
Geographical mobility - Moved from abroad (%) - Black or African American
Geographical mobility - Moved from abroad (%) - Asian
Geographical mobility - Moved from abroad (%) - Hispanic or Latino
Geographical mobility - Moved from abroad (%) - American Indian and Alaska Native
Geographical mobility - Moved from abroad (%) - Multirace
Geographical mobility - Moved from abroad (%) - Other Race
Place of birth for the foreign-born population - Ireland (%)
Place of birth for the foreign-born population - Denmark (%)
Place of birth for the foreign-born population - Norway (%)
Place of birth for the foreign-born population - Sweden (%)
Place of birth for the foreign-born population - United Kingdom (%)
Place of birth for the foreign-born population - England (%)
Place of birth for the foreign-born population - Scotland (%)
Place of birth for the foreign-born population - Other Northern Europe (%)
Place of birth for the foreign-born population - Austria (%)
Place of birth for the foreign-born population - Belgium (%)
Place of birth for the foreign-born population - France (%)
Place of birth for the foreign-born population - Germany (%)
Place of birth for the foreign-born population - Netherlands (%)
Place of birth for the foreign-born population - Switzerland (%)
Place of birth for the foreign-born population - Other Western Europe (%)
Place of birth for the foreign-born population - Greece (%)
Place of birth for the foreign-born population - Italy (%)
Place of birth for the foreign-born population - Portugal (%)
Place of birth for the foreign-born population - Spain (%)
Place of birth for the foreign-born population - Other Southern Europe (%)
Place of birth for the foreign-born population - Albania (%)
Place of birth for the foreign-born population - Belarus (%)
Place of birth for the foreign-born population - Bosnia and Herzegovina (%)
Place of birth for the foreign-born population - Bulgaria (%)
Place of birth for the foreign-born population - Croatia (%)
Place of birth for the foreign-born population - Czechoslovakia (%)
Place of birth for the foreign-born population - Hungary (%)
Place of birth for the foreign-born population - Latvia (%)
Place of birth for the foreign-born population - Lithuania (%)
Place of birth for the foreign-born population - North Macedonia (Macedonia) (%)
Place of birth for the foreign-born population - Moldova (%)
Place of birth for the foreign-born population - Poland (%)
Place of birth for the foreign-born population - Romania (%)
Place of birth for the foreign-born population - Russia (%)
Place of birth for the foreign-born population - Serbia (%)
Place of birth for the foreign-born population - Ukraine (%)
Place of birth for the foreign-born population - Other Eastern Europe (%)
Place of birth for the foreign-born population - China (%)
Place of birth for the foreign-born population - Hong Kong (%)
Place of birth for the foreign-born population - Taiwan (%)
Place of birth for the foreign-born population - Japan (%)
Place of birth for the foreign-born population - Korea (%)
Place of birth for the foreign-born population - Other Eastern Asia (%)
Place of birth for the foreign-born population - Afghanistan (%)
Place of birth for the foreign-born population - Bangladesh (%)
Place of birth for the foreign-born population - India (%)
Place of birth for the foreign-born population - Iran (%)
Place of birth for the foreign-born population - Kazakhstan (%)
Place of birth for the foreign-born population - Nepal (%)
Place of birth for the foreign-born population - Pakistan (%)
Place of birth for the foreign-born population - Sri Lanka (%)
Place of birth for the foreign-born population - Uzbekistan (%)
Place of birth for the foreign-born population - Other South Central Asia (%)
Place of birth for the foreign-born population - Burma (%)
Place of birth for the foreign-born population - Cambodia (%)
Place of birth for the foreign-born population - Indonesia (%)
Place of birth for the foreign-born population - Laos (%)
Place of birth for the foreign-born population - Malaysia (%)
Place of birth for the foreign-born population - Philippines (%)
Place of birth for the foreign-born population - Singapore (%)
Place of birth for the foreign-born population - Thailand (%)
Place of birth for the foreign-born population - Vietnam (%)
Place of birth for the foreign-born population - Other South Eastern Asia (%)
Place of birth for the foreign-born population - Armenia (%)
Place of birth for the foreign-born population - Iraq (%)
Place of birth for the foreign-born population - Israel (%)
Place of birth for the foreign-born population - Jordan (%)
Place of birth for the foreign-born population - Kuwait (%)
Place of birth for the foreign-born population - Lebanon (%)
Place of birth for the foreign-born population - Saudi Arabia (%)
Place of birth for the foreign-born population - Syria (%)
Place of birth for the foreign-born population - Turkey (%)
Place of birth for the foreign-born population - Yemen (%)
Place of birth for the foreign-born population - Other Western Asia (%)
Place of birth for the foreign-born population - Eritrea (%)
Place of birth for the foreign-born population - Ethiopia (%)
Place of birth for the foreign-born population - Kenya (%)
Place of birth for the foreign-born population - Somalia (%)
Place of birth for the foreign-born population - Uganda (%)
Place of birth for the foreign-born population - Zimbabwe (%)
Place of birth for the foreign-born population - Other Eastern Africa (%)
Place of birth for the foreign-born population - Cameroon (%)
Place of birth for the foreign-born population - Congo (%)
Place of birth for the foreign-born population - Democratic Republic of Congo (Zaire) (%)
Place of birth for the foreign-born population - Other Middle Africa (%)
Place of birth for the foreign-born population - Egypt (%)
Place of birth for the foreign-born population - Morocco (%)
Place of birth for the foreign-born population - Sudan (%)
Place of birth for the foreign-born population - Other Northern Africa (%)
Place of birth for the foreign-born population - South Africa (%)
Place of birth for the foreign-born population - Other Southern Africa (%)
Place of birth for the foreign-born population - Cabo Verde (%)
Place of birth for the foreign-born population - Ghana (%)
Place of birth for the foreign-born population - Liberia (%)
Place of birth for the foreign-born population - Nigeria (%)
Place of birth for the foreign-born population - Senegal (%)
Place of birth for the foreign-born population - Sierra Leone (%)
Place of birth for the foreign-born population - Other Western Africa (%)
Place of birth for the foreign-born population - Australia (%)
Place of birth for the foreign-born population - New Zealand (%)
Place of birth for the foreign-born population - Fiji (%)
Place of birth for the foreign-born population - Micronesia (%)
Place of birth for the foreign-born population - Bahamas (%)
Place of birth for the foreign-born population - Barbados (%)
Place of birth for the foreign-born population - Cuba (%)
Place of birth for the foreign-born population - Dominica (%)
Place of birth for the foreign-born population - Dominican Republic (%)
Place of birth for the foreign-born population - Grenada (%)
Place of birth for the foreign-born population - Haiti (%)
Place of birth for the foreign-born population - Jamaica (%)
Place of birth for the foreign-born population - St. Vincent and the Grenadines (%)
Place of birth for the foreign-born population - Trinidad and Tobago (%)
Place of birth for the foreign-born population - West Indies (%)
Place of birth for the foreign-born population - Other Caribbean (%)
Place of birth for the foreign-born population - Belize (%)
Place of birth for the foreign-born population - Costa Rica (%)
Place of birth for the foreign-born population - El Salvador (%)
Place of birth for the foreign-born population - Guatemala (%)
Place of birth for the foreign-born population - Honduras (%)
Place of birth for the foreign-born population - Mexico (%)
Place of birth for the foreign-born population - Nicaragua (%)
Place of birth for the foreign-born population - Panama (%)
Place of birth for the foreign-born population - Other Central America (%)
Place of birth for the foreign-born population - Argentina (%)
Place of birth for the foreign-born population - Bolivia (%)
Place of birth for the foreign-born population - Brazil (%)
Place of birth for the foreign-born population - Chile (%)
Place of birth for the foreign-born population - Colombia (%)
Place of birth for the foreign-born population - Ecuador (%)
Place of birth for the foreign-born population - Guyana (%)
Place of birth for the foreign-born population - Peru (%)
Place of birth for the foreign-born population - Uruguay (%)
Place of birth for the foreign-born population - Venezuela (%)
Place of birth for the foreign-born population - Other South America (%)
Place of birth for the foreign-born population - Canada (%)
Place of birth for the foreign-born population - Other Northern America (%)
Place of birth for the foreign-born population - Other (%)
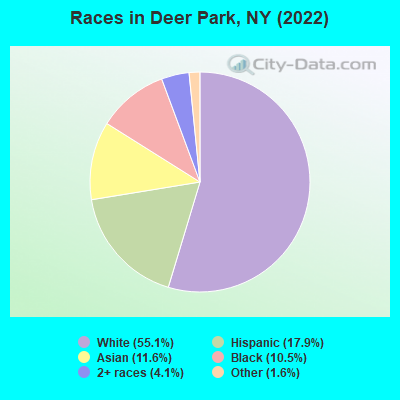
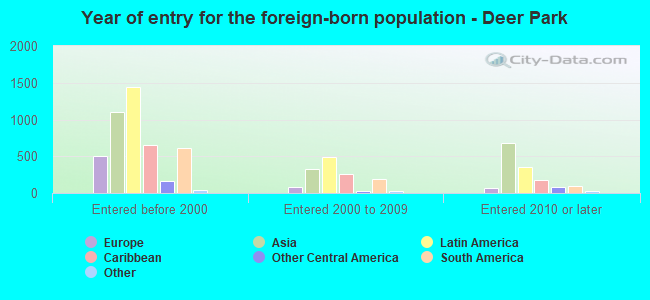
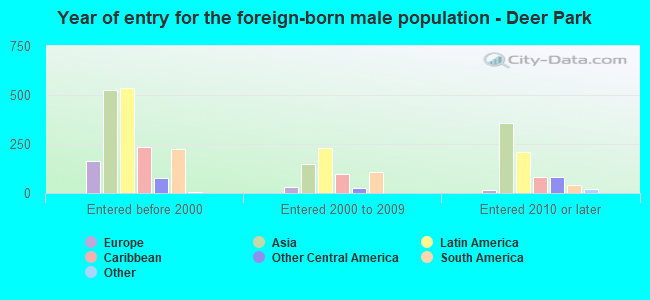
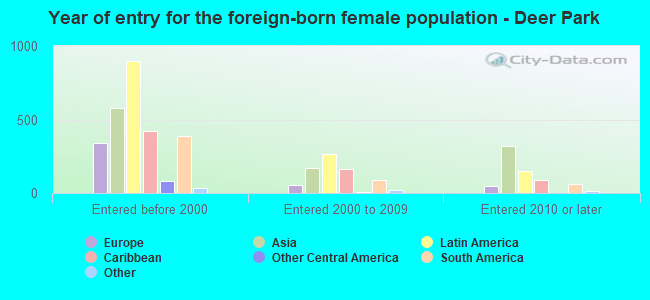
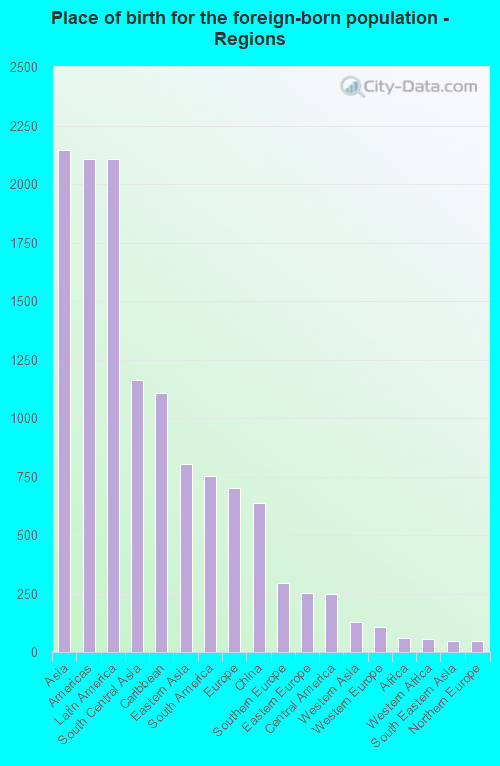
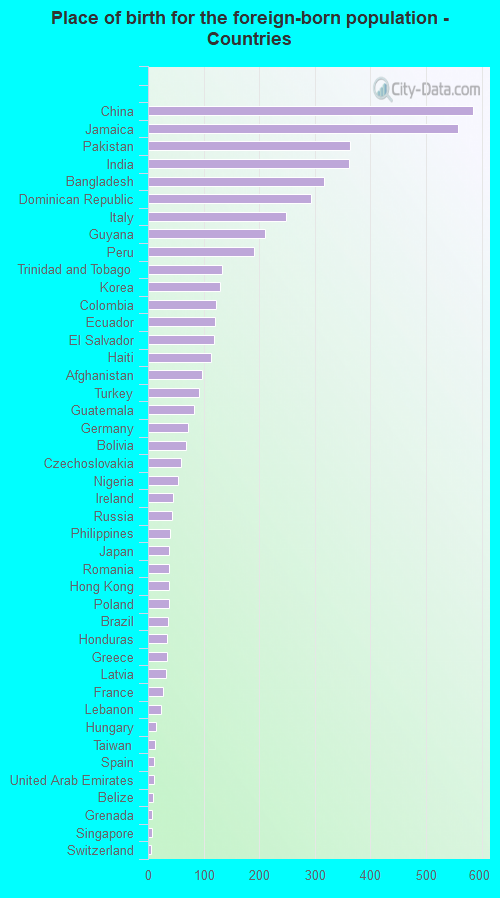
According to 2022 data, the most numerous races in Deer Park, NY are White alone (15,048 residents), Hispanic (4,900 residents), and Black alone (2,874 residents). 73.4% of Deer Park residents speak English at home. 18.3% of Deer Park, NY residents are foreign-born (7.9% born in Asia, 7.8% born in Latin America, 2.6% born in Europe), which is 20.0% less than the foreign-born rate of 22.0% across the entire state of New York.
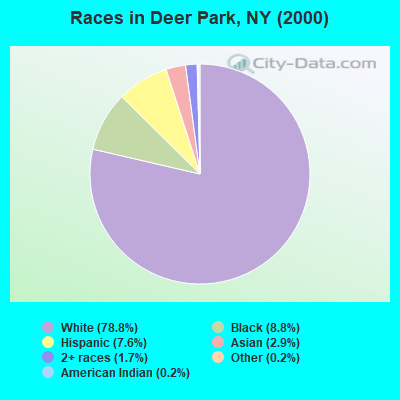
Race distribution in Deer Park
2000 2022
11,760,981 62.0% White alone 2,867,583 15.1% Hispanic 2,812,623 14.8% Black alone 1,035,926 5.5% Asian alone 366,116 1.9% Two or more races 75,499 0.4% Other race alone 52,499 0.3% American Indian alone 5,230 0.03% Native Hawaiian and Other
10,408,933 52.9% White alone 3,867,299 19.7% Hispanic 2,633,840 13.4% Black alone 1,776,286 9.0% Asian alone 732,670 3.7% Two or more races 216,110 1.1% Other race alone 35,082 0.2% American Indian alone 6,931 0.04% Native Hawaiian and Other
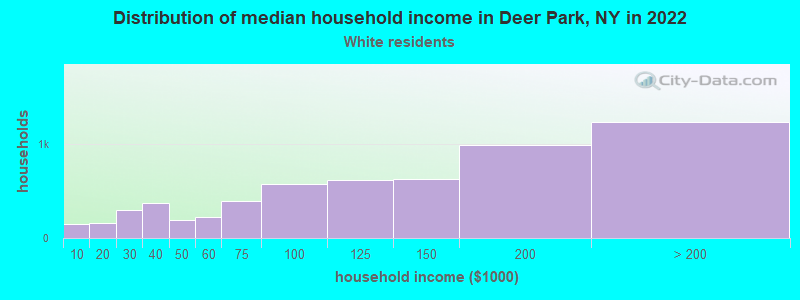
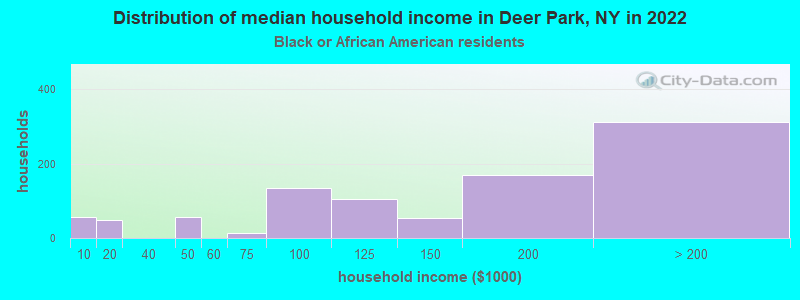
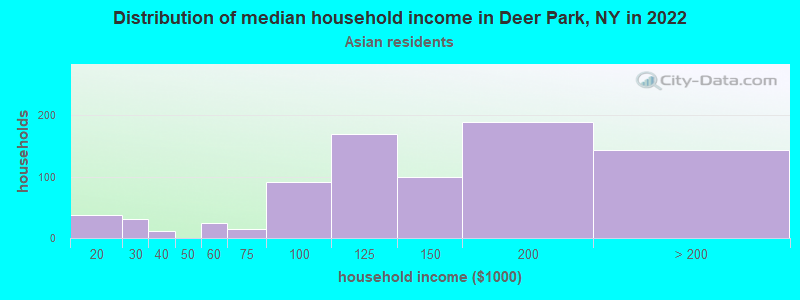
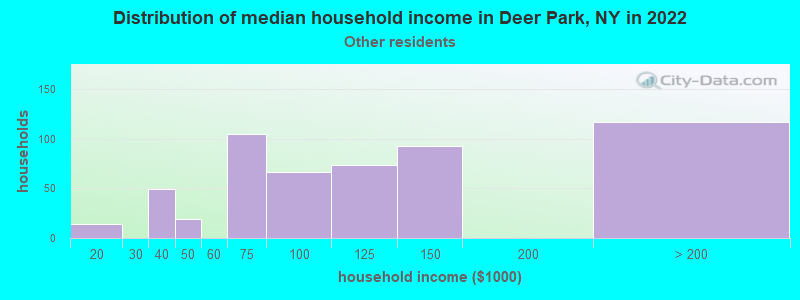
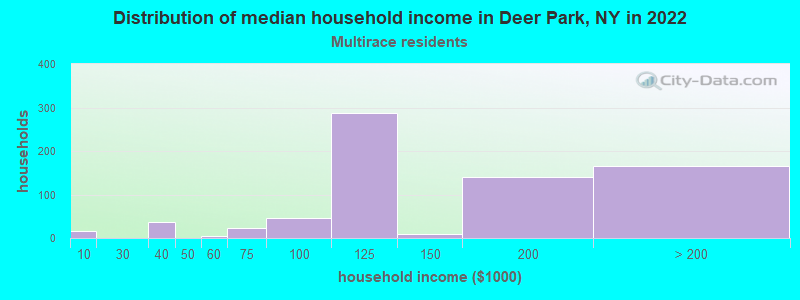
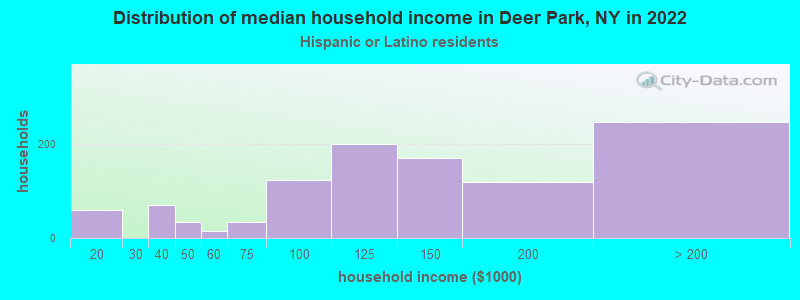
Income and house value in Deer Park Median household income in 2022 $120,378 White non-Hispanic householders$159,199 Black householders$121,984 Asian householders$115,889 Some other race householders$122,833 Two or more races householders$131,388 Hispanic or Latino race householdersMedian 2022 house value $525,858 White Non-Hispanic householders$495,549 Black or African American householders $611,026 Asian householders$504,642 Some other race householders$531,314 Two or more races householders$520,403 Hispanic or Latino householders
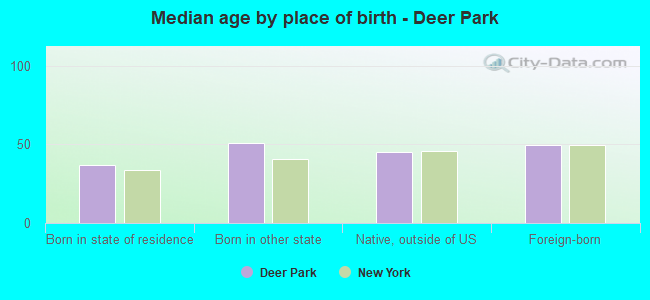
Median age by race in Deer Park
48.8 Median age for White residents47.8 49.3 39.1 Median age for Black or African American residents36.1 43.1 -748,832,865.7 Median age for American Indian / Alaska Native residents-807,017,543.1 -513,692,161.9 35.9 Median age for Asian residents34.8 37.8 -742,816,091.2 Median age for Native Hawaiian / Pacific Islander residents-831,187,409.8 -771,300,447.7 40.2 Median age for Other race residents34.3 44.9 28.1 Median age for Two or more races residents26.5 30.2 48.6 Median age for White alone residents47.9 49.0 32.9 Median age for Hispanic or Latino residents32.8 33.6
Owner/renter occupied households by race in Deer Park
House owners and renters - White residents 5,068 85.8% Owner occupied838 14.2% Renter occupiedHouse owners and renters - Black or African American residents 819 86.3% Owner occupied130 13.7% Renter occupiedHouse owners and renters - American Indian / Alaska Native residents 9 100.0% Owner occupiedHouse owners and renters - Asian residents 786 90.9% Owner occupied78 9.1% Renter occupiedHouse owners and renters - Other race residents 492 81.9% Owner occupied108 18.1% Renter occupiedHouse owners and renters - Two or more races residents 591 89.7% Owner occupied68 10.3% Renter occupiedHouse owners and renters - White alone residents 4,804 84.9% Owner occupied855 15.1% Renter occupiedHouse owners and renters - Hispanic or Latino residents 919 86.7% Owner occupied141 13.3% Renter occupied
Language usage in Deer Park
English speakers - Total 73.4% of residents of Deer Park speak English at home.
9.6% of residents speak Spanish at home 1,790 71.8% Speak English very well702 28.2% Speak English less than very well17.2% of residents speak other language at home 2,975 66.4% Speak English very well1,508 33.6% Speak English less than very well
English speakers - Born in the United States 84.0% of residents of Deer Park speak English at home.
8.5% of residents speak Spanish at home 135 100.0% Speak English very well8.4% of residents speak other language at home 60 45.1% Speak English very well73 54.9% Speak English less than very well
English speakers - Native, born elsewhere 41.4% of residents of Deer Park speak English at home.
42.3% of residents speak Spanish at home 261 91.6% Speak English very well24 8.4% Speak English less than very well20.8% of residents speak other language at home 130 92.9% Speak English very well10 7.1% Speak English less than very well
English speakers - Foreign-born 28.1% of residents of Deer Park speak English at home.
18.0% of residents speak Spanish at home 383 39.1% Speak English very well596 60.9% Speak English less than very well51.4% of residents speak other language at home 1,480 53.0% Speak English very well1,314 47.0% Speak English less than very well
White (Caucasian) - Speak only English Native:
93.2% (13,518)Foreign-born:
38.6% (326)
White (Caucasian) - Speak another language Native:
6.4% (923)Foreign-born:
64.1% (541)
Black or African American - Speak only English Native:
80.0% (1,586)Foreign-born:
92.2% (758)
Black or African American - Speak another language Native:
22.8% (452)Foreign-born:
15.3% (125)
Asian - Speak only English Native:
38.0% (393)Foreign-born:
5.3% (106)
Asian - Speak another language Native:
63.4% (657)Foreign-born:
98.9% (1,952)
Other race - Speak only English Native:
52.1% (671)Foreign-born:
20.8% (145)
Other race - Speak another language Native:
49.4% (635)Foreign-born:
76.1% (531)
Two or more races - Speak only English Native:
81.3% (1,778)Foreign-born:
35.6% (316)
Two or more races - Speak another language Native:
19.3% (423)Foreign-born:
61.3% (543)
White alone - Speak only English Native:
93.6% (12,958)Foreign-born:
30.7% (254)
White alone - Speak another language Native:
6.5% (904)Foreign-born:
69.3% (573)
Hispanic or Latino - Speak only English Native:
64.5% (2,119)Foreign-born:
15.7% (185)
Hispanic or Latino - Speak another language Native:
36.5% (1,199)Foreign-born:
83.4% (984)
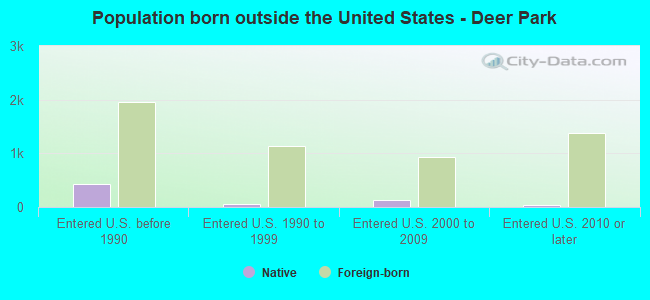
Foreign-born residents in Deer Park 5,011 residents are foreign born (7.9% Asia , 7.8% Latin America , 2.6% Europe ).
This city:
18.3%New York:
22.6%
Marital status for residents in Deer Park Marital status - White (Caucasian) population 15 years and over
Males 31.4% Never married54.3% Now married0.6% Separated3.2% Widowed10.4% DivorcedFemales 35.8% Never married44.6% Now married1.2% Separated10.8% Widowed7.6% DivorcedWomen who gave birth in the past 12 months Now married:
100.0% (120)Unmarried:
0.0% (0)
Women who did not give birth in the past 12 months Now married:
37.5% (1,315)Unmarried:
62.5% (2,191)
Marital status - Black or African American population 15 years and over
Males 36.0% Never married58.7% Now married1.4% Separated0.0% Widowed3.9% DivorcedFemales 40.8% Never married37.7% Now married6.7% Separated3.1% Widowed11.7% DivorcedWomen who gave birth in the past 12 months Now married:
60.0% (15)Unmarried:
40.0% (10)
Women who did not give birth in the past 12 months Now married:
28.0% (169)Unmarried:
72.0% (434)
Marital status - Asian population 15 years and over
Males 29.9% Never married65.9% Now married0.6% Separated0.0% Widowed3.7% DivorcedFemales 20.0% Never married71.3% Now married0.0% Separated3.8% Widowed5.0% DivorcedWomen who gave birth in the past 12 months Now married:
100.0% (56)Unmarried:
0.0% (0)
Women who did not give birth in the past 12 months Now married:
69.4% (625)Unmarried:
30.6% (276)
Marital status - Other race population 15 years and over
Males 23.6% Never married55.5% Now married0.0% Separated0.0% Widowed20.9% DivorcedFemales 17.9% Never married75.6% Now married0.0% Separated4.5% Widowed2.0% DivorcedWomen who gave birth in the past 12 months Now married:
100.0% (41)Unmarried:
0.0% (0)
Women who did not give birth in the past 12 months Now married:
75.6% (541)Unmarried:
24.4% (175)
Marital status - Two or more races population 15 years and over
Males 54.9% Never married40.5% Now married0.0% Separated0.0% Widowed4.6% DivorcedFemales 29.3% Never married35.4% Now married16.7% Separated1.9% Widowed16.7% DivorcedWomen who did not give birth in the past 12 months Now married:
49.1% (344)Unmarried:
50.9% (357)
Marital status - White alone, not Hispanic / Latino population 15 years and over
Males 31.1% Never married53.9% Now married0.7% Separated3.4% Widowed10.9% DivorcedFemales 35.8% Never married44.2% Now married1.1% Separated11.5% Widowed7.4% DivorcedWomen who gave birth in the past 12 months Now married:
100.0% (120)Unmarried:
0.0% (0)
Women who did not give birth in the past 12 months Now married:
36.4% (1,236)Unmarried:
63.6% (2,157)
Marital status - Hispanic or Latino population 15 years and over
Males 42.2% Never married47.0% Now married0.0% Separated0.5% Widowed10.3% DivorcedFemales 27.2% Never married54.7% Now married7.6% Separated3.4% Widowed7.1% DivorcedWomen who gave birth in the past 12 months Now married:
100.0% (27)Unmarried:
0.0% (0)
Women who did not give birth in the past 12 months Now married:
59.2% (702)Unmarried:
40.8% (483)
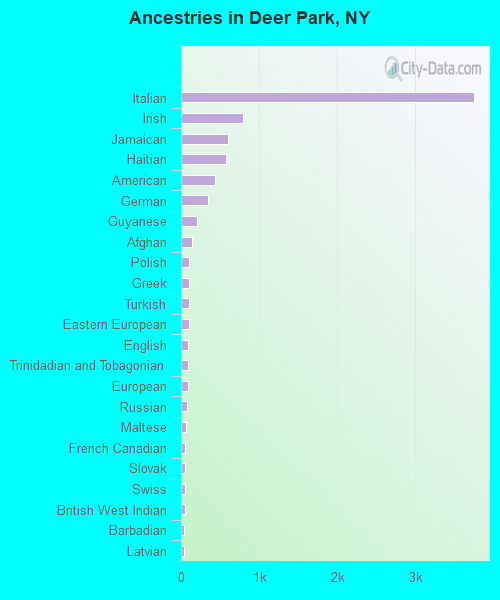
Ancestries in Deer Park
3,759 29.0% Italian794 6.1% Irish601 4.6% Jamaican571 4.4% Haitian438 3.4% American350 2.7% German208 1.6% Guyanese140 1.1% Afghan105 0.8% Polish101 0.8% Greek98 0.8% Turkish97 0.7% Eastern European93 0.7% English90 0.7% Trinidadian and Tobagonian84 0.6% European83 0.6% Russian65 0.5% Maltese56 0.4% French Canadian53 0.4% Slovak51 0.4% Swiss49 0.4% British West Indian41 0.3% Barbadian37 0.3% Latvian31 0.2% Nigerian23 0.2% Romanian23 0.2% Scotch-Irish20 0.2% Lebanese19 0.1% Albanian18 0.1% Austrian18 0.1% Scottish17 0.1% Norwegian14 0.1% French11 0.08% British11 0.08% Scandinavian10 0.08% Belizean9 0.07% Hungarian7 0.05% Welsh6 0.05% Czech
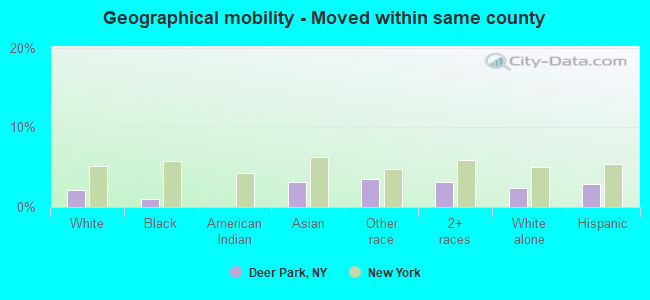
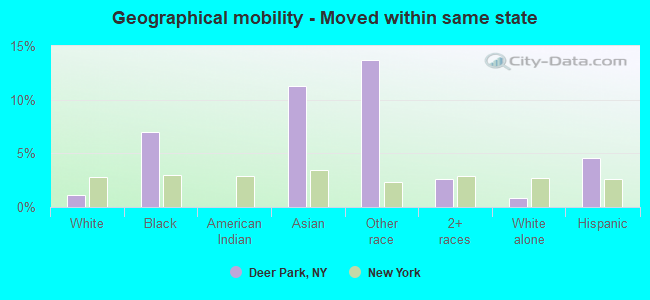
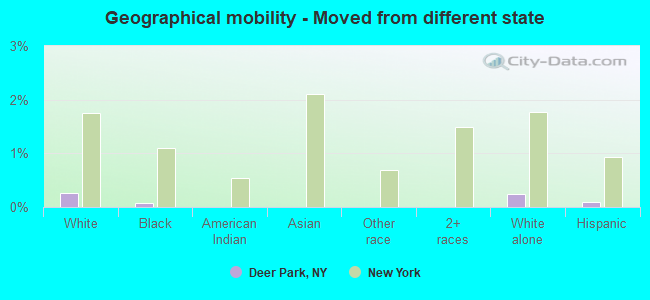
Geographical mobility in Deer Park Same house 1 year ago 15,045 96.4% White (Caucasian)2,847 92.8% Black or African American11 100.0% American Indian / Alaska Native2,726 86.2% Asian1,690 84.7% Other race3,162 93.3% Two or more races14,376 96.3% White alone, not Hispanic / Latino4,478 92.6% Hispanic or LatinoMoved within same county 339 2.2% White / Caucasian29 1.0% Black or African American101 3.2% Asian69 3.5% Other race106 3.1% Two or more races351 2.4% White alone, not Hispanic / Latino142 2.9% Hispanic or LatinoMoved within same state 167 1.1% White / Caucasian214 7.0% Black or African American356 11.3% Asian273 13.7% Other race88 2.6% Two or more races126 0.8% White alone, not Hispanic / Latino222 4.6% Hispanic or LatinoMoved from different state 39 0.3% White / Caucasian2 0.1% Black or African American35 0.2% White alone, not Hispanic / Latino4 0.1% Hispanic or LatinoMoved from abroad 29 0.2% White23 0.7% Asian18 0.5% Two or more races39 0.3% White alone, not Hispanic / Latino
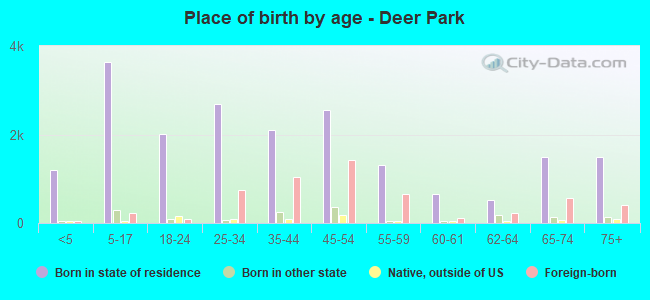
Children Nativity (place of birth) in Deer Park
Children under 6 years - Living with two parents Both parents native 744 100.0% NativeBoth parents foreign-born 299 100.0% NativeOne native, one foreign-born parent 52 100.0% NativeChildren under 6 years - Living with one parent Native parent 179 100.0% NativeForeign-born parent 116 100.0% NativeChildren 6 to 17 years - Living with two parents Both parents native 1,803 97.9% Native40 2.1% Foreign-bornBoth parents foreign-born 642 86.4% Native101 13.6% Foreign-bornOne native, one foreign-born parent 367 100.0% NativeChildren 6 to 17 years - Living with one parent Native parent 371 100.0% NativeForeign-born parent 155 54.6% Native129 45.4% Foreign-born
Grandparents responsible for own grandchildren in Deer Park
Grandparents (30 to 59 years) White / Caucasian 43 100.0% Not responsible for grandchildrenBlack or African American 74 100.0% Not responsible for grandchildrenAsian 91 100.0% Not responsible for grandchildrenOther race 65 100.0% Not responsible for grandchildrenTwo or more races 354 100.0% Not responsible for grandchildrenWhite alone, not Hispanic / Latino 39 100.0% Not responsible for grandchildrenHispanic or Latino 115 100.0% Not responsible for grandchildrenGrandparents (60 years and over) White / Caucasian 58 26.6% Responsible for grandchildren161 73.4% Not responsible for grandchildrenBlack or African American 140 100.0% Not responsible for grandchildrenAsian 9 10.4% Responsible for grandchildren79 89.6% Not responsible for grandchildrenTwo or more races 44 100.0% Not responsible for grandchildrenWhite alone, not Hispanic / Latino 59 26.2% Responsible for grandchildren166 73.8% Not responsible for grandchildrenHispanic or Latino 7 20.7% Responsible for grandchildren27 79.3% Not responsible for grandchildren