Estimated zip code population in 2022: 18,063
Zip code population in 2010: 15,347
Zip code population in 2000: 15,199
Houses and condos: 5,326
Renter-occupied apartments: 1,321
% of renters here:
26%State:
46%
March 2022 cost of living index in zip code 11798: 149.2
(very high, U.S. average is 100)
Land area: 4.8
sq. mi.
Water area: 0.0
sq. mi.
Population density: 3,789 people per square mile (average).
OSM Map
General Map
Google Map
MSN Map
OSM Map
General Map
Google Map
MSN Map
OSM Map
General Map
Google Map
MSN Map
OSM Map
General Map
Google Map
MSN Map
Please wait while loading the map...
Real estate property taxes paid for housing units in 2022:
This zip code:
2.4% ($9,805)New York:
1.5% ($6,180)
Median real estate property taxes paid for housing units with mortgages in 2022: $9,858 (2.2%)
Median real estate property taxes paid for housing units with no mortgage in 2022: $9,755 (2.6%)
Profiles of local businesses
Business Search - 14 Million verified businesses
Males: 9,112 Females: 8,951
For population 25 years and over in 11798:
High school or higher: 72.3%Bachelor's degree or higher: 21.3%Graduate or professional degree: 8.9%Unemployed: 4.2%Mean travel time to work (commute): 28.9 minutes
For population 15 years and over in 11798:
Never married: 47.2%Now married: 36.2%Separated: 3.4%Widowed: 4.3%Divorced: 8.9%
Zip code 11798 compared to state average:
Black race population percentage significantly above state average. Renting percentage below state average. Length of stay since moving in above state average. House age below state average. Percentage of population with a bachelor's degree or higher below state average. 9,559 52.9% Black 5,640 31.2% Hispanic or Latino 1,248 6.9% White 1,090 6.0% Two or more races 394 2.2% Asian 123 0.7% Some other race 6 0.03% American Indian
Data:
Median household income ($)
Median household income (% change since 2000)
Household income diversity
Ratio of average income to average house value (%)
Ratio of average income to average rent
Median household income ($) - White
Median household income ($) - Black or African American
Median household income ($) - Asian
Median household income ($) - Hispanic or Latino
Median household income ($) - American Indian and Alaska Native
Median household income ($) - Multirace
Median household income ($) - Other Race
Median household income for houses/condos with a mortgage ($)
Median household income for apartments without a mortgage ($)
Races - White alone (%)
Races - White alone (% change since 2000)
Races - Black alone (%)
Races - Black alone (% change since 2000)
Races - American Indian alone (%)
Races - American Indian alone (% change since 2000)
Races - Asian alone (%)
Races - Asian alone (% change since 2000)
Races - Hispanic (%)
Races - Hispanic (% change since 2000)
Races - Native Hawaiian and Other Pacific Islander alone (%)
Races - Native Hawaiian and Other Pacific Islander alone (% change since 2000)
Races - Two or more races (%)
Races - Two or more races (% change since 2000)
Races - Other race alone (%)
Races - Other race alone (% change since 2000)
Racial diversity
Unemployment (%)
Unemployment (% change since 2000)
Unemployment (%) - White
Unemployment (%) - Black or African American
Unemployment (%) - Asian
Unemployment (%) - Hispanic or Latino
Unemployment (%) - American Indian and Alaska Native
Unemployment (%) - Multirace
Unemployment (%) - Other Race
Population density (people per square mile)
Population - Males (%)
Population - Females (%)
Population - Males (%) - White
Population - Males (%) - Black or African American
Population - Males (%) - Asian
Population - Males (%) - Hispanic or Latino
Population - Males (%) - American Indian and Alaska Native
Population - Males (%) - Multirace
Population - Males (%) - Other Race
Population - Females (%) - White
Population - Females (%) - Black or African American
Population - Females (%) - Asian
Population - Females (%) - Hispanic or Latino
Population - Females (%) - American Indian and Alaska Native
Population - Females (%) - Multirace
Population - Females (%) - Other Race
Coronavirus confirmed cases (May 18, 2024)
Deaths caused by coronavirus (May 18, 2024)
Coronavirus confirmed cases (per 100k population) (May 18, 2024)
Deaths caused by coronavirus (per 100k population) (May 18, 2024)
Daily increase in number of cases (May 18, 2024)
Weekly increase in number of cases (May 18, 2024)
Cases doubled (in days) (May 18, 2024)
Hospitalized patients (Apr 18, 2022)
Negative test results (Apr 18, 2022)
Total test results (Apr 18, 2022)
COVID Vaccine doses distributed (per 100k population) (Sep 19, 2023)
COVID Vaccine doses administered (per 100k population) (Sep 19, 2023)
COVID Vaccine doses distributed (Sep 19, 2023)
COVID Vaccine doses administered (Sep 19, 2023)
Likely homosexual households (%)
Likely homosexual households (% change since 2000)
Likely homosexual households - Lesbian couples (%)
Likely homosexual households - Lesbian couples (% change since 2000)
Likely homosexual households - Gay men (%)
Likely homosexual households - Gay men (% change since 2000)
Cost of living index
Median gross rent ($)
Median contract rent ($)
Median monthly housing costs ($)
Median house or condo value ($)
Median house or condo value ($ change since 2000)
Mean house or condo value by units in structure - 1, detached ($)
Mean house or condo value by units in structure - 1, attached ($)
Mean house or condo value by units in structure - 2 ($)
Mean house or condo value by units in structure by units in structure - 3 or 4 ($)
Mean house or condo value by units in structure - 5 or more ($)
Mean house or condo value by units in structure - Boat, RV, van, etc. ($)
Mean house or condo value by units in structure - Mobile home ($)
Median house or condo value ($) - White
Median house or condo value ($) - Black or African American
Median house or condo value ($) - Asian
Median house or condo value ($) - Hispanic or Latino
Median house or condo value ($) - American Indian and Alaska Native
Median house or condo value ($) - Multirace
Median house or condo value ($) - Other Race
Median resident age
Resident age diversity
Median resident age - Males
Median resident age - Females
Median resident age - White
Median resident age - Black or African American
Median resident age - Asian
Median resident age - Hispanic or Latino
Median resident age - American Indian and Alaska Native
Median resident age - Multirace
Median resident age - Other Race
Median resident age - Males - White
Median resident age - Males - Black or African American
Median resident age - Males - Asian
Median resident age - Males - Hispanic or Latino
Median resident age - Males - American Indian and Alaska Native
Median resident age - Males - Multirace
Median resident age - Males - Other Race
Median resident age - Females - White
Median resident age - Females - Black or African American
Median resident age - Females - Asian
Median resident age - Females - Hispanic or Latino
Median resident age - Females - American Indian and Alaska Native
Median resident age - Females - Multirace
Median resident age - Females - Other Race
Commute - mean travel time to work (minutes)
Travel time to work - Less than 5 minutes (%)
Travel time to work - Less than 5 minutes (% change since 2000)
Travel time to work - 5 to 9 minutes (%)
Travel time to work - 5 to 9 minutes (% change since 2000)
Travel time to work - 10 to 19 minutes (%)
Travel time to work - 10 to 19 minutes (% change since 2000)
Travel time to work - 20 to 29 minutes (%)
Travel time to work - 20 to 29 minutes (% change since 2000)
Travel time to work - 30 to 39 minutes (%)
Travel time to work - 30 to 39 minutes (% change since 2000)
Travel time to work - 40 to 59 minutes (%)
Travel time to work - 40 to 59 minutes (% change since 2000)
Travel time to work - 60 to 89 minutes (%)
Travel time to work - 60 to 89 minutes (% change since 2000)
Travel time to work - 90 or more minutes (%)
Travel time to work - 90 or more minutes (% change since 2000)
Marital status - Never married (%)
Marital status - Now married (%)
Marital status - Separated (%)
Marital status - Widowed (%)
Marital status - Divorced (%)
Median family income ($)
Median family income (% change since 2000)
Median non-family income ($)
Median non-family income (% change since 2000)
Median per capita income ($)
Median per capita income (% change since 2000)
Median family income ($) - White
Median family income ($) - Black or African American
Median family income ($) - Asian
Median family income ($) - Hispanic or Latino
Median family income ($) - American Indian and Alaska Native
Median family income ($) - Multirace
Median family income ($) - Other Race
Median year house/condo built
Median year apartment built
Year house built - Built 2005 or later (%)
Year house built - Built 2000 to 2004 (%)
Year house built - Built 1990 to 1999 (%)
Year house built - Built 1980 to 1989 (%)
Year house built - Built 1970 to 1979 (%)
Year house built - Built 1960 to 1969 (%)
Year house built - Built 1950 to 1959 (%)
Year house built - Built 1940 to 1949 (%)
Year house built - Built 1939 or earlier (%)
Average household size
Household density (households per square mile)
Average household size - White
Average household size - Black or African American
Average household size - Asian
Average household size - Hispanic or Latino
Average household size - American Indian and Alaska Native
Average household size - Multirace
Average household size - Other Race
Occupied housing units (%)
Vacant housing units (%)
Owner occupied housing units (%)
Renter occupied housing units (%)
Vacancy status - For rent (%)
Vacancy status - For sale only (%)
Vacancy status - Rented or sold, not occupied (%)
Vacancy status - For seasonal, recreational, or occasional use (%)
Vacancy status - For migrant workers (%)
Vacancy status - Other vacant (%)
Residents with income below the poverty level (%)
Residents with income below 50% of the poverty level (%)
Children below poverty level (%)
Poor families by family type - Married-couple family (%)
Poor families by family type - Male, no wife present (%)
Poor families by family type - Female, no husband present (%)
Poverty status for native-born residents (%)
Poverty status for foreign-born residents (%)
Poverty among high school graduates not in families (%)
Poverty among people who did not graduate high school not in families (%)
Residents with income below the poverty level (%) - White
Residents with income below the poverty level (%) - Black or African American
Residents with income below the poverty level (%) - Asian
Residents with income below the poverty level (%) - Hispanic or Latino
Residents with income below the poverty level (%) - American Indian and Alaska Native
Residents with income below the poverty level (%) - Multirace
Residents with income below the poverty level (%) - Other Race
Air pollution - Air Quality Index (AQI)
Air pollution - CO
Air pollution - NO2
Air pollution - SO2
Air pollution - Ozone
Air pollution - PM10
Air pollution - PM25
Air pollution - Pb
Crime - Murders per 100,000 population
Crime - Rapes per 100,000 population
Crime - Robberies per 100,000 population
Crime - Assaults per 100,000 population
Crime - Burglaries per 100,000 population
Crime - Thefts per 100,000 population
Crime - Auto thefts per 100,000 population
Crime - Arson per 100,000 population
Crime - City-data.com crime index
Crime - Violent crime index
Crime - Property crime index
Crime - Murders per 100,000 population (5 year average)
Crime - Rapes per 100,000 population (5 year average)
Crime - Robberies per 100,000 population (5 year average)
Crime - Assaults per 100,000 population (5 year average)
Crime - Burglaries per 100,000 population (5 year average)
Crime - Thefts per 100,000 population (5 year average)
Crime - Auto thefts per 100,000 population (5 year average)
Crime - Arson per 100,000 population (5 year average)
Crime - City-data.com crime index (5 year average)
Crime - Violent crime index (5 year average)
Crime - Property crime index (5 year average)
1996 Presidential Elections Results (%) - Democratic Party (Clinton)
1996 Presidential Elections Results (%) - Republican Party (Dole)
1996 Presidential Elections Results (%) - Other
2000 Presidential Elections Results (%) - Democratic Party (Gore)
2000 Presidential Elections Results (%) - Republican Party (Bush)
2000 Presidential Elections Results (%) - Other
2004 Presidential Elections Results (%) - Democratic Party (Kerry)
2004 Presidential Elections Results (%) - Republican Party (Bush)
2004 Presidential Elections Results (%) - Other
2008 Presidential Elections Results (%) - Democratic Party (Obama)
2008 Presidential Elections Results (%) - Republican Party (McCain)
2008 Presidential Elections Results (%) - Other
2012 Presidential Elections Results (%) - Democratic Party (Obama)
2012 Presidential Elections Results (%) - Republican Party (Romney)
2012 Presidential Elections Results (%) - Other
2016 Presidential Elections Results (%) - Democratic Party (Clinton)
2016 Presidential Elections Results (%) - Republican Party (Trump)
2016 Presidential Elections Results (%) - Other
2020 Presidential Elections Results (%) - Democratic Party (Biden)
2020 Presidential Elections Results (%) - Republican Party (Trump)
2020 Presidential Elections Results (%) - Other
Ancestries Reported - Arab (%)
Ancestries Reported - Czech (%)
Ancestries Reported - Danish (%)
Ancestries Reported - Dutch (%)
Ancestries Reported - English (%)
Ancestries Reported - French (%)
Ancestries Reported - French Canadian (%)
Ancestries Reported - German (%)
Ancestries Reported - Greek (%)
Ancestries Reported - Hungarian (%)
Ancestries Reported - Irish (%)
Ancestries Reported - Italian (%)
Ancestries Reported - Lithuanian (%)
Ancestries Reported - Norwegian (%)
Ancestries Reported - Polish (%)
Ancestries Reported - Portuguese (%)
Ancestries Reported - Russian (%)
Ancestries Reported - Scotch-Irish (%)
Ancestries Reported - Scottish (%)
Ancestries Reported - Slovak (%)
Ancestries Reported - Subsaharan African (%)
Ancestries Reported - Swedish (%)
Ancestries Reported - Swiss (%)
Ancestries Reported - Ukrainian (%)
Ancestries Reported - United States (%)
Ancestries Reported - Welsh (%)
Ancestries Reported - West Indian (%)
Ancestries Reported - Other (%)
Educational Attainment - No schooling completed (%)
Educational Attainment - Less than high school (%)
Educational Attainment - High school or equivalent (%)
Educational Attainment - Less than 1 year of college (%)
Educational Attainment - 1 or more years of college (%)
Educational Attainment - Associate degree (%)
Educational Attainment - Bachelor's degree (%)
Educational Attainment - Master's degree (%)
Educational Attainment - Professional school degree (%)
Educational Attainment - Doctorate degree (%)
School Enrollment - Nursery, preschool (%)
School Enrollment - Kindergarten (%)
School Enrollment - Grade 1 to 4 (%)
School Enrollment - Grade 5 to 8 (%)
School Enrollment - Grade 9 to 12 (%)
School Enrollment - College undergrad (%)
School Enrollment - Graduate or professional (%)
School Enrollment - Not enrolled in school (%)
School enrollment - Public schools (%)
School enrollment - Private schools (%)
School enrollment - Not enrolled (%)
Median number of rooms in houses and condos
Median number of rooms in apartments
Housing units lacking complete plumbing facilities (%)
Housing units lacking complete kitchen facilities (%)
Density of houses
Urban houses (%)
Rural houses (%)
Households with people 60 years and over (%)
Households with people 65 years and over (%)
Households with people 75 years and over (%)
Households with one or more nonrelatives (%)
Households with no nonrelatives (%)
Population in households (%)
Family households (%)
Nonfamily households (%)
Population in families (%)
Family households with own children (%)
Median number of bedrooms in owner occupied houses
Mean number of bedrooms in owner occupied houses
Median number of bedrooms in renter occupied houses
Mean number of bedrooms in renter occupied houses
Median number of vehichles in owner occupied houses
Mean number of vehichles in owner occupied houses
Median number of vehichles in renter occupied houses
Mean number of vehichles in renter occupied houses
Mortgage status - with mortgage (%)
Mortgage status - with second mortgage (%)
Mortgage status - with home equity loan (%)
Mortgage status - with both second mortgage and home equity loan (%)
Mortgage status - without a mortgage (%)
Average family size
Average family size - White
Average family size - Black or African American
Average family size - Asian
Average family size - Hispanic or Latino
Average family size - American Indian and Alaska Native
Average family size - Multirace
Average family size - Other Race
Geographical mobility - Same house 1 year ago (%)
Geographical mobility - Moved within same county (%)
Geographical mobility - Moved from different county within same state (%)
Geographical mobility - Moved from different state (%)
Geographical mobility - Moved from abroad (%)
Place of birth - Born in state of residence (%)
Place of birth - Born in other state (%)
Place of birth - Native, outside of US (%)
Place of birth - Foreign born (%)
Housing units in structures - 1, detached (%)
Housing units in structures - 1, attached (%)
Housing units in structures - 2 (%)
Housing units in structures - 3 or 4 (%)
Housing units in structures - 5 to 9 (%)
Housing units in structures - 10 to 19 (%)
Housing units in structures - 20 to 49 (%)
Housing units in structures - 50 or more (%)
Housing units in structures - Mobile home (%)
Housing units in structures - Boat, RV, van, etc. (%)
House/condo owner moved in on average (years ago)
Renter moved in on average (years ago)
Year householder moved into unit - Moved in 1999 to March 2000 (%)
Year householder moved into unit - Moved in 1995 to 1998 (%)
Year householder moved into unit - Moved in 1990 to 1994 (%)
Year householder moved into unit - Moved in 1980 to 1989 (%)
Year householder moved into unit - Moved in 1970 to 1979 (%)
Year householder moved into unit - Moved in 1969 or earlier (%)
Means of transportation to work - Drove car alone (%)
Means of transportation to work - Carpooled (%)
Means of transportation to work - Public transportation (%)
Means of transportation to work - Bus or trolley bus (%)
Means of transportation to work - Streetcar or trolley car (%)
Means of transportation to work - Subway or elevated (%)
Means of transportation to work - Railroad (%)
Means of transportation to work - Ferryboat (%)
Means of transportation to work - Taxicab (%)
Means of transportation to work - Motorcycle (%)
Means of transportation to work - Bicycle (%)
Means of transportation to work - Walked (%)
Means of transportation to work - Other means (%)
Working at home (%)
Industry diversity
Most Common Industries - Agriculture, forestry, fishing and hunting, and mining (%)
Most Common Industries - Agriculture, forestry, fishing and hunting (%)
Most Common Industries - Mining, quarrying, and oil and gas extraction (%)
Most Common Industries - Construction (%)
Most Common Industries - Manufacturing (%)
Most Common Industries - Wholesale trade (%)
Most Common Industries - Retail trade (%)
Most Common Industries - Transportation and warehousing, and utilities (%)
Most Common Industries - Transportation and warehousing (%)
Most Common Industries - Utilities (%)
Most Common Industries - Information (%)
Most Common Industries - Finance and insurance, and real estate and rental and leasing (%)
Most Common Industries - Finance and insurance (%)
Most Common Industries - Real estate and rental and leasing (%)
Most Common Industries - Professional, scientific, and management, and administrative and waste management services (%)
Most Common Industries - Professional, scientific, and technical services (%)
Most Common Industries - Management of companies and enterprises (%)
Most Common Industries - Administrative and support and waste management services (%)
Most Common Industries - Educational services, and health care and social assistance (%)
Most Common Industries - Educational services (%)
Most Common Industries - Health care and social assistance (%)
Most Common Industries - Arts, entertainment, and recreation, and accommodation and food services (%)
Most Common Industries - Arts, entertainment, and recreation (%)
Most Common Industries - Accommodation and food services (%)
Most Common Industries - Other services, except public administration (%)
Most Common Industries - Public administration (%)
Occupation diversity
Most Common Occupations - Management, business, science, and arts occupations (%)
Most Common Occupations - Management, business, and financial occupations (%)
Most Common Occupations - Management occupations (%)
Most Common Occupations - Business and financial operations occupations (%)
Most Common Occupations - Computer, engineering, and science occupations (%)
Most Common Occupations - Computer and mathematical occupations (%)
Most Common Occupations - Architecture and engineering occupations (%)
Most Common Occupations - Life, physical, and social science occupations (%)
Most Common Occupations - Education, legal, community service, arts, and media occupations (%)
Most Common Occupations - Community and social service occupations (%)
Most Common Occupations - Legal occupations (%)
Most Common Occupations - Education, training, and library occupations (%)
Most Common Occupations - Arts, design, entertainment, sports, and media occupations (%)
Most Common Occupations - Healthcare practitioners and technical occupations (%)
Most Common Occupations - Health diagnosing and treating practitioners and other technical occupations (%)
Most Common Occupations - Health technologists and technicians (%)
Most Common Occupations - Service occupations (%)
Most Common Occupations - Healthcare support occupations (%)
Most Common Occupations - Protective service occupations (%)
Most Common Occupations - Fire fighting and prevention, and other protective service workers including supervisors (%)
Most Common Occupations - Law enforcement workers including supervisors (%)
Most Common Occupations - Food preparation and serving related occupations (%)
Most Common Occupations - Building and grounds cleaning and maintenance occupations (%)
Most Common Occupations - Personal care and service occupations (%)
Most Common Occupations - Sales and office occupations (%)
Most Common Occupations - Sales and related occupations (%)
Most Common Occupations - Office and administrative support occupations (%)
Most Common Occupations - Natural resources, construction, and maintenance occupations (%)
Most Common Occupations - Farming, fishing, and forestry occupations (%)
Most Common Occupations - Construction and extraction occupations (%)
Most Common Occupations - Installation, maintenance, and repair occupations (%)
Most Common Occupations - Production, transportation, and material moving occupations (%)
Most Common Occupations - Production occupations (%)
Most Common Occupations - Transportation occupations (%)
Most Common Occupations - Material moving occupations (%)
People in Group quarters - Institutionalized population (%)
People in Group quarters - Correctional institutions (%)
People in Group quarters - Federal prisons and detention centers (%)
People in Group quarters - Halfway houses (%)
People in Group quarters - Local jails and other confinement facilities (including police lockups) (%)
People in Group quarters - Military disciplinary barracks (%)
People in Group quarters - State prisons (%)
People in Group quarters - Other types of correctional institutions (%)
People in Group quarters - Nursing homes (%)
People in Group quarters - Hospitals/wards, hospices, and schools for the handicapped (%)
People in Group quarters - Hospitals/wards and hospices for chronically ill (%)
People in Group quarters - Hospices or homes for chronically ill (%)
People in Group quarters - Military hospitals or wards for chronically ill (%)
People in Group quarters - Other hospitals or wards for chronically ill (%)
People in Group quarters - Hospitals or wards for drug/alcohol abuse (%)
People in Group quarters - Mental (Psychiatric) hospitals or wards (%)
People in Group quarters - Schools, hospitals, or wards for the mentally retarded (%)
People in Group quarters - Schools, hospitals, or wards for the physically handicapped (%)
People in Group quarters - Institutions for the deaf (%)
People in Group quarters - Institutions for the blind (%)
People in Group quarters - Orthopedic wards and institutions for the physically handicapped (%)
People in Group quarters - Wards in general hospitals for patients who have no usual home elsewhere (%)
People in Group quarters - Wards in military hospitals for patients who have no usual home elsewhere (%)
People in Group quarters - Juvenile institutions (%)
People in Group quarters - Long-term care (%)
People in Group quarters - Homes for abused, dependent, and neglected children (%)
People in Group quarters - Residential treatment centers for emotionally disturbed children (%)
People in Group quarters - Training schools for juvenile delinquents (%)
People in Group quarters - Short-term care, detention or diagnostic centers for delinquent children (%)
People in Group quarters - Type of juvenile institution unknown (%)
People in Group quarters - Noninstitutionalized population (%)
People in Group quarters - College dormitories (includes college quarters off campus) (%)
People in Group quarters - Military quarters (%)
People in Group quarters - On base (%)
People in Group quarters - Barracks, unaccompanied personnel housing (UPH), (Enlisted/Officer), ;and similar group living quarters for military personnel (%)
People in Group quarters - Transient quarters for temporary residents (%)
People in Group quarters - Military ships (%)
People in Group quarters - Group homes (%)
People in Group quarters - Homes or halfway houses for drug/alcohol abuse (%)
People in Group quarters - Homes for the mentally ill (%)
People in Group quarters - Homes for the mentally retarded (%)
People in Group quarters - Homes for the physically handicapped (%)
People in Group quarters - Other group homes (%)
People in Group quarters - Religious group quarters (%)
People in Group quarters - Dormitories (%)
People in Group quarters - Agriculture workers' dormitories on farms (%)
People in Group quarters - Job Corps and vocational training facilities (%)
People in Group quarters - Other workers' dormitories (%)
People in Group quarters - Crews of maritime vessels (%)
People in Group quarters - Other nonhousehold living situations (%)
People in Group quarters - Other noninstitutional group quarters (%)
Residents speaking English at home (%)
Residents speaking English at home - Born in the United States (%)
Residents speaking English at home - Native, born elsewhere (%)
Residents speaking English at home - Foreign born (%)
Residents speaking Spanish at home (%)
Residents speaking Spanish at home - Born in the United States (%)
Residents speaking Spanish at home - Native, born elsewhere (%)
Residents speaking Spanish at home - Foreign born (%)
Residents speaking other language at home (%)
Residents speaking other language at home - Born in the United States (%)
Residents speaking other language at home - Native, born elsewhere (%)
Residents speaking other language at home - Foreign born (%)
Class of Workers - Employee of private company (%)
Class of Workers - Self-employed in own incorporated business (%)
Class of Workers - Private not-for-profit wage and salary workers (%)
Class of Workers - Local government workers (%)
Class of Workers - State government workers (%)
Class of Workers - Federal government workers (%)
Class of Workers - Self-employed workers in own not incorporated business and Unpaid family workers (%)
House heating fuel used in houses and condos - Utility gas (%)
House heating fuel used in houses and condos - Bottled, tank, or LP gas (%)
House heating fuel used in houses and condos - Electricity (%)
House heating fuel used in houses and condos - Fuel oil, kerosene, etc. (%)
House heating fuel used in houses and condos - Coal or coke (%)
House heating fuel used in houses and condos - Wood (%)
House heating fuel used in houses and condos - Solar energy (%)
House heating fuel used in houses and condos - Other fuel (%)
House heating fuel used in houses and condos - No fuel used (%)
House heating fuel used in apartments - Utility gas (%)
House heating fuel used in apartments - Bottled, tank, or LP gas (%)
House heating fuel used in apartments - Electricity (%)
House heating fuel used in apartments - Fuel oil, kerosene, etc. (%)
House heating fuel used in apartments - Coal or coke (%)
House heating fuel used in apartments - Wood (%)
House heating fuel used in apartments - Solar energy (%)
House heating fuel used in apartments - Other fuel (%)
House heating fuel used in apartments - No fuel used (%)
Armed forces status - In Armed Forces (%)
Armed forces status - Civilian (%)
Armed forces status - Civilian - Veteran (%)
Armed forces status - Civilian - Nonveteran (%)
Fatal accidents locations in years 2005-2021
Fatal accidents locations in 2005
Fatal accidents locations in 2006
Fatal accidents locations in 2007
Fatal accidents locations in 2008
Fatal accidents locations in 2009
Fatal accidents locations in 2010
Fatal accidents locations in 2011
Fatal accidents locations in 2012
Fatal accidents locations in 2013
Fatal accidents locations in 2014
Fatal accidents locations in 2015
Fatal accidents locations in 2016
Fatal accidents locations in 2017
Fatal accidents locations in 2018
Fatal accidents locations in 2019
Fatal accidents locations in 2020
Fatal accidents locations in 2021
Alcohol use - People drinking some alcohol every month (%)
Alcohol use - People not drinking at all (%)
Alcohol use - Average days/month drinking alcohol
Alcohol use - Average drinks/week
Alcohol use - Average days/year people drink much
Audiometry - Average condition of hearing (%)
Audiometry - People that can hear a whisper from across a quiet room (%)
Audiometry - People that can hear normal voice from across a quiet room (%)
Audiometry - Ears ringing, roaring, buzzing (%)
Audiometry - Had a job exposure to loud noise (%)
Audiometry - Had off-work exposure to loud noise (%)
Blood Pressure & Cholesterol - Has high blood pressure (%)
Blood Pressure & Cholesterol - Checking blood pressure at home (%)
Blood Pressure & Cholesterol - Frequently checking blood cholesterol (%)
Blood Pressure & Cholesterol - Has high cholesterol level (%)
Consumer Behavior - Money monthly spent on food at supermarket/grocery store
Consumer Behavior - Money monthly spent on food at other stores
Consumer Behavior - Money monthly spent on eating out
Consumer Behavior - Money monthly spent on carryout/delivered foods
Consumer Behavior - Income spent on food at supermarket/grocery store (%)
Consumer Behavior - Income spent on food at other stores (%)
Consumer Behavior - Income spent on eating out (%)
Consumer Behavior - Income spent on carryout/delivered foods (%)
Current Health Status - General health condition (%)
Current Health Status - Blood donors (%)
Current Health Status - Has blood ever tested for HIV virus (%)
Current Health Status - Left-handed people (%)
Dermatology - People using sunscreen (%)
Diabetes - Diabetics (%)
Diabetes - Had a blood test for high blood sugar (%)
Diabetes - People taking insulin (%)
Diet Behavior & Nutrition - Diet health (%)
Diet Behavior & Nutrition - Milk product consumption (# of products/month)
Diet Behavior & Nutrition - Meals not home prepared (#/week)
Diet Behavior & Nutrition - Meals from fast food or pizza place (#/week)
Diet Behavior & Nutrition - Ready-to-eat foods (#/month)
Diet Behavior & Nutrition - Frozen meals/pizza (#/month)
Drug Use - People that ever used marijuana or hashish (%)
Drug Use - Ever used hard drugs (%)
Drug Use - Ever used any form of cocaine (%)
Drug Use - Ever used heroin (%)
Drug Use - Ever used methamphetamine (%)
Health Insurance - People covered by health insurance (%)
Kidney Conditions-Urology - Avg. # of times urinating at night
Medical Conditions - People with asthma (%)
Medical Conditions - People with anemia (%)
Medical Conditions - People with psoriasis (%)
Medical Conditions - People with overweight (%)
Medical Conditions - Elderly people having difficulties in thinking or remembering (%)
Medical Conditions - People who ever received blood transfusion (%)
Medical Conditions - People having trouble seeing even with glass/contacts (%)
Medical Conditions - People with arthritis (%)
Medical Conditions - People with gout (%)
Medical Conditions - People with congestive heart failure (%)
Medical Conditions - People with coronary heart disease (%)
Medical Conditions - People with angina pectoris (%)
Medical Conditions - People who ever had heart attack (%)
Medical Conditions - People who ever had stroke (%)
Medical Conditions - People with emphysema (%)
Medical Conditions - People with thyroid problem (%)
Medical Conditions - People with chronic bronchitis (%)
Medical Conditions - People with any liver condition (%)
Medical Conditions - People who ever had cancer or malignancy (%)
Mental Health - People who have little interest in doing things (%)
Mental Health - People feeling down, depressed, or hopeless (%)
Mental Health - People who have trouble sleeping or sleeping too much (%)
Mental Health - People feeling tired or having little energy (%)
Mental Health - People with poor appetite or overeating (%)
Mental Health - People feeling bad about themself (%)
Mental Health - People who have trouble concentrating on things (%)
Mental Health - People moving or speaking slowly or too fast (%)
Mental Health - People having thoughts they would be better off dead (%)
Oral Health - Average years since last visit a dentist
Oral Health - People embarrassed because of mouth (%)
Oral Health - People with gum disease (%)
Oral Health - General health of teeth and gums (%)
Oral Health - Average days a week using dental floss/device
Oral Health - Average days a week using mouthwash for dental problem
Oral Health - Average number of teeth
Pesticide Use - Households using pesticides to control insects (%)
Pesticide Use - Households using pesticides to kill weeds (%)
Physical Activity - People doing vigorous-intensity work activities (%)
Physical Activity - People doing moderate-intensity work activities (%)
Physical Activity - People walking or bicycling (%)
Physical Activity - People doing vigorous-intensity recreational activities (%)
Physical Activity - People doing moderate-intensity recreational activities (%)
Physical Activity - Average hours a day doing sedentary activities
Physical Activity - Average hours a day watching TV or videos
Physical Activity - Average hours a day using computer
Physical Functioning - People having limitations keeping them from working (%)
Physical Functioning - People limited in amount of work they can do (%)
Physical Functioning - People that need special equipment to walk (%)
Physical Functioning - People experiencing confusion/memory problems (%)
Physical Functioning - People requiring special healthcare equipment (%)
Prescription Medications - Average number of prescription medicines taking
Preventive Aspirin Use - Adults 40+ taking low-dose aspirin (%)
Reproductive Health - Vaginal deliveries (%)
Reproductive Health - Cesarean deliveries (%)
Reproductive Health - Deliveries resulted in a live birth (%)
Reproductive Health - Pregnancies resulted in a delivery (%)
Reproductive Health - Women breastfeeding newborns (%)
Reproductive Health - Women that had a hysterectomy (%)
Reproductive Health - Women that had both ovaries removed (%)
Reproductive Health - Women that have ever taken birth control pills (%)
Reproductive Health - Women taking birth control pills (%)
Reproductive Health - Women that have ever used Depo-Provera or injectables (%)
Reproductive Health - Women that have ever used female hormones (%)
Sexual Behavior - People 18+ that ever had sex (vaginal, anal, or oral) (%)
Sexual Behavior - Males 18+ that ever had vaginal sex with a woman (%)
Sexual Behavior - Males 18+ that ever performed oral sex on a woman (%)
Sexual Behavior - Males 18+ that ever had anal sex with a woman (%)
Sexual Behavior - Males 18+ that ever had any sex with a man (%)
Sexual Behavior - Females 18+ that ever had vaginal sex with a man (%)
Sexual Behavior - Females 18+ that ever performed oral sex on a man (%)
Sexual Behavior - Females 18+ that ever had anal sex with a man (%)
Sexual Behavior - Females 18+ that ever had any kind of sex with a woman (%)
Sexual Behavior - Average age people first had sex
Sexual Behavior - Average number of female sex partners in lifetime (males 18+)
Sexual Behavior - Average number of female vaginal sex partners in lifetime (males 18+)
Sexual Behavior - Average age people first performed oral sex on a woman (18+)
Sexual Behavior - Average number of woman performed oral sex on in lifetime (18+)
Sexual Behavior - Average number of male sex partners in lifetime (males 18+)
Sexual Behavior - Average number of male anal sex partners in lifetime (males 18+)
Sexual Behavior - Average age people first performed oral sex on a man (18+)
Sexual Behavior - Average number of male oral sex partners in lifetime (18+)
Sexual Behavior - People using protection when performing oral sex (%)
Sexual Behavior - Average number of times people have vaginal or anal sex a year
Sexual Behavior - People having sex without condom (%)
Sexual Behavior - Average number of male sex partners in lifetime (females 18+)
Sexual Behavior - Average number of male vaginal sex partners in lifetime (females 18+)
Sexual Behavior - Average number of female sex partners in lifetime (females 18+)
Sexual Behavior - Circumcised males 18+ (%)
Sleep Disorders - Average hours sleeping at night
Sleep Disorders - People that has trouble sleeping (%)
Smoking-Cigarette Use - People smoking cigarettes (%)
Taste & Smell - People 40+ having problems with smell (%)
Taste & Smell - People 40+ having problems with taste (%)
Taste & Smell - People 40+ that ever had wisdom teeth removed (%)
Taste & Smell - People 40+ that ever had tonsils teeth removed (%)
Taste & Smell - People 40+ that ever had a loss of consciousness because of a head injury (%)
Taste & Smell - People 40+ that ever had a broken nose or other serious injury to face or skull (%)
Taste & Smell - People 40+ that ever had two or more sinus infections (%)
Weight - Average height (inches)
Weight - Average weight (pounds)
Weight - Average BMI
Weight - People that are obese (%)
Weight - People that ever were obese (%)
Weight - People trying to lose weight (%)
100%
urban population.
Estimated median house/condo value in 2022: $406,967
11798:
$406,967New York:
$400,400
According to our research of New York and other state lists, there were 13 registered sex offenders living in 11798 zip code as of May 18, 2024 . The ratio of all residents to sex offenders in zip code 11798 is 1,111 to 1.The ratio of registered sex offenders to all residents in this zip code is near the state average.
Median resident age: This zip code:
36.7 yearsNew York median age:
40.0 years
Average household size: This zip code:
3.5 peopleNew York:
2.5 people
Averages for the 2020 tax year for zip code 11798, filed in 2021:
Average Adjusted Gross Income (AGI) in 2020: $48,299 (Individual Income Tax Returns) Here:
$48,299State:
$90,930
Salary/wage: $45,209 (reported on 87.0% of returns )Here:
$45,209State:
$72,104
(% of AGI for various income ranges: 1236.9% for AGIs below $25k , 3723.8% for AGIs $25k-50k , 6835.1% for AGIs $50k-75k , 10036.5% for AGIs $75k-100k , 17253.3% for AGIs $100k-200k , 58130.0% for AGIs over 200k ) Taxable interest for individuals: $463 (reported on 19.7% of returns )This zip code:
$463New York:
$3,075
(% of AGI for various income ranges: 2.5% for AGIs below $25k , 3.3% for AGIs $25k-50k , 8.3% for AGIs $50k-75k , 31.6% for AGIs $75k-100k , 59.4% for AGIs $100k-200k , 296.7% for AGIs over 200k ) Ordinary dividends: $1,885 (reported on 6.2% of returns )(% of AGI for various income ranges: 1.6% for AGIs below $25k , 2.5% for AGIs $25k-50k , 10.1% for AGIs $50k-75k , 36.3% for AGIs $75k-100k , 66.9% for AGIs $100k-200k , 625.0% for AGIs over 200k ) Net capital gain/loss in AGI: +$5,155 (reported on 6.3% of returns )Here:
+$5,155State:
+$44,925
(% of AGI for various income ranges: 1.3% for AGIs below $25k , 1.9% for AGIs $25k-50k , 19.2% for AGIs $50k-75k , 74.3% for AGIs $75k-100k , 174.3% for AGIs $100k-200k , 2575.0% for AGIs over 200k ) Profit/loss from business: +$4,615 (reported on 16.2% of returns )Here:
+$4,615State:
+$14,940
(% of AGI for various income ranges: 153.5% for AGIs below $25k , 56.6% for AGIs $25k-50k , 42.0% for AGIs $50k-75k , 83.3% for AGIs $75k-100k , 101.8% for AGIs $100k-200k , 896.7% for AGIs over 200k ) Taxable individual retirement arrangement distribution: $14,555 (reported on 2.1% of returns )11798:
$14,555New York:
$19,609
(% of AGI for various income ranges: 11.6% for AGIs below $25k , 14.2% for AGIs $25k-50k , 25.3% for AGIs $50k-75k , 88.8% for AGIs $75k-100k , 301.4% for AGIs $100k-200k ) Total itemized deductions: $27,526 (reported on 13.1% of returns )Here:
$27,526State:
$39,326
(% of AGI for various income ranges: 72.7% for AGIs below $25k , 270.3% for AGIs $25k-50k , 629.8% for AGIs $50k-75k , 1226.3% for AGIs $75k-100k , 1829.0% for AGIs $100k-200k , 5231.7% for AGIs over 200k ) Charity contributions: $5,855 (reported on 9.9% of returns )(% of AGI for various income ranges: 4.8% for AGIs below $25k , 16.8% for AGIs $25k-50k , 82.5% for AGIs $50k-75k , 206.3% for AGIs $75k-100k , 430.8% for AGIs $100k-200k , 1453.3% for AGIs over 200k ) Taxes paid: $11,929 (reported on 13.1% of returns )11798:
$11,929State:
$9,183
(% of AGI for various income ranges: 38.0% for AGIs below $25k , 162.9% for AGIs $25k-50k , 289.6% for AGIs $50k-75k , 460.6% for AGIs $75k-100k , 648.6% for AGIs $100k-200k , 1491.7% for AGIs over 200k ) Earned income credit: $2,455 (reported on 22.7% of returns )(% of AGI for various income ranges: 133.7% for AGIs below $25k , 79.0% for AGIs $25k-50k ) Percentage of individuals using paid preparers for their 2020 taxes: 93.8%(% for various income ranges: 90.9% for AGIs below $25k , 96.2% for AGIs $25k-50k , 95.1% for AGIs $50k-75k , 94.2% for AGIs $75k-100k , 93.9% for AGIs $100k-200k , 94.1% for AGIs over 200k )
Averages for the 2012 tax year for zip code 11798, filed in 2013:
Average Adjusted Gross Income (AGI) in 2012: $40,169 (Individual Income Tax Returns) Here:
$40,169State:
$77,088
Salary/wage: $38,921 (reported on 88.7% of returns )Here:
$38,921State:
$60,593
(% of AGI for various income ranges: 79.9% for AGIs below $25k , 90.1% for AGIs $25k-50k , 87.1% for AGIs $50k-75k , 85.1% for AGIs $75k-100k , 85.7% for AGIs $100k-200k , 83.4% for AGIs over 200k ) Taxable interest for individuals: $426 (reported on 20.1% of returns )This zip code:
$426New York:
$3,125
(% of AGI for various income ranges: 0.3% for AGIs below $25k , 0.1% for AGIs $25k-50k , 0.3% for AGIs $50k-75k , 0.2% for AGIs $75k-100k , 0.2% for AGIs $100k-200k , 0.2% for AGIs over 200k ) Ordinary dividends: $1,702 (reported on 6.2% of returns )(% of AGI for various income ranges: 0.2% for AGIs below $25k , 0.1% for AGIs $25k-50k , 0.3% for AGIs $50k-75k , 0.3% for AGIs $75k-100k , 0.3% for AGIs $100k-200k , 0.7% for AGIs over 200k ) Profit/loss from business: +$6,576 (reported on 13.6% of returns )Here:
+$6,576State:
+$16,168
(% of AGI for various income ranges: 9.7% for AGIs below $25k , 0.9% for AGIs $25k-50k , 1.0% for AGIs $50k-75k , 0.6% for AGIs $75k-100k , 1.2% for AGIs $100k-200k ) Taxable individual retirement arrangement distribution: $10,632 (reported on 3.2% of returns )11798:
$10,632New York:
$17,621
(% of AGI for various income ranges: 0.9% for AGIs below $25k , 0.4% for AGIs $25k-50k , 0.9% for AGIs $50k-75k , 1.4% for AGIs $75k-100k , 1.1% for AGIs $100k-200k ) Total itemized deductions: $23,648 (32% of AGI, reported on 33.5% of returns )Here:
$23,648State:
$34,985
Here:
32.1% of AGIState:
21.3% of AGI
(% of AGI for various income ranges: 9.6% for AGIs below $25k , 16.7% for AGIs $25k-50k , 23.3% for AGIs $50k-75k , 24.9% for AGIs $75k-100k , 24.8% for AGIs $100k-200k , 17.5% for AGIs over 200k ) Charity contributions: $3,258 (reported on 27.0% of returns )(% of AGI for various income ranges: 0.7% for AGIs below $25k , 1.7% for AGIs $25k-50k , 2.6% for AGIs $50k-75k , 2.9% for AGIs $75k-100k , 3.1% for AGIs $100k-200k , 1.8% for AGIs over 200k ) Taxes paid: $9,605 (reported on 33.5% of returns )11798:
$9,605State:
$18,656
(% of AGI for various income ranges: 3.1% for AGIs below $25k , 5.9% for AGIs $25k-50k , 9.1% for AGIs $50k-75k , 10.3% for AGIs $75k-100k , 11.0% for AGIs $100k-200k , 9.7% for AGIs over 200k ) Earned income credit: $2,478 (reported on 29.9% of returns )(% of AGI for various income ranges: 9.8% for AGIs below $25k , 1.4% for AGIs $25k-50k ) Percentage of individuals using paid preparers for their 2012 taxes: 67.5%(% for various income ranges: 66.7% for AGIs below $25k , 65.9% for AGIs $25k-50k , 68.2% for AGIs $50k-75k , 70.8% for AGIs $75k-100k , 72.7% for AGIs $100k-200k , 87.5% for AGIs over 200k )
Averages for the 2004 tax year for zip code 11798, filed in 2005:
Average Adjusted Gross Income (AGI) in 2004: $35,870 (Individual Income Tax Returns) Here:
$35,870State:
$59,519
Salary/wage: $34,843 (reported on 91.8% of returns )Here:
$34,843State:
$50,673
(% of AGI for various income ranges: 89.1% for AGIs below $10k , 88.4% for AGIs $10k-25k , 93.6% for AGIs $25k-50k , 90.3% for AGIs $50k-75k , 87.4% for AGIs $75k-100k , 83.9% for AGIs over 100k ) Taxable interest for individuals: $511 (reported on 30.8% of returns )This zip code:
$511New York:
$2,377
(% of AGI for various income ranges: 1.0% for AGIs below $10k , 0.3% for AGIs $10k-25k , 0.3% for AGIs $25k-50k , 0.3% for AGIs $50k-75k , 0.5% for AGIs $75k-100k , 0.7% for AGIs over 100k ) Taxable dividends: $1,113 (reported on 9.0% of returns )(% of AGI for various income ranges: 0.5% for AGIs below $10k , 0.1% for AGIs $10k-25k , 0.2% for AGIs $25k-50k , 0.3% for AGIs $50k-75k , 0.2% for AGIs $75k-100k , 0.6% for AGIs over 100k ) Net capital gain/loss: +$4,857 (reported on 6.0% of returns )Here:
+$4,857State:
+$23,581
(% of AGI for various income ranges: -0.7% for AGIs below $10k , -0.0% for AGIs $10k-25k , 0.0% for AGIs $25k-50k , -0.0% for AGIs $50k-75k , -0.2% for AGIs $75k-100k , 3.8% for AGIs over 100k ) Profit/loss from business: +$4,171 (reported on 9.1% of returns )Here:
+$4,171State:
+$13,809
(% of AGI for various income ranges: 11.2% for AGIs below $10k , 3.3% for AGIs $10k-25k , -0.4% for AGIs $25k-50k , 0.8% for AGIs $50k-75k , 0.7% for AGIs $75k-100k , 0.7% for AGIs over 100k ) IRA payment deduction: $2,452 (reported on 1.0% of returns )11798:
$2,452New York:
$3,115
(% of AGI for various income ranges: 0.1% for AGIs $10k-25k , 0.1% for AGIs $25k-50k , 0.1% for AGIs $50k-75k , 0.1% for AGIs over 100k ) Total itemized deductions: $20,908 (35% of AGI, reported on 41.5% of returns )Here:
$20,908State:
$25,864
Here:
35.2% of AGIState:
21.9% of AGI
(% of AGI for various income ranges: 10.5% for AGIs below $10k , 15.4% for AGIs $10k-25k , 25.4% for AGIs $25k-50k , 29.3% for AGIs $50k-75k , 28.6% for AGIs $75k-100k , 22.8% for AGIs over 100k ) Charity contributions deductions: $3,284 (5% of AGI, reported on 37.6% of returns )Here:
5.3% of AGIState:
3.6% of AGI
(% of AGI for various income ranges: 0.4% for AGIs below $10k , 1.9% for AGIs $10k-25k , 3.5% for AGIs $25k-50k , 4.1% for AGIs $50k-75k , 4.3% for AGIs $75k-100k , 3.7% for AGIs over 100k ) Total tax: $4,296 (reported on 61.8% of returns )11798:
$4,296State:
$11,730
(% of AGI for various income ranges: 2.3% for AGIs below $10k , 2.5% for AGIs $10k-25k , 4.5% for AGIs $25k-50k , 7.1% for AGIs $50k-75k , 8.9% for AGIs $75k-100k , 14.3% for AGIs over 100k ) Earned income credit: $1,815 (reported on 29.4% of returns )Percentage of individuals using paid preparers for their 2004 taxes: 73.3%(% for various income ranges: 69.7% for AGIs below $10k , 73.7% for AGIs $10k-25k , 73.3% for AGIs $25k-50k , 75.8% for AGIs $50k-75k , 75.7% for AGIs $75k-100k , 75.7% for AGIs over 100k )
Estimated median household income in 2022: This zip code:
$92,287New York:
$79,557
Nearest zip codes: 11704 ,
11747 ,
11703 ,
11735 ,
11729 ,
11757 .
Wyandanch Zip Code Map
Percentage of family households: This zip code:
47.0%New York:
41.3%
Percentage of households with unmarried partners: This zip code:
4.0%New York:
42.3%
Likely homosexual households (counted as self-reported same-sex unmarried-partner households)
Lesbian couples: 0.1% of all households Gay men: 0.2% of all households
Household received Food Stamps/SNAP in the past 12 months: 1,650Household did not receive Food Stamps/SNAP in the past 12 months: 3,561
Women who had a birth in the past 12 months: 159 (49 now married , 113 unmarried) Women who did not have a birth in the past 12 months: 4,163 (1,147 now married , 3,034 unmarried)
Housing units in zip code 11798 with a mortgage: 2,041 (85
second mortgage , 71
both second mortgage and home equity loan )
Houses without a mortgage: 7
Median monthly owner costs for units with a mortgage: $2,787
Median monthly owner costs for units without a mortgage: $1,272
Residents with income below the poverty level in 2022:
This zip code:
15.4%Whole state:
14.3%
Residents with income below 50% of the poverty level in 2022:
This zip code:
9.0%Whole state:
6.8%
Median number of rooms in houses and condos: Median number of rooms in apartments:
Year house built (houses)
22 2020 or later333 2010 to 2019330 2000 to 2009541 1990 to 19991,034 1980 to 1989948 1970 to 1979865 1960 to 1969874 1950 to 1959192 1940 to 1949203 1939 or earlier
Zip code 11798 household income distribution in 2022 450 Less than $10,000212 $10,000 to $14,99948 $15,000 to $19,999162 $20,000 to $24,999205 $25,000 to $29,99944 $30,000 to $34,999148 $35,000 to $39,999161 $40,000 to $44,999109 $45,000 to $49,999243 $50,000 to $59,999484 $60,000 to $74,999570 $75,000 to $99,999465 $100,000 to $124,999494 $125,000 to $149,999656 $150,000 to $199,999673 $200,000 or moreEstimate of home value of owner-occupied houses/condos in 2022 in zip code 11798 8 Less than $10,00019 $10,000 to $14,99910 $15,000 to $19,99931 $25,000 to $29,99921 $30,000 to $34,99922 $35,000 to $39,99914 $40,000 to $49,99916 $60,000 to $69,9995 $90,000 to $99,99964 $125,000 to $149,999142 $150,000 to $174,9994 $175,000 to $199,999230 $200,000 to $249,999414 $250,000 to $299,9991,018 $300,000 to $399,999789 $400,000 to $499,999904 $500,000 to $749,99982 $750,000 to $999,99952 $1,000,000 to $1,499,999Rent paid by renters in 2022 in zip code 11798 14 Less than $10011 $200 to $24921 $250 to $29910 $400 to $44938 $750 to $7998 $800 to $899120 $1,000 to $1,249178 $1,250 to $1,499321 $1,500 to $1,999393 $2,000 to $2,49929 $2,500 to $2,99964 $3,000 to $3,49918 $3,500 or more71 No cash rent
Median gross rent in 2022: $2,089.
Median price asked for vacant for-sale houses and condos in 2022: $1,866,447.
Estimated median house (or condo) value in 2022 for: White Non-Hispanic householders: $525,039Black or African American householders: $373,622American Indian or Alaska Native householders: $375,809Asian householders: $522,306Some other race householders: $447,964Two or more races householders: $379,362Hispanic or Latino householders: $400,954Estimated median house or condo value in 2022: $406,967
11798:
$406,967New York:
$400,400
Lower value quartile - upper value quartile: $310,150 - $515,406
Mean price in 2022: Detached houses: $425,975Here:
$425,975State:
$476,719
Townhouses or other attached units: $337,236Here:
$337,236State:
$699,270
In 2-unit structures: $479,622Here:
$479,622State:
$713,077
In 5-or-more-unit structures: $159,571Here:
$159,571State:
$912,009
Mobile homes: $300,293Here:
$300,293State:
$88,925
Housing units in structures:
One, detached: 3,973One, attached: 568Two: 1603 or 4: 105 to 9: 9210 to 19: 1620 to 49: 2150 or more: 176Mobile homes: 271Unemployment : 4.2%
Means of transportation to work in zip code 11798 52.2% 4,573 Drove a car alone8.6% 751 Carpooled8.9% 782 Bus or trolley bus0.7% 60 Streetcar or trolley car6.4% 560 Subway or elevated0.4% 33 Railroad8.5% 747 Taxi2.3% 200 Bicycle0.6% 52 Walked5.4% 476 Other means6.4% 559 Worked at homeTravel time to work (commute) in zip code 11798 208 Less than 5 minutes968 5 to 9 minutes1,206 10 to 14 minutes950 15 to 19 minutes1,239 20 to 24 minutes464 25 to 29 minutes904 30 to 34 minutes88 35 to 39 minutes206 40 to 44 minutes816 45 to 59 minutes490 60 to 89 minutes501 90 or more minutes
Percentage of zip code residents living and working in this county: 75.9%
Household type by relationship:
Households: 18,063
Male householders: 2,846 (719 living alone ), Female householders: 2,260 (512 living alone )1,877 spouses (1,877 opposite-sex spouses ), 401 unmarried partners , (315 opposite-sex unmarried partners ), 6,006 children (5,524 natural , 352 adopted , 120 stepchildren ), 862 grandchildren , 352 brothers or sisters , 385 parents , 0 foster children , 1,080 other relatives , 1,478 non-relatives In group quarters: 122 (-1 institutionalized population )
Size of family households: 916 2-persons , 777 3-persons , 592 4-persons , 510 5-persons , 174 6-persons , 570 7-or-more-persons
Size of nonfamily households: 1,232 1-person , 190 2-persons , 82 3-persons , 27 6-persons
1,560 married couples with children. single-parent households (488 men , 1,165 women ).
67.4% of residents of 11798 zip code speak English at home. of residents speak Spanish at home (56% very well, 18% well, 22% not well, 3% not at all ).of residents speak other Indo-European language at home (68% very well, 21% well, 7% not well, 3% not at all ).of residents speak other language at home (85% very well, 15% well ).
Foreign born population: 4,394 (24.3%)
(57.1%
of them are naturalized citizens )
This zip code:
24.3%Whole state:
22.7%
24% Costa Rica 19% Haiti 18% Grenada 10% Dominica 4% Guatemala 2% St. Vincent and the Grenadines 2% Guyana 7% Haitian 7% Jamaican 1% American 1% Italian 1% Irish 1% Trinidadian and Tobagonian 1% Polish
Year of entry for the foreign-born population
1,482 2010 or later 1,234 2000 to 2009 1,132 1990 to 1999 1,385 Before 1990
Facilities with environmental interests located in this zip code:
AMERICAN ENVIRONMENTAL ASSESSMENT CORP (188 LONG ISLAND AVE in WYANDANCH, NY)
STATE MASTER (New Jersey environmental info) - NJEMS-00965, UNDERGROUND STORAGE TANK PROGRAM, NJEMS-257428, REFUSE DISPOSAL, NJEMS-NYR00004412, TRANSPORTER Large Quantity Generators, more that 1000 kg of hazardous waste/month (Resource Conservation and Recovery Act (tracking hazardous waste)) TRANSPORTER (Resource Conservation and Recovery Act (tracking hazardous waste)) Organizations: DAN HIRSCHBERGER (CONTACT/OWNER)
ABC CLEANERS (34 COLONIAL SPRINGS RD in WHEATLEY HEIGHTS, NY)
AIR MINOR (AIRS/AFS) STATE MASTER (New York facility tracking) - AIR PROGRAM, HAZARDOUS WASTE PROGRAM Conditionally Exempt Small Quantity Generators, less than 100 kg/month of hazardous waste (Resource Conservation and Recovery Act (tracking hazardous waste)) Business SIC classification: DRYCLEANING PLANTS, EXCEPT RUG CLEANINGBusiness NAICS classification: DRYCLEANING AND LAUNDRY SERVICES (EXCEPT COIN-OPERATED).
18TH STREET GARAGE (8 S 18TH ST in WYANDANCH, NY)
(Resource Conservation and Recovery Act (tracking hazardous waste))
ALL SYSTEMS BRAKE SERVICE (110 WYANDANCH AVE in WYANDANCH, NY)
(Resource Conservation and Recovery Act (tracking hazardous waste))
GETTY PETROLEUM CORP (1622 STRAIGHT PATH in WYANDANCH, NY)
(Resource Conservation and Recovery Act (tracking hazardous waste))
HESS STATION 32308 (STRAIGHT PATH & ANDREW AVE in WYANDANCH, NY)
(Resource Conservation and Recovery Act (tracking hazardous waste))
ISLAND MUSCLECARS & RESTORATIONS INC (80-B WYANDANCH AVE in WYANDANCH, NY)
(Resource Conservation and Recovery Act (tracking hazardous waste))
ISLAND TRUCK REPAIR (330 LONG ISLAND AVE in WYANDANCH, NY)
Small Quantity Generators, between 100 kg and 1000 kg of hazardous waste/month (Resource Conservation and Recovery Act (tracking hazardous waste)) Organizations: ARK PROPRTY MNG LLC (CONTACT/OWNER)
CONSERVATIVE GAS DIV OF NATL PROPANE CP (18TH ST & MERRITT AVE in WYANDANCH, NY)
(Resource Conservation and Recovery Act (tracking hazardous waste))
COMBINED CONTAINERS INDUSTRIES (263 MERRITT AVE in WYANDANCH, NY)
(Resource Conservation and Recovery Act (tracking hazardous waste))
ARTISTIC SIGNS & DISPLAYS INC (1363 STRAIGHT PATH AVE in WYANDANCH, NY)
Small Quantity Generators, between 100 kg and 1000 kg of hazardous waste/month (Resource Conservation and Recovery Act (tracking hazardous waste)) - notification Organizations: ROBERT G STAHLMAN (CONTACT/OWNER)
GLENN BONELLI & ASSOCIATES INC (9 GARRISON AVE in WYANDANCH, NY)
TRANSPORTER (Resource Conservation and Recovery Act (tracking hazardous waste)) - notification
CRESCENT PACKING (5 WASHINGTON AVENUE in WYANDANCH, NY)
ENFORCEMENT/COMPLIANCE ACTIVITY (Integrated Compliance Information System)
Housing units lacking complete plumbing facilities: 1.6%
Housing units lacking complete kitchen facilities: 2.8%
54.1% Fuel oil, kerosene, etc. 27.1% Utility gas 14.5% Electricity 3.7% Bottled, tank, or LP gas
Population in 1990: 13,312. Population change in the 1990s: +1,887 (+14.2%).
Place of birth for U.S.-born residents:
This state: 11,297Northeast: 488Midwest: 111South: 755West: 152
65% of the 11798 zip code residents lived in the same house 5 years ago.
Out of people who lived in different houses, 69% lived in this county.
Out of people who lived in different counties, 50% lived in New York.
95% of the 11798 zip code residents lived in the same house 1 year ago.
Out of people who lived in different houses, 52% moved from this county.
Out of people who lived in different houses, 21% moved from different county within same state.
Out of people who lived in different houses, 17% moved from different state.
Out of people who lived in different houses, 9% moved from abroad.
Private vs. public school enrollment:
Students in private schools in grades 1 to 8 (elementary and middle school): 66
Students in private schools in grades 9 to 12 (high school): 36
Students in private undergraduate colleges: 231
Occupation by median earnings in the past 12 months ($)
151,661 Computer and mathematical occupations 101,518 Law enforcement workers including supervisors 90,245 Architecture and engineering occupations 88,968 Management occupations 84,413 Legal occupations 82,252 Life, physical, and social science occupations
Companies with federal contracts located in this zip code:
CHECK-MATE INDUSTRIES INC (777 MOUNT AVE in WYANDANCH, NY; small business) employees , $0 revenue . : $20,947,805 in 83 contracts from 1999 to 2006
Contracts for Guns, through 30 mm, Guns, over 30 mm up to 75 mm, Ammunition, through 30 mm, Coil, Flat, Leaf, and Wire Springs, and more by Army, Defense Logistics AgencySigned by year: 2000: $969,819; 2001: $867,187; 2002: $1,537,934; 2003: $3,962,742; 2004: $5,123,082; 2005: $7,758,803; 2006: $694,913.
Biggest contracts: with Army for Guns, through 30 mm. Signed on 2005-02-15. Completion date: 2006-01-30.
, same as above. Signed on 2005-07-13. Completion date: 2006-05-31.
, same as above. Signed on 2004-07-20. Completion date: 2005-09-30.
, same as above. Signed on 2004-03-24. Completion date: 2005-09-30.
Top industries in this zip code by the number of employees in 2005:
Wholesale Trade: Confectionery Merchant Wholesalers (100-249 employees: 1 establishment, 1-4 employees: 2 establishments)Wholesale Trade: Beer and Ale Merchant Wholesalers (100-249: 1, 1-4: 1)Management of Companies and Enterprises: Corporate, Subsidiary, and Regional Managing Offices (50-99: 1)
People in group quarters in 2010:
48 people in emergency and transitional shelters (with sleeping facilities) for people experiencing homelessness
43 people in other noninstitutional facilities
16 people in residential treatment centers for adults
6 people in correctional residential facilities
5 people in group homes for juveniles (non-correctional)
People in group quarters in 2000:
110 people in other noninstitutional group quarters
12 people in homes for the mentally retarded
9 people in other group homes
4 people in college dormitories (includes college quarters off campus)
Fatal accident statistics in 2014:
Fatal accident count: 1Vehicles involved in fatal accidents: 3Fatal accidents caused by drunken drivers: 0Fatalities: 1Persons involved in fatal accidents: 3Pedestrians involved in fatal accidents: 0
Fatal accident statistics in 2012:
Fatal accident count: 1Vehicles involved in fatal accidents: 2Fatal accidents caused by drunken drivers: 0Fatalities: 1Persons involved in fatal accidents: 2Pedestrians involved in fatal accidents: 0
Home Mortgage Disclosure Act Aggregated Statistics For Year 2009(Based on 4 full and 6 partial tracts) A) FHA, FSA/RHS & VA B) Conventional C) Refinancings D) Home Improvement Loans F) Non-occupant Loans on G) Loans On Manufactured Number Average Value Number Average Value Number Average Value Number Average Value Number Average Value Number Average Value
LOANS ORIGINATED 55 $249,067 32 $256,300 162 $245,649 5 $148,028 8 $143,852 2 $230,860 APPLICATIONS APPROVED, NOT ACCEPTED 0 $0 9 $186,013 15 $191,541 9 $61,108 4 $135,418 0 $0 APPLICATIONS DENIED 23 $253,459 22 $184,995 185 $249,070 20 $67,835 9 $123,402 0 $0 APPLICATIONS WITHDRAWN 19 $225,926 5 $232,108 99 $260,104 6 $139,385 7 $149,524 0 $0 FILES CLOSED FOR INCOMPLETENESS 7 $241,366 2 $360,245 19 $255,922 6 $129,483 0 $0 0 $0
Aggregated Statistics For Year 2008(Based on 4 full and 6 partial tracts) A) FHA, FSA/RHS & VA B) Conventional C) Refinancings D) Home Improvement Loans E) Loans on Dwellings For 5+ Families F) Non-occupant Loans on Number Average Value Number Average Value Number Average Value Number Average Value Number Average Value Number Average Value
LOANS ORIGINATED 50 $290,911 81 $256,364 193 $250,026 45 $79,921 2 $317,915 34 $181,665 APPLICATIONS APPROVED, NOT ACCEPTED 0 $0 37 $271,394 43 $283,894 13 $75,288 0 $0 9 $175,384 APPLICATIONS DENIED 30 $315,436 82 $275,155 413 $275,328 106 $65,135 0 $0 47 $223,569 APPLICATIONS WITHDRAWN 13 $249,898 23 $286,650 110 $242,896 15 $188,124 0 $0 3 $184,710 FILES CLOSED FOR INCOMPLETENESS 1 $333,530 11 $264,323 44 $254,186 5 $107,002 0 $0 4 $142,145
Aggregated Statistics For Year 2007(Based on 4 full and 6 partial tracts) A) FHA, FSA/RHS & VA B) Conventional C) Refinancings D) Home Improvement Loans E) Loans on Dwellings For 5+ Families F) Non-occupant Loans on G) Loans On Manufactured Number Average Value Number Average Value Number Average Value Number Average Value Number Average Value Number Average Value Number Average Value
LOANS ORIGINATED 37 $288,584 307 $241,873 638 $258,535 124 $127,656 0 $0 98 $223,146 0 $0 APPLICATIONS APPROVED, NOT ACCEPTED 6 $314,033 100 $239,846 175 $241,628 53 $96,314 0 $0 31 $261,960 0 $0 APPLICATIONS DENIED 7 $229,889 399 $238,148 849 $283,373 178 $94,131 0 $0 107 $256,546 2 $215,975 APPLICATIONS WITHDRAWN 6 $279,095 110 $277,180 287 $251,572 22 $144,967 2 $317,915 32 $213,281 0 $0 FILES CLOSED FOR INCOMPLETENESS 2 $307,815 46 $290,775 132 $294,300 9 $161,053 0 $0 9 $214,620 2 $344,695
Aggregated Statistics For Year 2006(Based on 4 full and 6 partial tracts) A) FHA, FSA/RHS & VA B) Conventional C) Refinancings D) Home Improvement Loans F) Non-occupant Loans on G) Loans On Manufactured Number Average Value Number Average Value Number Average Value Number Average Value Number Average Value Number Average Value
LOANS ORIGINATED 24 $296,349 950 $195,170 1,029 $237,150 134 $121,341 215 $198,950 0 $0 APPLICATIONS APPROVED, NOT ACCEPTED 2 $367,780 160 $201,745 215 $231,983 45 $101,724 48 $186,334 0 $0 APPLICATIONS DENIED 2 $232,410 569 $197,763 787 $248,193 183 $117,752 171 $208,950 1 $34,930 APPLICATIONS WITHDRAWN 11 $267,559 297 $175,957 482 $227,888 71 $161,325 79 $185,122 0 $0 FILES CLOSED FOR INCOMPLETENESS 0 $0 67 $187,605 164 $246,067 9 $189,743 21 $262,222 0 $0
Aggregated Statistics For Year 2005(Based on 4 full and 6 partial tracts) A) FHA, FSA/RHS & VA B) Conventional C) Refinancings D) Home Improvement Loans E) Loans on Dwellings For 5+ Families F) Non-occupant Loans on G) Loans On Manufactured Number Average Value Number Average Value Number Average Value Number Average Value Number Average Value Number Average Value Number Average Value
LOANS ORIGINATED 25 $245,686 973 $184,365 1,122 $217,279 130 $134,390 0 $0 276 $171,904 0 $0 APPLICATIONS APPROVED, NOT ACCEPTED 4 $262,702 152 $198,099 218 $199,754 26 $61,290 0 $0 41 $181,015 0 $0 APPLICATIONS DENIED 8 $222,271 502 $180,167 817 $213,440 190 $107,624 2 $156,905 130 $184,491 5 $105,710 APPLICATIONS WITHDRAWN 15 $286,014 338 $185,014 529 $209,553 64 $177,222 0 $0 75 $215,623 0 $0 FILES CLOSED FOR INCOMPLETENESS 4 $269,998 67 $168,041 296 $252,327 7 $96,860 0 $0 32 $210,386 0 $0
Aggregated Statistics For Year 2004(Based on 4 full and 6 partial tracts) A) FHA, FSA/RHS & VA B) Conventional C) Refinancings D) Home Improvement Loans F) Non-occupant Loans on G) Loans On Manufactured Number Average Value Number Average Value Number Average Value Number Average Value Number Average Value Number Average Value
LOANS ORIGINATED 53 $210,121 674 $188,015 1,030 $187,099 127 $133,359 252 $159,875 4 $11,838 APPLICATIONS APPROVED, NOT ACCEPTED 2 $97,335 101 $210,441 286 $186,946 29 $85,916 57 $174,006 0 $0 APPLICATIONS DENIED 13 $202,782 228 $207,143 777 $181,206 157 $98,859 97 $179,239 2 $224,865 APPLICATIONS WITHDRAWN 23 $206,776 133 $190,932 654 $191,738 60 $115,205 82 $167,630 1 $101,410 FILES CLOSED FOR INCOMPLETENESS 9 $209,849 30 $182,961 232 $184,519 14 $111,906 12 $202,502 0 $0
Aggregated Statistics For Year 2003(Based on 4 full and 6 partial tracts) A) FHA, FSA/RHS & VA B) Conventional C) Refinancings D) Home Improvement Loans E) Loans on Dwellings For 5+ Families F) Non-occupant Loans on Number Average Value Number Average Value Number Average Value Number Average Value Number Average Value Number Average Value
LOANS ORIGINATED 123 $181,173 397 $191,324 1,140 $161,737 55 $40,422 1 $1,859,220 227 $120,947 APPLICATIONS APPROVED, NOT ACCEPTED 10 $194,521 70 $194,239 292 $159,619 26 $28,794 0 $0 33 $139,748 APPLICATIONS DENIED 17 $206,330 156 $178,364 670 $163,124 112 $30,458 0 $0 63 $140,662 APPLICATIONS WITHDRAWN 31 $162,081 85 $176,318 578 $153,742 25 $59,781 0 $0 29 $120,663 FILES CLOSED FOR INCOMPLETENESS 7 $225,830 13 $249,842 92 $153,859 9 $72,726 0 $0 18 $115,823
Aggregated Statistics For Year 2002(Based on 4 full and 6 partial tracts) A) FHA, FSA/RHS & VA B) Conventional C) Refinancings D) Home Improvement Loans F) Non-occupant Loans on Number Average Value Number Average Value Number Average Value Number Average Value Number Average Value
LOANS ORIGINATED 107 $162,386 361 $160,314 738 $135,615 71 $34,958 172 $105,160 APPLICATIONS APPROVED, NOT ACCEPTED 6 $138,643 79 $157,628 220 $130,190 22 $47,352 19 $110,043 APPLICATIONS DENIED 19 $173,445 114 $135,081 547 $129,705 112 $25,801 52 $112,857 APPLICATIONS WITHDRAWN 34 $159,497 95 $153,025 524 $143,706 65 $45,514 33 $97,814 FILES CLOSED FOR INCOMPLETENESS 4 $120,092 25 $138,565 166 $118,381 5 $47,208 15 $105,591
Aggregated Statistics For Year 2001(Based on 4 full and 6 partial tracts) A) FHA, FSA/RHS & VA B) Conventional C) Refinancings D) Home Improvement Loans F) Non-occupant Loans on Number Average Value Number Average Value Number Average Value Number Average Value Number Average Value
LOANS ORIGINATED 129 $147,022 212 $127,970 531 $132,586 52 $42,891 114 $86,232 APPLICATIONS APPROVED, NOT ACCEPTED 14 $126,653 45 $133,822 137 $104,256 26 $25,794 24 $115,112 APPLICATIONS DENIED 22 $143,774 129 $110,156 536 $108,777 157 $27,048 61 $96,684 APPLICATIONS WITHDRAWN 25 $149,886 59 $119,969 398 $114,538 70 $34,931 19 $79,626 FILES CLOSED FOR INCOMPLETENESS 6 $170,265 11 $122,604 42 $126,527 3 $95,400 4 $79,142
Aggregated Statistics For Year 2000(Based on 4 full and 6 partial tracts) A) FHA, FSA/RHS & VA B) Conventional C) Refinancings D) Home Improvement Loans E) Loans on Dwellings For 5+ Families F) Non-occupant Loans on Number Average Value Number Average Value Number Average Value Number Average Value Number Average Value Number Average Value
LOANS ORIGINATED 121 $129,815 214 $124,237 260 $95,657 64 $19,703 2 $5,768,505 107 $70,884 APPLICATIONS APPROVED, NOT ACCEPTED 11 $111,998 47 $101,159 97 $100,747 68 $27,679 0 $0 10 $63,154 APPLICATIONS DENIED 28 $136,361 207 $129,308 503 $88,232 167 $27,032 2 $131,100 58 $87,135 APPLICATIONS WITHDRAWN 54 $129,757 53 $122,011 344 $82,351 20 $45,772 2 $79,455 19 $71,017 FILES CLOSED FOR INCOMPLETENESS 7 $105,143 12 $119,832 97 $103,655 5 $23,712 0 $0 10 $103,131
Aggregated Statistics For Year 1999(Based on 2 full and 3 partial tracts) A) FHA, FSA/RHS & VA B) Conventional C) Refinancings D) Home Improvement Loans E) Loans on Dwellings For 5+ Families F) Non-occupant Loans on Number Average Value Number Average Value Number Average Value Number Average Value Number Average Value Number Average Value
LOANS ORIGINATED 65 $127,571 96 $115,174 206 $96,102 73 $16,557 3 $104,497 39 $63,820 APPLICATIONS APPROVED, NOT ACCEPTED 0 $0 30 $117,931 124 $97,980 22 $22,793 0 $0 9 $67,144 APPLICATIONS DENIED 9 $117,977 44 $113,610 199 $90,142 60 $28,280 0 $0 22 $90,879 APPLICATIONS WITHDRAWN 11 $87,367 19 $104,551 193 $84,997 16 $36,519 3 $110,937 16 $88,682 FILES CLOSED FOR INCOMPLETENESS 3 $104,577 3 $119,557 43 $98,214 2 $43,700 0 $0 4 $62,800
Private Mortgage Insurance Companies Aggregated Statistics For Year 2009(Based on 4 full and 6 partial tracts) A) Conventional B) Refinancings C) Non-occupant Loans on Number Average Value Number Average Value Number Average Value
LOANS ORIGINATED 1 $294,680 5 $228,908 0 $0 APPLICATIONS APPROVED, NOT ACCEPTED 6 $259,417 4 $286,680 0 $0 APPLICATIONS DENIED 3 $180,663 9 $250,220 0 $0 APPLICATIONS WITHDRAWN 1 $160,010 0 $0 0 $0 FILES CLOSED FOR INCOMPLETENESS 1 $251,560 0 $0 1 $251,560
Aggregated Statistics For Year 2008(Based on 4 full and 6 partial tracts) A) Conventional B) Refinancings C) Non-occupant Loans on D) Loans On Manufactured Number Average Value Number Average Value Number Average Value Number Average Value
LOANS ORIGINATED 50 $276,889 27 $338,151 11 $216,061 1 $181,410 APPLICATIONS APPROVED, NOT ACCEPTED 61 $295,099 13 $372,122 8 $275,584 0 $0 APPLICATIONS DENIED 18 $260,898 12 $323,745 7 $322,897 0 $0 APPLICATIONS WITHDRAWN 16 $256,788 7 $349,849 4 $255,252 0 $0 FILES CLOSED FOR INCOMPLETENESS 10 $267,177 0 $0 4 $280,590 0 $0
Aggregated Statistics For Year 2007(Based on 4 full and 6 partial tracts) A) Conventional B) Refinancings C) Non-occupant Loans on Number Average Value Number Average Value Number Average Value
LOANS ORIGINATED 58 $296,144 52 $327,979 5 $199,728 APPLICATIONS APPROVED, NOT ACCEPTED 34 $293,350 19 $303,341 6 $238,190 APPLICATIONS DENIED 9 $389,302 0 $0 0 $0 APPLICATIONS WITHDRAWN 17 $237,254 2 $251,850 4 $264,342 FILES CLOSED FOR INCOMPLETENESS 1 $174,650 2 $352,585 0 $0
Aggregated Statistics For Year 2006(Based on 4 full and 6 partial tracts) A) Conventional B) Refinancings C) Non-occupant Loans on D) Loans On Manufactured Number Average Value Number Average Value Number Average Value Number Average Value
LOANS ORIGINATED 58 $246,762 27 $299,502 16 $224,054 2 $220,865 APPLICATIONS APPROVED, NOT ACCEPTED 23 $264,786 19 $281,608 6 $198,700 0 $0 APPLICATIONS DENIED 0 $0 2 $339,675 0 $0 0 $0 APPLICATIONS WITHDRAWN 5 $223,388 11 $235,116 2 $206,875 0 $0 FILES CLOSED FOR INCOMPLETENESS 2 $186,720 0 $0 0 $0 0 $0
Aggregated Statistics For Year 2005(Based on 4 full and 6 partial tracts) A) Conventional B) Refinancings C) Non-occupant Loans on Number Average Value Number Average Value Number Average Value
LOANS ORIGINATED 84 $254,175 32 $272,386 10 $218,172 APPLICATIONS APPROVED, NOT ACCEPTED 35 $238,381 9 $201,666 4 $137,558 APPLICATIONS DENIED 3 $212,233 0 $0 0 $0 APPLICATIONS WITHDRAWN 12 $244,063 0 $0 0 $0 FILES CLOSED FOR INCOMPLETENESS 2 $215,870 0 $0 0 $0
Aggregated Statistics For Year 2004(Based on 4 full and 6 partial tracts) A) Conventional B) Refinancings C) Non-occupant Loans on Number Average Value Number Average Value Number Average Value
LOANS ORIGINATED 187 $220,042 22 $221,264 46 $167,421 APPLICATIONS APPROVED, NOT ACCEPTED 64 $221,349 24 $227,593 5 $174,260 APPLICATIONS DENIED 0 $0 2 $233,255 0 $0 APPLICATIONS WITHDRAWN 10 $190,644 9 $217,153 4 $158,415 FILES CLOSED FOR INCOMPLETENESS 7 $188,447 0 $0 0 $0
Aggregated Statistics For Year 2003(Based on 4 full and 6 partial tracts) A) Conventional B) Refinancings C) Non-occupant Loans on Number Average Value Number Average Value Number Average Value
LOANS ORIGINATED 168 $197,665 72 $200,450 24 $135,909 APPLICATIONS APPROVED, NOT ACCEPTED 55 $184,449 33 $190,857 4 $91,345 APPLICATIONS DENIED 11 $153,820 2 $121,925 2 $139,050 APPLICATIONS WITHDRAWN 20 $209,089 5 $214,850 2 $106,270 FILES CLOSED FOR INCOMPLETENESS 2 $58,745 2 $170,895 0 $0
Aggregated Statistics For Year 2002(Based on 4 full and 6 partial tracts) A) Conventional B) Refinancings C) Non-occupant Loans on Number Average Value Number Average Value Number Average Value
LOANS ORIGINATED 163 $171,581 46 $170,044 13 $134,738 APPLICATIONS APPROVED, NOT ACCEPTED 47 $160,926 26 $167,623 8 $135,102 APPLICATIONS DENIED 13 $169,081 0 $0 0 $0 APPLICATIONS WITHDRAWN 16 $163,948 4 $137,558 4 $77,785 FILES CLOSED FOR INCOMPLETENESS 8 $115,571 0 $0 4 $111,932
Aggregated Statistics For Year 2001(Based on 4 full and 6 partial tracts) A) Conventional B) Refinancings C) Non-occupant Loans on Number Average Value Number Average Value Number Average Value
LOANS ORIGINATED 88 $144,330 34 $163,488 19 $105,744 APPLICATIONS APPROVED, NOT ACCEPTED 34 $111,001 4 $152,038 2 $80,950 APPLICATIONS DENIED 3 $171,343 0 $0 0 $0 APPLICATIONS WITHDRAWN 4 $116,998 0 $0 2 $95,940 FILES CLOSED FOR INCOMPLETENESS 1 $101,410 3 $187,427 0 $0
Aggregated Statistics For Year 2000(Based on 4 full and 6 partial tracts) A) Conventional B) Refinancings C) Non-occupant Loans on Number Average Value Number Average Value Number Average Value
LOANS ORIGINATED 80 $127,594 28 $134,224 22 $86,886 APPLICATIONS APPROVED, NOT ACCEPTED 11 $123,260 0 $0 0 $0 APPLICATIONS DENIED 5 $58,704 0 $0 2 $62,960 APPLICATIONS WITHDRAWN 12 $175,673 2 $124,150 2 $142,915 FILES CLOSED FOR INCOMPLETENESS 2 $74,295 0 $0 0 $0
Aggregated Statistics For Year 1999(Based on 2 full and 3 partial tracts) A) Conventional B) Refinancings C) Non-occupant Loans on Number Average Value Number Average Value Number Average Value
LOANS ORIGINATED 30 $133,366 15 $119,496 5 $77,632 APPLICATIONS APPROVED, NOT ACCEPTED 6 $129,263 1 $85,600 0 $0 APPLICATIONS DENIED 3 $161,283 1 $233,210 0 $0 APPLICATIONS WITHDRAWN 2 $104,325 2 $88,670 0 $0 FILES CLOSED FOR INCOMPLETENESS 0 $0 0 $0 0 $0
2002 - 2018 National Fire Incident Reporting System (NFIRS) incidents See full 2006 National Fire Incident Reporting System statistics for zip code 11798, New York
Most common first names in zip code 11798 among deceased individuals Name Count Lived (average)
John 63 71.7 years James 55 66.4 years William 54 72.2 years Mary 43 69.8 years Joseph 41 70.1 years Robert 34 61.3 years Willie 31 64.1 years George 30 66.1 years Charles 27 63.7 years Dorothy 17 66.7 years
Most common last names in zip code 11798 among deceased individuals Last name Count Lived (average)
Williams 35 67.8 years Brown 32 62.4 years Johnson 30 64.5 years Smith 28 63.9 years Jones 27 65.6 years Walker 17 69.5 years Jackson 15 60.1 years Thomas 15 69.6 years Wilson 14 68.7 years Anderson 13 64.7 years
Businesses in zip code 11798
Ace Hardware: 1Domino's Pizza: 1Subway: 1
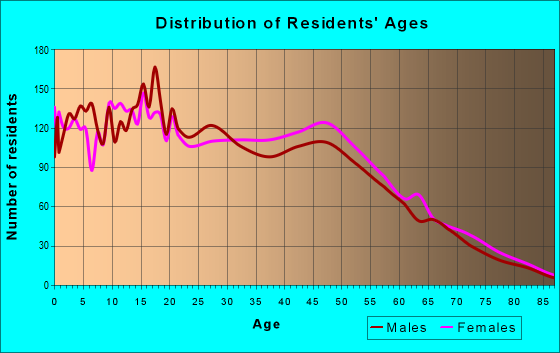
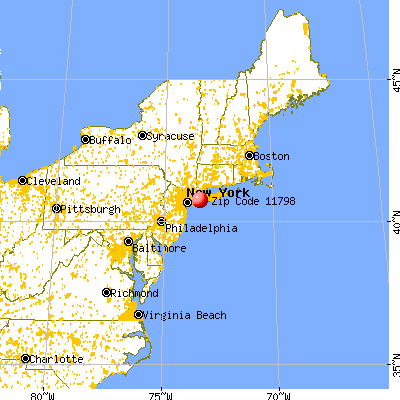


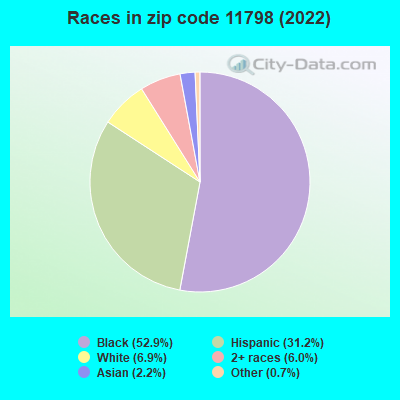


 Nearest zip codes: 11704, 11747, 11703, 11735, 11729, 11757.
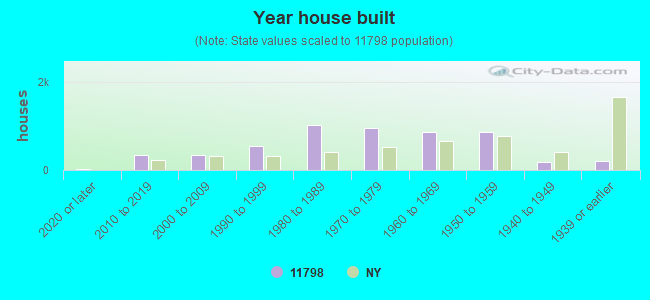
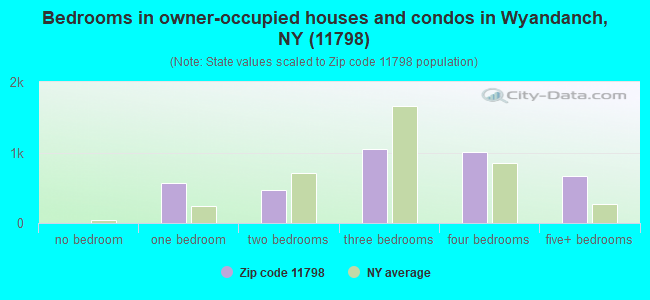
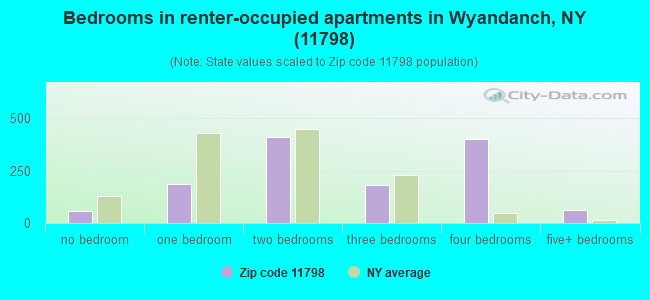
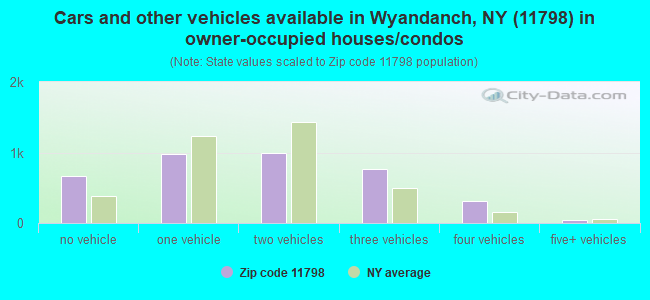
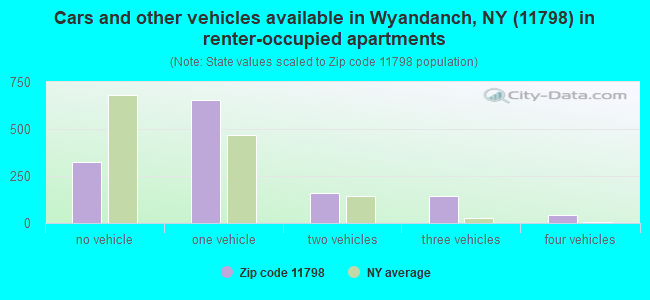


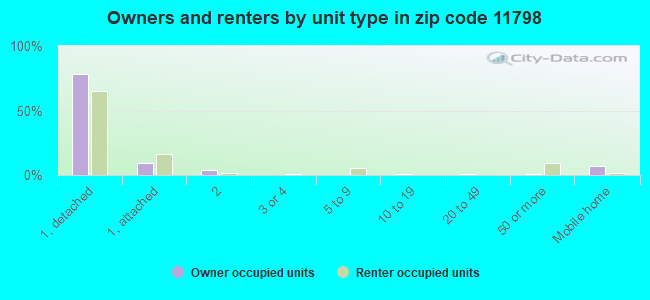
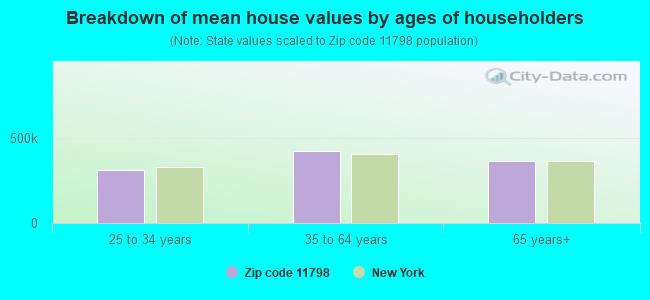


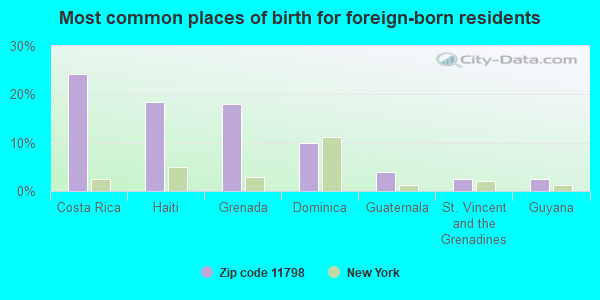
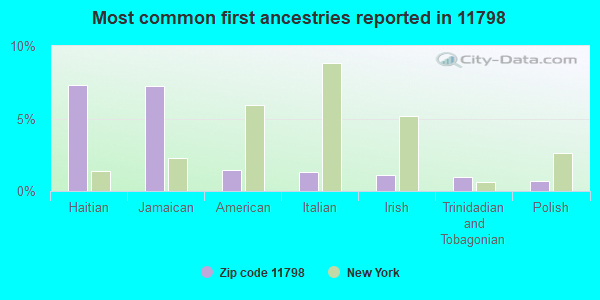
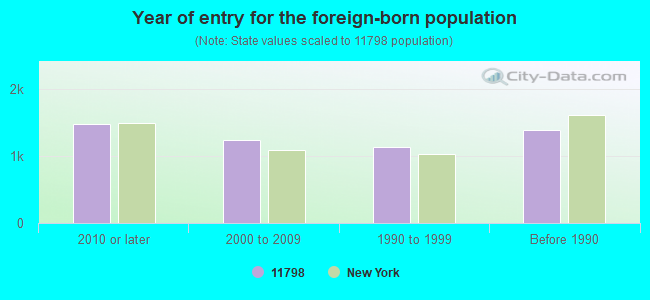


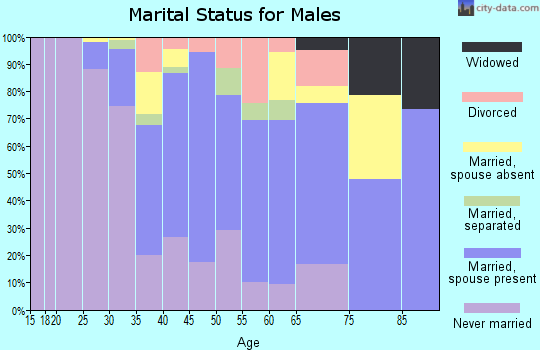
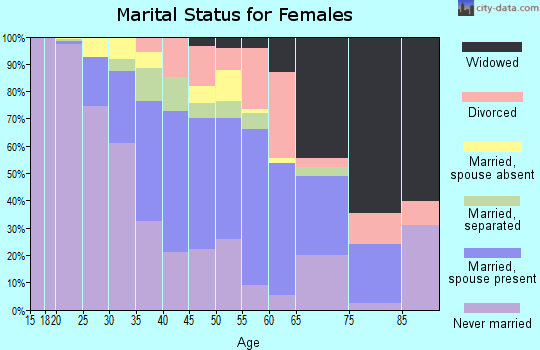
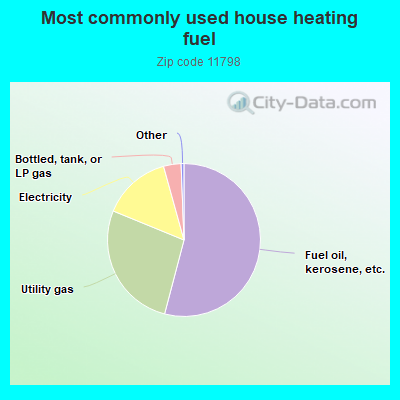
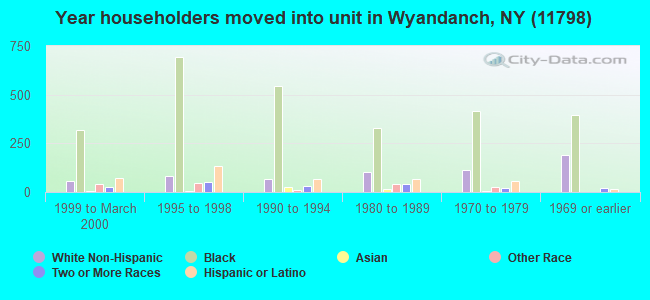
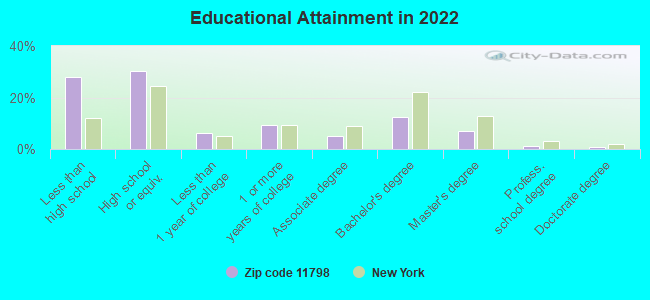
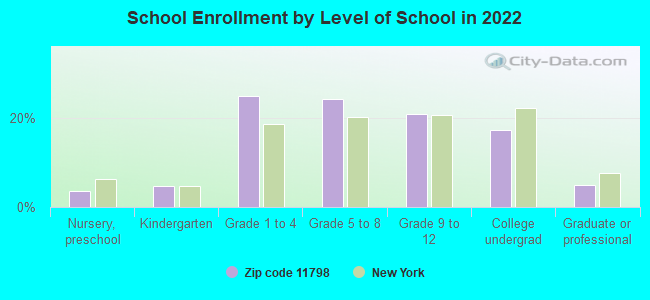
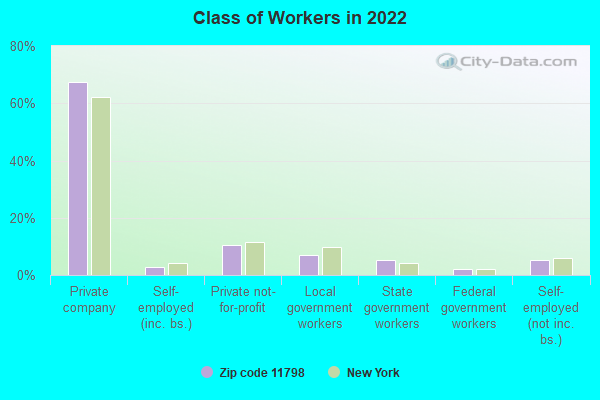
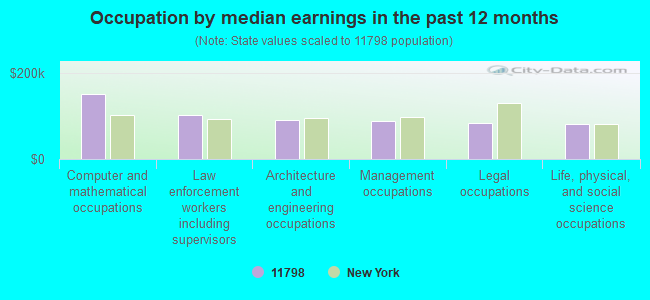
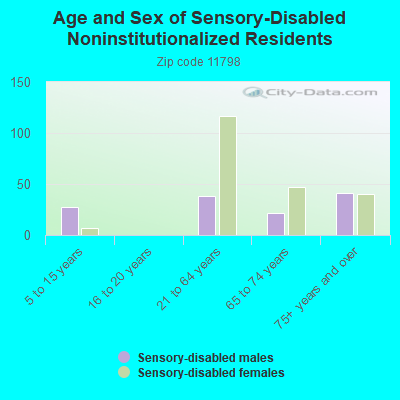
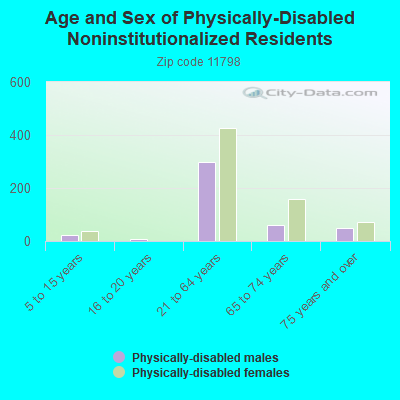
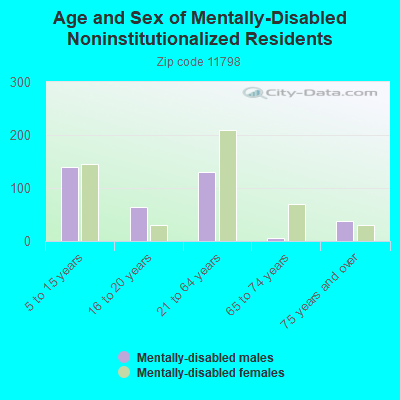
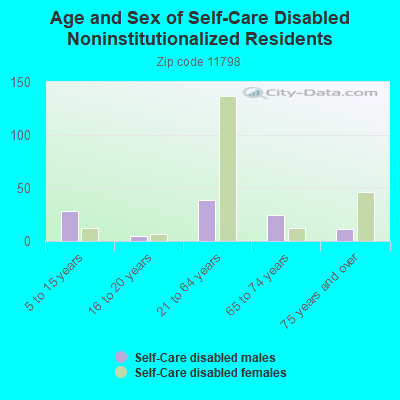

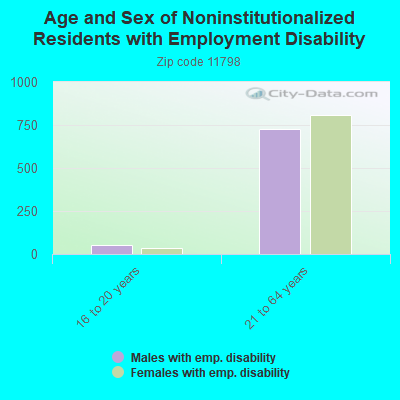
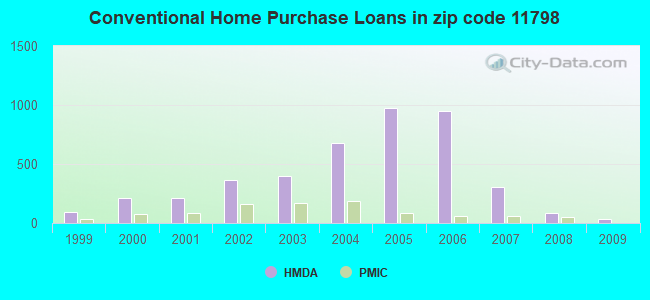

 According to the data from the years 2002 - 2018 the average number of fire incidents per year is 41. The highest number of reported fires - 117 took place in 2005, and the least - 1 in 2012. The data has a declining trend.
 When looking into fire subcategories, the most reports belonged to: Structure Fires (40.4%), and Outside Fires (36.8%).