Races in Columbia, South Carolina (SC) Detailed Stats
Data:
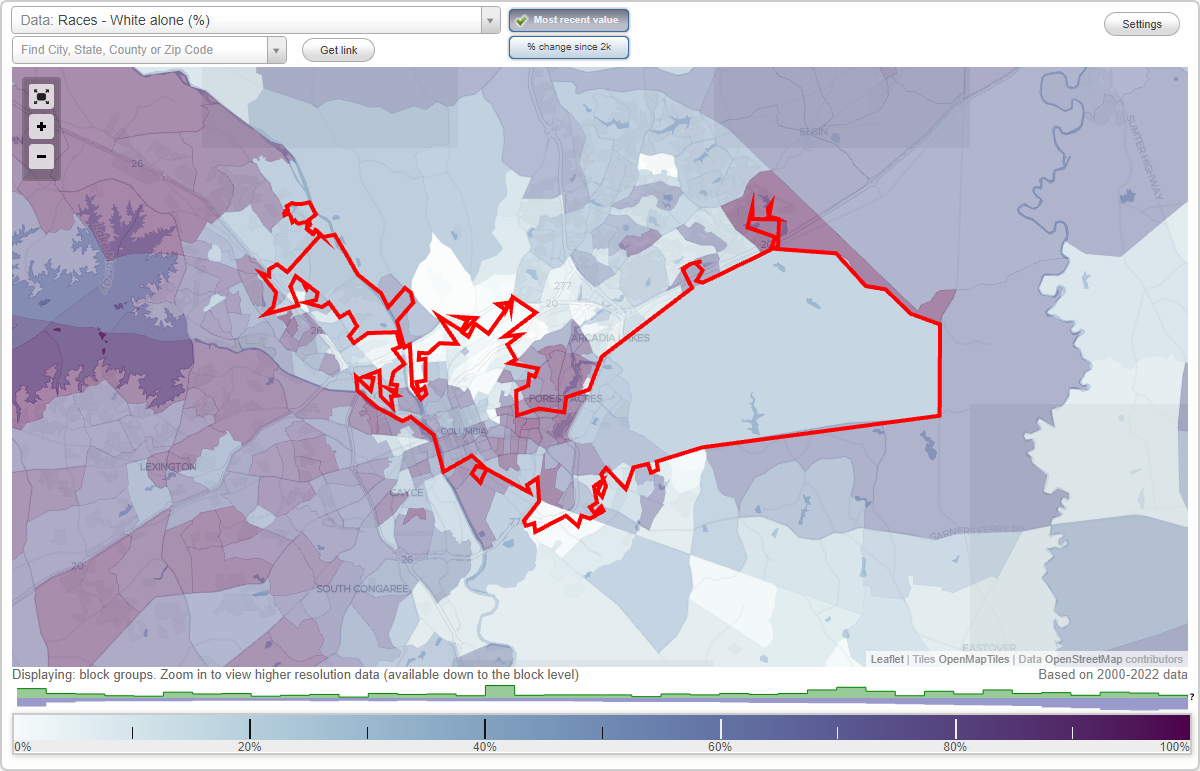
Races - White alone (%)
Races - White alone (% change since 2000)
Races - Black alone (%)
Races - Black alone (% change since 2000)
Races - American Indian alone (%)
Races - American Indian alone (% change since 2000)
Races - Asian alone (%)
Races - Asian alone (% change since 2000)
Races - Hispanic (%)
Races - Hispanic (% change since 2000)
Races - Native Hawaiian and Other Pacific Islander alone (%)
Races - Native Hawaiian and Other Pacific Islander alone (% change since 2000)
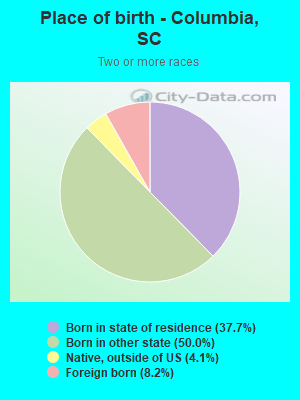
Races - Two or more races(%)
Races - Two or more races(% change since 2000)
Races - Other race alone (%)
Races - Other race alone (% change since 2000)
Racial diversity
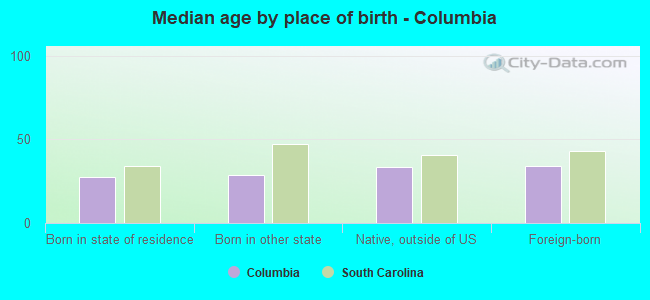
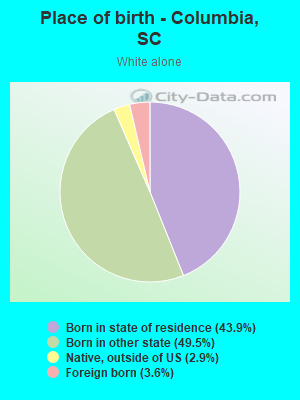
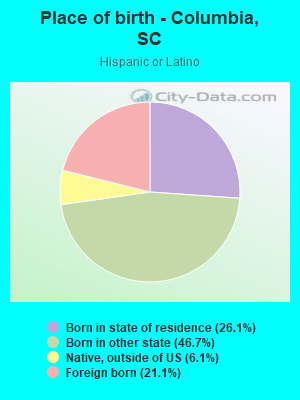
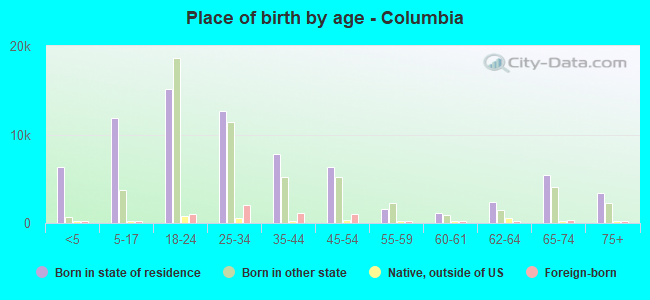
Place of birth - Born in state of residence (%)
Place of birth - Born in state of residence (%) - White
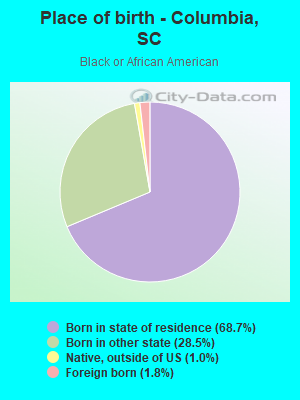
Place of birth - Born in state of residence (%) - Black or African American
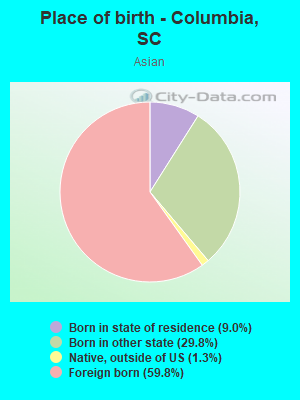
Place of birth - Born in state of residence (%) - Asian
Place of birth - Born in state of residence (%) - Hispanic or Latino
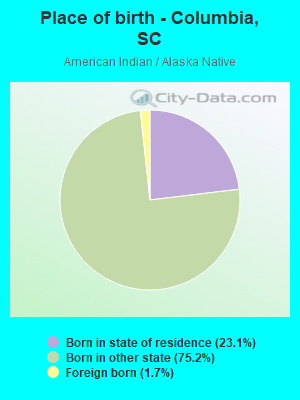
Place of birth - Born in state of residence (%) - American Indian and Alaska Native
Place of birth - Born in state of residence (%) - Multirace
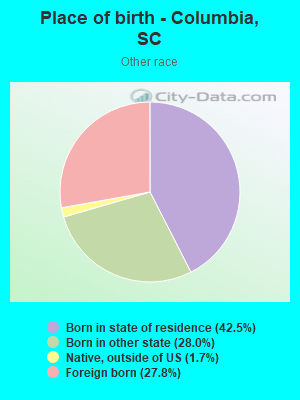
Place of birth - Born in state of residence (%) - Other Race
Place of birth - Born in other state (%)
Place of birth - Born in other state (%) - White
Place of birth - Born in other state (%) - Black or African American
Place of birth - Born in other state (%) - Asian
Place of birth - Born in other state (%) - Hispanic or Latino
Place of birth - Born in other state (%) - American Indian and Alaska Native
Place of birth - Born in other state (%) - Multirace
Place of birth - Born in other state (%) - Other Race
Place of birth - Native, outside of US (%)
Place of birth - Native, outside of US (%) - White
Place of birth - Native, outside of US (%) - Black or African American
Place of birth - Native, outside of US (%) - Asian
Place of birth - Native, outside of US (%) - Hispanic or Latino
Place of birth - Native, outside of US (%) - American Indian and Alaska Native
Place of birth - Native, outside of US (%) - Multirace
Place of birth - Native, outside of US (%) - Other Race
Place of birth - Foreign born (%)
Place of birth - Foreign born (%) - White
Place of birth - Foreign born (%) - Black or African American
Place of birth - Foreign born (%) - Asian
Place of birth - Foreign born (%) - Hispanic or Latino
Place of birth - Foreign born (%) - American Indian and Alaska Native
Place of birth - Foreign born (%) - Multirace
Place of birth - Foreign born (%) - Other Race
Residents speaking English at home (%)
Residents speaking English at home - Born in the United States (%)
Residents speaking English at home - Native, born elsewhere (%)
Residents speaking English at home - Foreign born (%)
Residents speaking Spanish at home (%)
Residents speaking Spanish at home - Born in the United States (%)
Residents speaking Spanish at home - Native, born elsewhere (%)
Residents speaking Spanish at home - Foreign born (%)
Residents speaking other language at home (%)
Residents speaking other language at home - Born in the United States (%)
Residents speaking other language at home - Native, born elsewhere (%)
Residents speaking other language at home - Foreign born (%)
Marital status - Never married (%)
Marital status - Now married (%)
Marital status - Separated (%)
Marital status - Widowed (%)
Marital status - Divorced (%)
Ancestries Reported - Arab (%)
Ancestries Reported - Czech (%)
Ancestries Reported - Danish (%)
Ancestries Reported - Dutch (%)
Ancestries Reported - English (%)
Ancestries Reported - French (%)
Ancestries Reported - French Canadian (%)
Ancestries Reported - German (%)
Ancestries Reported - Greek (%)
Ancestries Reported - Hungarian (%)
Ancestries Reported - Irish (%)
Ancestries Reported - Italian (%)
Ancestries Reported - Lithuanian (%)
Ancestries Reported - Norwegian (%)
Ancestries Reported - Polish (%)
Ancestries Reported - Portuguese (%)
Ancestries Reported - Russian (%)
Ancestries Reported - Scotch-Irish (%)
Ancestries Reported - Scottish (%)
Ancestries Reported - Slovak (%)
Ancestries Reported - Subsaharan African (%)
Ancestries Reported - Swedish (%)
Ancestries Reported - Swiss (%)
Ancestries Reported - Ukrainian (%)
Ancestries Reported - United States (%)
Ancestries Reported - Welsh (%)
Ancestries Reported - West Indian (%)
Ancestries Reported - Other (%)
Geographical mobility - Same house 1 year ago (%)
Geographical mobility - Same house 1 year ago (%) - White
Geographical mobility - Same house 1 year ago (%) - Black or African American
Geographical mobility - Same house 1 year ago (%) - Asian
Geographical mobility - Same house 1 year ago (%) - Hispanic or Latino
Geographical mobility - Same house 1 year ago (%) - American Indian and Alaska Native
Geographical mobility - Same house 1 year ago (%) - Multirace
Geographical mobility - Same house 1 year ago (%) - Other Race
Geographical mobility - Moved within same county (%)
Geographical mobility - Moved within same county (%) - White
Geographical mobility - Moved within same county (%) - Black or African American
Geographical mobility - Moved within same county (%) - Asian
Geographical mobility - Moved within same county (%) - Hispanic or Latino
Geographical mobility - Moved within same county (%) - American Indian and Alaska Native
Geographical mobility - Moved within same county (%) - Multirace
Geographical mobility - Moved within same county (%) - Other Race
Geographical mobility - Moved from different county within same state (%)
Geographical mobility - Moved from different county within same state (%) - White
Geographical mobility - Moved from different county within same state (%) - Black or African American
Geographical mobility - Moved from different county within same state (%) - Asian
Geographical mobility - Moved from different county within same state (%) - Hispanic or Latino
Geographical mobility - Moved from different county within same state (%) - American Indian and Alaska Native
Geographical mobility - Moved from different county within same state (%) - Multirace
Geographical mobility - Moved from different county within same state (%) - Other Race
Geographical mobility - Moved from different state (%)
Geographical mobility - Moved from different state (%) - White
Geographical mobility - Moved from different state (%) - Black or African American
Geographical mobility - Moved from different state (%) - Asian
Geographical mobility - Moved from different state (%) - Hispanic or Latino
Geographical mobility - Moved from different state (%) - American Indian and Alaska Native
Geographical mobility - Moved from different state (%) - Multirace
Geographical mobility - Moved from different state (%) - Other Race
Geographical mobility - Moved from abroad (%)
Geographical mobility - Moved from abroad (%) - White
Geographical mobility - Moved from abroad (%) - Black or African American
Geographical mobility - Moved from abroad (%) - Asian
Geographical mobility - Moved from abroad (%) - Hispanic or Latino
Geographical mobility - Moved from abroad (%) - American Indian and Alaska Native
Geographical mobility - Moved from abroad (%) - Multirace
Geographical mobility - Moved from abroad (%) - Other Race
Place of birth for the foreign-born population - Ireland (%)
Place of birth for the foreign-born population - Denmark (%)
Place of birth for the foreign-born population - Norway (%)
Place of birth for the foreign-born population - Sweden (%)
Place of birth for the foreign-born population - United Kingdom (%)
Place of birth for the foreign-born population - England (%)
Place of birth for the foreign-born population - Scotland (%)
Place of birth for the foreign-born population - Other Northern Europe (%)
Place of birth for the foreign-born population - Austria (%)
Place of birth for the foreign-born population - Belgium (%)
Place of birth for the foreign-born population - France (%)
Place of birth for the foreign-born population - Germany (%)
Place of birth for the foreign-born population - Netherlands (%)
Place of birth for the foreign-born population - Switzerland (%)
Place of birth for the foreign-born population - Other Western Europe (%)
Place of birth for the foreign-born population - Greece (%)
Place of birth for the foreign-born population - Italy (%)
Place of birth for the foreign-born population - Portugal (%)
Place of birth for the foreign-born population - Spain (%)
Place of birth for the foreign-born population - Other Southern Europe (%)
Place of birth for the foreign-born population - Albania (%)
Place of birth for the foreign-born population - Belarus (%)
Place of birth for the foreign-born population - Bosnia and Herzegovina (%)
Place of birth for the foreign-born population - Bulgaria (%)
Place of birth for the foreign-born population - Croatia (%)
Place of birth for the foreign-born population - Czechoslovakia (%)
Place of birth for the foreign-born population - Hungary (%)
Place of birth for the foreign-born population - Latvia (%)
Place of birth for the foreign-born population - Lithuania (%)
Place of birth for the foreign-born population - North Macedonia (Macedonia) (%)
Place of birth for the foreign-born population - Moldova (%)
Place of birth for the foreign-born population - Poland (%)
Place of birth for the foreign-born population - Romania (%)
Place of birth for the foreign-born population - Russia (%)
Place of birth for the foreign-born population - Serbia (%)
Place of birth for the foreign-born population - Ukraine (%)
Place of birth for the foreign-born population - Other Eastern Europe (%)
Place of birth for the foreign-born population - China (%)
Place of birth for the foreign-born population - Hong Kong (%)
Place of birth for the foreign-born population - Taiwan (%)
Place of birth for the foreign-born population - Japan (%)
Place of birth for the foreign-born population - Korea (%)
Place of birth for the foreign-born population - Other Eastern Asia (%)
Place of birth for the foreign-born population - Afghanistan (%)
Place of birth for the foreign-born population - Bangladesh (%)
Place of birth for the foreign-born population - India (%)
Place of birth for the foreign-born population - Iran (%)
Place of birth for the foreign-born population - Kazakhstan (%)
Place of birth for the foreign-born population - Nepal (%)
Place of birth for the foreign-born population - Pakistan (%)
Place of birth for the foreign-born population - Sri Lanka (%)
Place of birth for the foreign-born population - Uzbekistan (%)
Place of birth for the foreign-born population - Other South Central Asia (%)
Place of birth for the foreign-born population - Burma (%)
Place of birth for the foreign-born population - Cambodia (%)
Place of birth for the foreign-born population - Indonesia (%)
Place of birth for the foreign-born population - Laos (%)
Place of birth for the foreign-born population - Malaysia (%)
Place of birth for the foreign-born population - Philippines (%)
Place of birth for the foreign-born population - Singapore (%)
Place of birth for the foreign-born population - Thailand (%)
Place of birth for the foreign-born population - Vietnam (%)
Place of birth for the foreign-born population - Other South Eastern Asia (%)
Place of birth for the foreign-born population - Armenia (%)
Place of birth for the foreign-born population - Iraq (%)
Place of birth for the foreign-born population - Israel (%)
Place of birth for the foreign-born population - Jordan (%)
Place of birth for the foreign-born population - Kuwait (%)
Place of birth for the foreign-born population - Lebanon (%)
Place of birth for the foreign-born population - Saudi Arabia (%)
Place of birth for the foreign-born population - Syria (%)
Place of birth for the foreign-born population - Turkey (%)
Place of birth for the foreign-born population - Yemen (%)
Place of birth for the foreign-born population - Other Western Asia (%)
Place of birth for the foreign-born population - Eritrea (%)
Place of birth for the foreign-born population - Ethiopia (%)
Place of birth for the foreign-born population - Kenya (%)
Place of birth for the foreign-born population - Somalia (%)
Place of birth for the foreign-born population - Uganda (%)
Place of birth for the foreign-born population - Zimbabwe (%)
Place of birth for the foreign-born population - Other Eastern Africa (%)
Place of birth for the foreign-born population - Cameroon (%)
Place of birth for the foreign-born population - Congo (%)
Place of birth for the foreign-born population - Democratic Republic of Congo (Zaire) (%)
Place of birth for the foreign-born population - Other Middle Africa (%)
Place of birth for the foreign-born population - Egypt (%)
Place of birth for the foreign-born population - Morocco (%)
Place of birth for the foreign-born population - Sudan (%)
Place of birth for the foreign-born population - Other Northern Africa (%)
Place of birth for the foreign-born population - South Africa (%)
Place of birth for the foreign-born population - Other Southern Africa (%)
Place of birth for the foreign-born population - Cabo Verde (%)
Place of birth for the foreign-born population - Ghana (%)
Place of birth for the foreign-born population - Liberia (%)
Place of birth for the foreign-born population - Nigeria (%)
Place of birth for the foreign-born population - Senegal (%)
Place of birth for the foreign-born population - Sierra Leone (%)
Place of birth for the foreign-born population - Other Western Africa (%)
Place of birth for the foreign-born population - Australia (%)
Place of birth for the foreign-born population - New Zealand (%)
Place of birth for the foreign-born population - Fiji (%)
Place of birth for the foreign-born population - Micronesia (%)
Place of birth for the foreign-born population - Bahamas (%)
Place of birth for the foreign-born population - Barbados (%)
Place of birth for the foreign-born population - Cuba (%)
Place of birth for the foreign-born population - Dominica (%)
Place of birth for the foreign-born population - Dominican Republic (%)
Place of birth for the foreign-born population - Grenada (%)
Place of birth for the foreign-born population - Haiti (%)
Place of birth for the foreign-born population - Jamaica (%)
Place of birth for the foreign-born population - St. Vincent and the Grenadines (%)
Place of birth for the foreign-born population - Trinidad and Tobago (%)
Place of birth for the foreign-born population - West Indies (%)
Place of birth for the foreign-born population - Other Caribbean (%)
Place of birth for the foreign-born population - Belize (%)
Place of birth for the foreign-born population - Costa Rica (%)
Place of birth for the foreign-born population - El Salvador (%)
Place of birth for the foreign-born population - Guatemala (%)
Place of birth for the foreign-born population - Honduras (%)
Place of birth for the foreign-born population - Mexico (%)
Place of birth for the foreign-born population - Nicaragua (%)
Place of birth for the foreign-born population - Panama (%)
Place of birth for the foreign-born population - Other Central America (%)
Place of birth for the foreign-born population - Argentina (%)
Place of birth for the foreign-born population - Bolivia (%)
Place of birth for the foreign-born population - Brazil (%)
Place of birth for the foreign-born population - Chile (%)
Place of birth for the foreign-born population - Colombia (%)
Place of birth for the foreign-born population - Ecuador (%)
Place of birth for the foreign-born population - Guyana (%)
Place of birth for the foreign-born population - Peru (%)
Place of birth for the foreign-born population - Uruguay (%)
Place of birth for the foreign-born population - Venezuela (%)
Place of birth for the foreign-born population - Other South America (%)
Place of birth for the foreign-born population - Canada (%)
Place of birth for the foreign-born population - Other Northern America (%)
Place of birth for the foreign-born population - Other (%)
Latest news about races in Columbia, SC collected exclusively by city-data.com from local newspapers, TV, and radio stations
According to 2022 data, the most numerous races in Columbia, SC are White alone (66,806 residents), Black alone (56,743 residents), and Hispanic (6,389 residents). 92.9% of Columbia residents speak English at home. 4.6% of Columbia, SC residents are foreign-born (1.8% born in Asia, 1.5% born in Latin America, 0.7% born in Europe), which is 7.8% less than the foreign-born rate of 5.0% across the entire state of South Carolina.
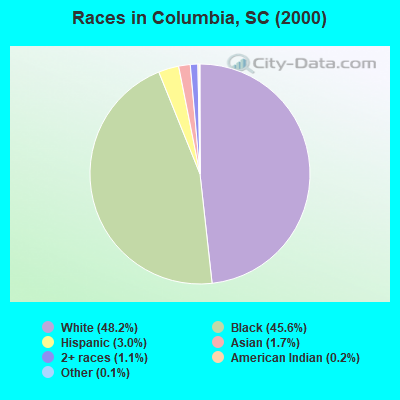
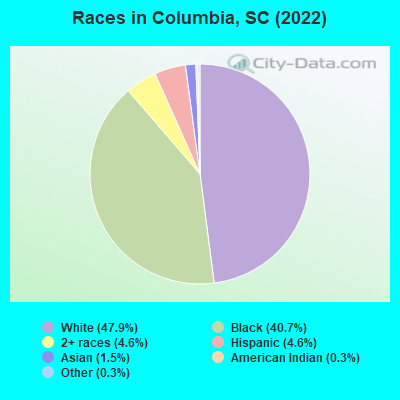
Race distribution in Columbia
2000 2022
55,993 48.2% White alone 53,052 45.6% Black alone 3,520 3.0% Hispanic 1,977 1.7% Asian alone 1,249 1.1% Two or more races 260 0.2% American Indian alone 140 0.1% Other race alone 87 0.07% Native Hawaiian and Other
66,806 47.9% White alone 56,743 40.7% Black alone 6,389 4.6% Hispanic 6,450 4.6% Two or more races 2,087 1.5% Asian alone 422 0.3% Other race alone 446 0.3% American Indian alone
2000 2022
2,652,291 66.1% White alone 1,178,486 29.4% Black alone 95,076 2.4% Hispanic 35,568 0.9% Asian alone 33,290 0.8% Two or more races 12,765 0.3% American Indian alone 3,266 0.08% Other race alone 1,270 0.03% Native Hawaiian and Other
3,301,739 62.5% White alone 1,313,290 24.9% Black alone 343,783 6.5% Hispanic 190,508 3.6% Two or more races 89,888 1.7% Asian alone 29,390 0.6% Other race alone 12,112 0.2% American Indian alone 1,924 0.04% Native Hawaiian and Other
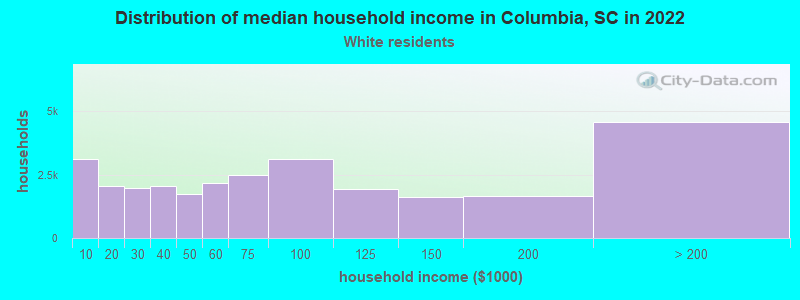
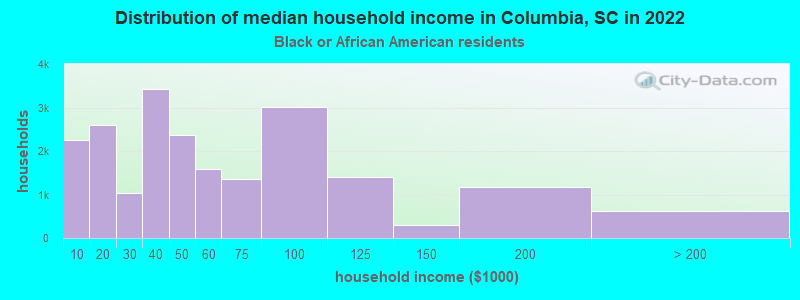
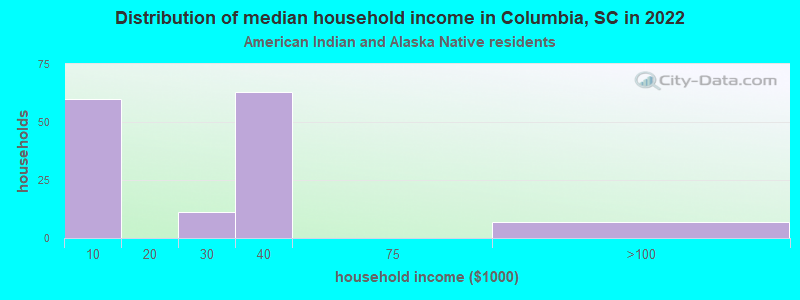
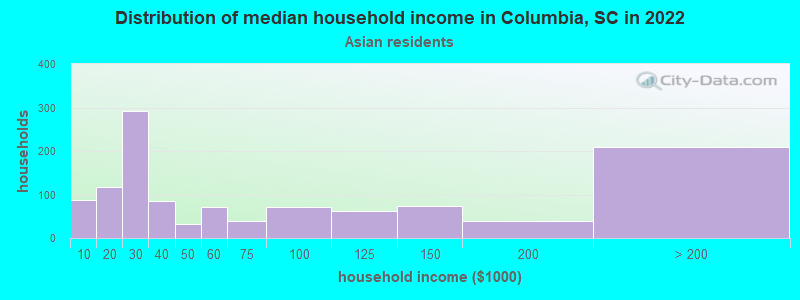
Income and house value in Columbia Median household income in 2022 $67,730 White non-Hispanic householders$47,762 Black householders$38,403 American Indian and Alaska Native householders$44,933 Asian householders$80,982 Some other race householders$70,527 Two or more races householders$69,502 Hispanic or Latino race householdersMedian 2022 house value $375,785 White Non-Hispanic householders$208,736 Black or African American householders$269,051 American Indian or Alaska Native householders $280,878 Asian householders$300,391 Some other race householders$293,000 Two or more races householders$453,544 Hispanic or Latino householders
Median age by race in Columbia
29.2 Median age for White residents29.0 29.6 28.8 Median age for Black or African American residents27.4 30.0 16.7 Median age for American Indian / Alaska Native residents20.6 31.6 27.0 Median age for Asian residents27.1 23.0 -666,666,666.0 Median age for Native Hawaiian / Pacific Islander residents-666,666,666.0 -666,666,666.0 26.0 Median age for Other race residents26.0 25.9 21.7 Median age for Two or more races residents20.2 22.7 29.4 Median age for White alone residents28.8 31.4 25.1 Median age for Hispanic or Latino residents29.5 21.2
Owner/renter occupied households by race in Columbia
House owners and renters - White residents 16,196 56.9% Owner occupied12,250 43.1% Renter occupiedHouse owners and renters - Black or African American residents 8,050 38.2% Owner occupied13,027 61.8% Renter occupiedHouse owners and renters - American Indian / Alaska Native residents 3 2.4% Owner occupied115 97.6% Renter occupiedHouse owners and renters - Asian residents 340 37.3% Owner occupied572 62.7% Renter occupiedHouse owners and renters - Native Hawaiian / Pacific Islander residents 67 100.0% Renter occupiedHouse owners and renters - Other race residents 258 58.4% Owner occupied184 41.6% Renter occupiedHouse owners and renters - Two or more races residents 903 27.1% Owner occupied2,428 72.9% Renter occupiedHouse owners and renters - White alone residents 15,755 56.5% Owner occupied12,123 43.5% Renter occupiedHouse owners and renters - Hispanic or Latino residents 893 40.5% Owner occupied1,310 59.5% Renter occupied
Language usage in Columbia
English speakers - Total 92.9% of residents of Columbia speak English at home.
3.0% of residents speak Spanish at home 2,804 70.9% Speak English very well1,153 29.1% Speak English less than very well4.1% of residents speak other language at home 4,314 78.8% Speak English very well1,163 21.2% Speak English less than very well
English speakers - Born in the United States 94.5% of residents of Columbia speak English at home.
2.6% of residents speak Spanish at home 1,250 86.2% Speak English very well200 13.8% Speak English less than very well2.9% of residents speak other language at home 1,365 85.8% Speak English very well226 14.2% Speak English less than very well
English speakers - Native, born elsewhere 76.2% of residents of Columbia speak English at home.
13.6% of residents speak Spanish at home 162 40.7% Speak English very well236 59.3% Speak English less than very well10.2% of residents speak other language at home 188 62.7% Speak English very well112 37.3% Speak English less than very well
English speakers - Foreign-born 34.3% of residents of Columbia speak English at home.
17.7% of residents speak Spanish at home 894 80.6% Speak English very well215 19.4% Speak English less than very well48.0% of residents speak other language at home 2,207 73.3% Speak English very well804 26.7% Speak English less than very well
White (Caucasian) - Speak only English Native:
96.7% (61,424)Foreign-born:
41.9% (1,015)
White (Caucasian) - Speak another language Native:
3.3% (2,087)Foreign-born:
58.1% (1,405)
Black or African American - Speak only English Native:
97.2% (51,320)Foreign-born:
55.7% (573)
Black or African American - Speak another language Native:
2.8% (1,486)Foreign-born:
44.3% (455)
American Indian / Alaska Native - Speak another language Native:
36.3% (123)Foreign-born:
100.0% (5)
Asian - Speak only English Native:
45.9% (498)Foreign-born:
9.4% (173)
Asian - Speak another language Native:
54.7% (593)Foreign-born:
88.7% (1,635)
Native Hawaiian / Pacific Islander - Speak only English Native:
86.8% (368)Foreign-born:
80.0% (44)
Native Hawaiian / Pacific Islander - Speak another language Native:
13.0% (55)Foreign-born:
17.1% (9)
Other race - Speak only English Native:
62.0% (801)Foreign-born:
8.9% (54)
Other race - Speak another language Native:
39.1% (505)Foreign-born:
85.6% (519)
Two or more races - Speak only English Native:
86.9% (6,245)Foreign-born:
16.2% (122)
Two or more races - Speak another language Native:
13.1% (944)Foreign-born:
83.8% (633)
White alone - Speak only English Native:
97.1% (60,233)Foreign-born:
43.9% (1,015)
White alone - Speak another language Native:
2.9% (1,806)Foreign-born:
56.1% (1,296)
Hispanic or Latino - Speak only English Native:
71.9% (3,190)Foreign-born:
17.8% (240)
Hispanic or Latino - Speak another language Native:
28.1% (1,244)Foreign-born:
82.2% (1,109)
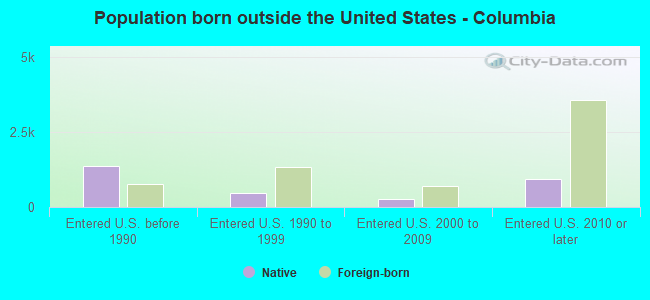
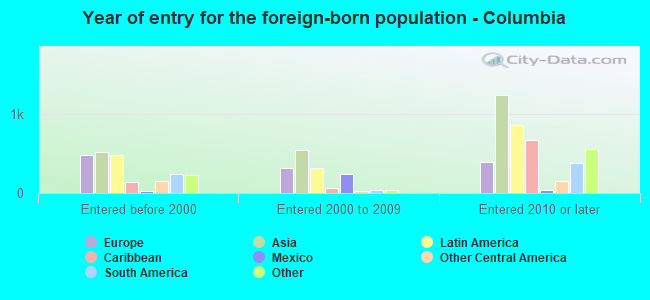
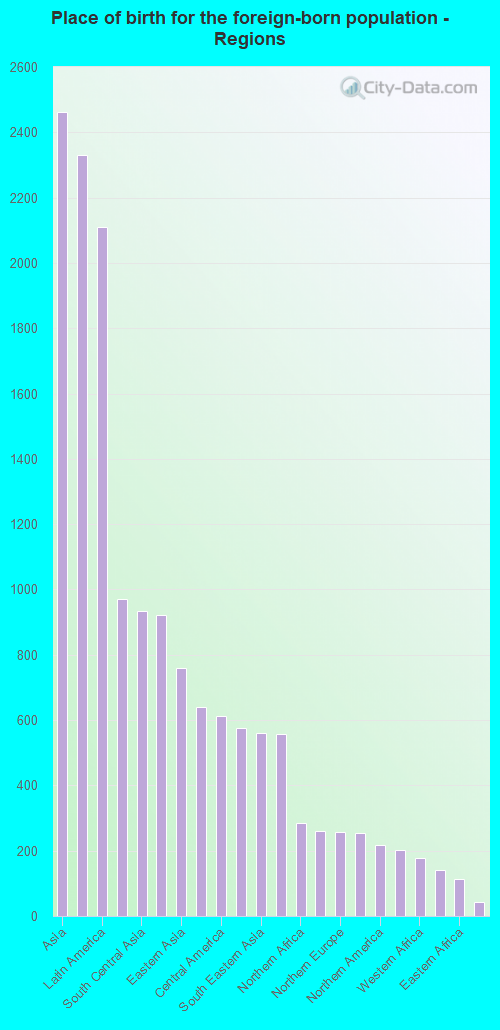
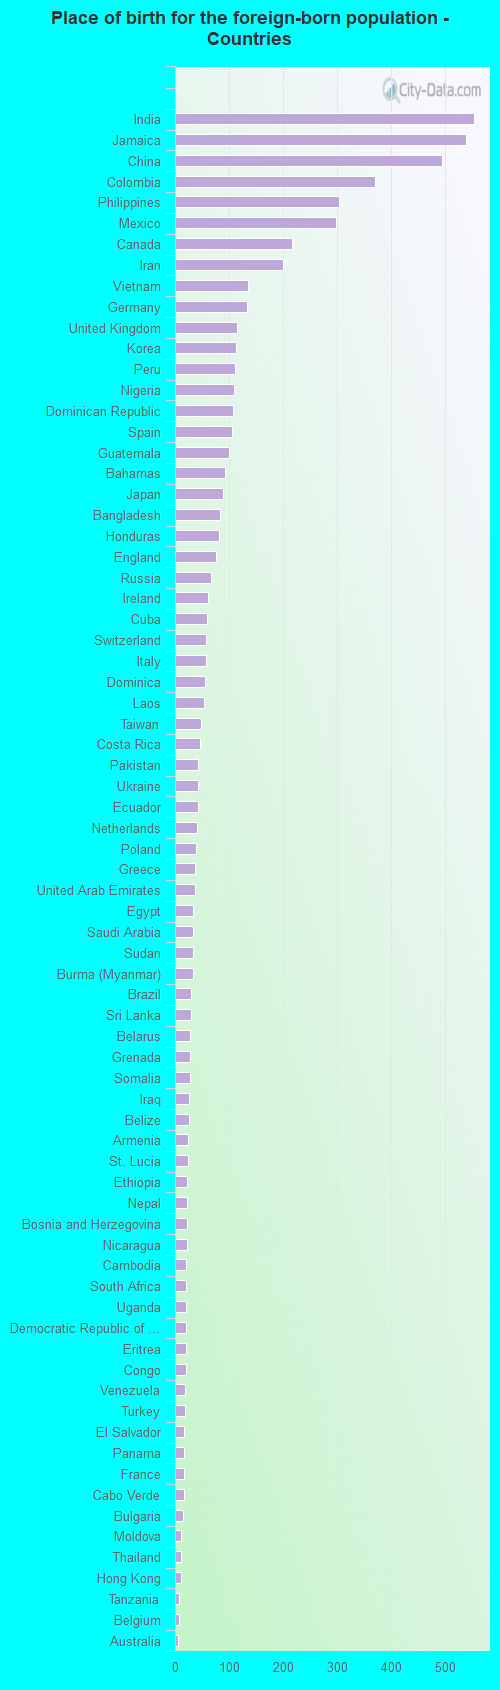
Foreign-born residents in Columbia 6,424 residents are foreign born (1.8% Asia , 1.5% Latin America , 0.7% Europe ).
This city:
4.6%South Carolina:
5.3%
Marital status for residents in Columbia Marital status - White (Caucasian) population 15 years and over
Males 58.2% Never married34.2% Now married0.6% Separated1.3% Widowed5.7% DivorcedFemales 49.8% Never married33.6% Now married1.4% Separated5.8% Widowed9.4% DivorcedWomen who gave birth in the past 12 months Now married:
100.0% (655)Unmarried:
0.0% (0)
Women who did not give birth in the past 12 months Now married:
23.6% (4,367)Unmarried:
76.4% (14,171)
Marital status - Black or African American population 15 years and over
Males 66.1% Never married22.4% Now married1.7% Separated2.0% Widowed7.7% DivorcedFemales 59.6% Never married18.0% Now married0.7% Separated9.1% Widowed12.6% DivorcedWomen who gave birth in the past 12 months Now married:
46.3% (617)Unmarried:
53.7% (715)
Women who did not give birth in the past 12 months Now married:
15.1% (2,396)Unmarried:
84.9% (13,424)
Marital status - American Indian / Alaska Native population 15 years and over
Males 65.2% Never married30.4% Now married0.0% Separated0.0% Widowed4.3% DivorcedFemales 28.6% Never married3.2% Now married4.9% Separated10.8% Widowed52.4% DivorcedWomen who did not give birth in the past 12 months Now married:
0.7% (1)Unmarried:
99.3% (195)
Marital status - Asian population 15 years and over
Males 70.1% Never married26.5% Now married1.9% Separated0.6% Widowed0.8% DivorcedFemales 52.4% Never married38.5% Now married0.0% Separated4.6% Widowed4.4% DivorcedWomen who gave birth in the past 12 months Now married:
100.0% (18)Unmarried:
0.0% (0)
Women who did not give birth in the past 12 months Now married:
34.8% (424)Unmarried:
65.2% (794)
Marital status - Native Hawaiian / Pacific Islander population 15 years and over
Males 36.7% Never married63.3% Now married0.0% Separated0.0% Widowed0.0% DivorcedFemales 70.0% Never married23.7% Now married0.0% Separated0.0% Widowed6.3% DivorcedWomen who did not give birth in the past 12 months Now married:
23.7% (63)Unmarried:
76.3% (203)
Marital status - Other race population 15 years and over
Males 67.4% Never married27.4% Now married0.0% Separated0.0% Widowed5.2% DivorcedFemales 49.6% Never married19.9% Now married16.3% Separated1.4% Widowed12.8% DivorcedWomen who gave birth in the past 12 months Now married:
17.8% (10)Unmarried:
82.2% (45)
Women who did not give birth in the past 12 months Now married:
34.9% (242)Unmarried:
65.1% (452)
Marital status - Two or more races population 15 years and over
Males 66.7% Never married24.2% Now married2.5% Separated0.7% Widowed5.9% DivorcedFemales 59.0% Never married22.4% Now married1.3% Separated3.2% Widowed14.1% DivorcedWomen who gave birth in the past 12 months Now married:
100.0% (184)Unmarried:
0.0% (0)
Women who did not give birth in the past 12 months Now married:
15.9% (337)Unmarried:
84.1% (1,775)
Marital status - White alone, not Hispanic / Latino population 15 years and over
Males 58.7% Never married34.1% Now married0.6% Separated1.3% Widowed5.3% DivorcedFemales 49.3% Never married33.7% Now married1.4% Separated5.9% Widowed9.7% DivorcedWomen who gave birth in the past 12 months Now married:
100.0% (655)Unmarried:
0.0% (0)
Women who did not give birth in the past 12 months Now married:
23.2% (4,107)Unmarried:
76.8% (13,594)
Marital status - Hispanic or Latino population 15 years and over
Males 48.3% Never married32.4% Now married4.8% Separated0.0% Widowed14.5% DivorcedFemales 59.9% Never married28.8% Now married0.0% Separated0.0% Widowed11.2% DivorcedWomen who gave birth in the past 12 months Now married:
64.0% (231)Unmarried:
36.0% (130)
Women who did not give birth in the past 12 months Now married:
19.5% (400)Unmarried:
80.5% (1,654)
Ancestries in Columbia
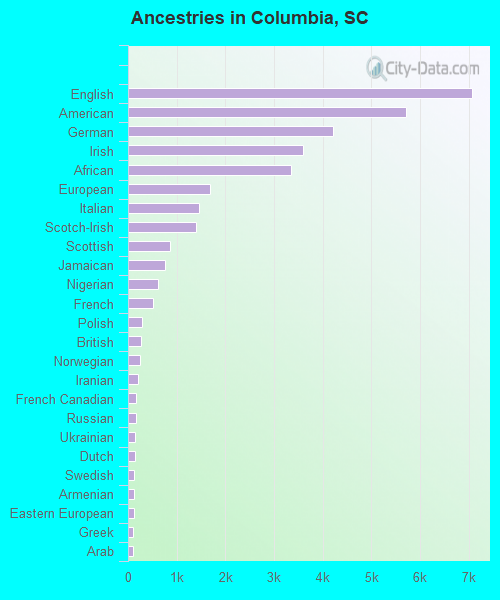
7,067 9.0% English5,713 7.3% American4,209 5.4% German3,595 4.6% Irish3,353 4.3% African1,681 2.1% European1,462 1.9% Italian1,393 1.8% Scotch-Irish871 1.1% Scottish755 1.0% Jamaican613 0.8% Nigerian518 0.7% French294 0.4% Polish270 0.3% British250 0.3% Norwegian210 0.3% Iranian171 0.2% French Canadian170 0.2% Russian153 0.2% Ukrainian147 0.2% Dutch128 0.2% Swedish123 0.2% Armenian115 0.1% Eastern European106 0.1% Greek93 0.1% Arab90 0.1% Lebanese89 0.1% Celtic88 0.1% Croatian88 0.1% Welsh82 0.1% Northern European76 0.10% Scandinavian74 0.09% Sudanese74 0.09% Bahamian72 0.09% Hungarian72 0.09% Ugandan69 0.09% Canadian64 0.08% Trinidadian and Tobagonian56 0.07% Romanian54 0.07% Swiss52 0.07% South African47 0.06% Cajun46 0.06% Ethiopian46 0.06% Czech46 0.06% Czechoslovakian44 0.06% Latvian43 0.05% Slovak40 0.05% Finnish39 0.05% Yugoslavian38 0.05% Palestinian34 0.04% Portuguese33 0.04% Haitian31 0.04% Turkish28 0.04% Danish25 0.03% Egyptian24 0.03% Cape Verdean24 0.03% Slovene20 0.03% Bulgarian18 0.02% Ghanaian18 0.02% British West Indian16 0.02% Moroccan15 0.02% Israeli13 0.02% Maltese11 0.01% Serbian9 0.01% Iraqi8 0.01% Belgian5 0.01% Albanian4 0.01% Belizean
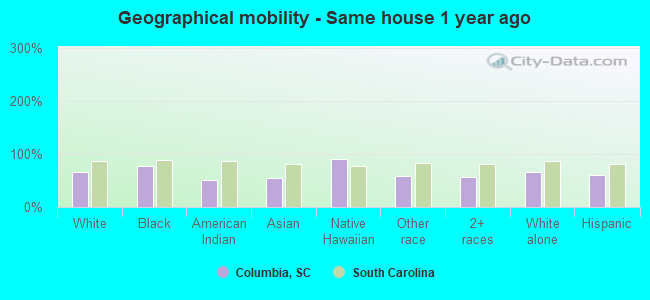
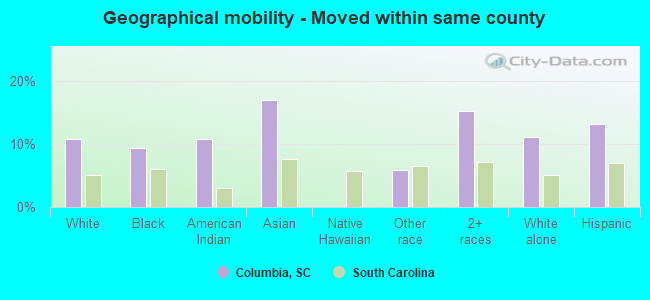
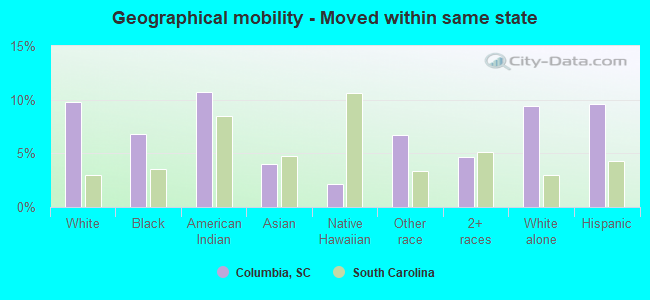
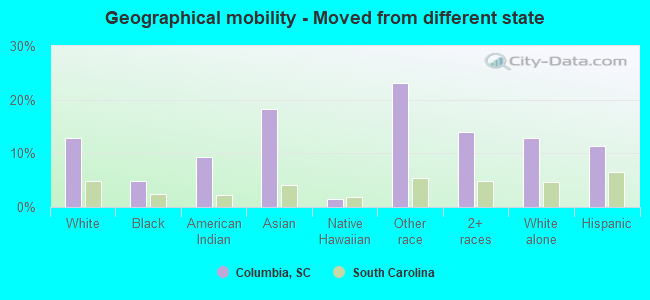
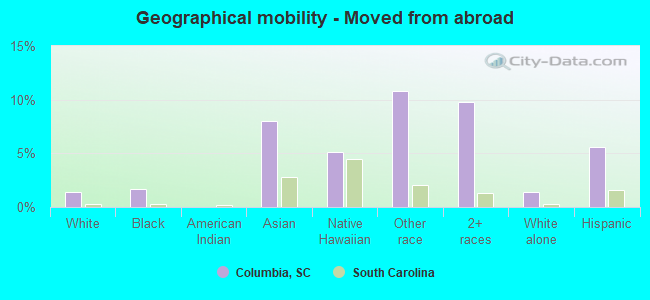
Geographical mobility in Columbia Same house 1 year ago 44,113 65.2% White (Caucasian)43,893 77.4% Black or African American184 50.5% American Indian / Alaska Native1,633 55.4% Asian426 90.1% Native Hawaiian / Pacific Islander1,231 57.9% Other race4,877 56.3% Two or more races43,175 65.3% White alone, not Hispanic / Latino3,722 60.3% Hispanic or LatinoMoved within same county 7,330 10.8% White / Caucasian5,269 9.3% Black or African American39 10.7% American Indian / Alaska Native502 17.0% Asian126 5.9% Other race1,319 15.2% Two or more races7,301 11.0% White alone, not Hispanic / Latino809 13.1% Hispanic or LatinoMoved within same state 6,607 9.8% White / Caucasian3,871 6.8% Black or African American39 10.7% American Indian / Alaska Native118 4.0% Asian10 2.1% Native Hawaiian / Pacific Islander143 6.7% Other race407 4.7% Two or more races6,199 9.4% White alone, not Hispanic / Latino591 9.6% Hispanic or LatinoMoved from different state 8,735 12.9% White / Caucasian2,736 4.8% Black or African American34 9.3% American Indian / Alaska Native537 18.2% Asian7 1.6% Native Hawaiian / Pacific Islander491 23.1% Other race1,217 14.0% Two or more races8,504 12.9% White alone, not Hispanic / Latino705 11.4% Hispanic or LatinoMoved from abroad 924 1.4% White952 1.7% Black or African American235 8.0% Asian24 5.1% Native Hawaiian / Pacific Islander230 10.8% Other race849 9.8% Two or more races924 1.4% White alone, not Hispanic / Latino343 5.6% Hispanic or Latino
Children Nativity (place of birth) in Columbia
Children under 6 years - Living with two parents Both parents native 3,855 100.0% NativeBoth parents foreign-born 133 89.3% Native16 10.7% Foreign-bornOne native, one foreign-born parent 381 100.0% NativeChildren under 6 years - Living with one parent Native parent 3,582 100.0% NativeForeign-born parent 54 80.6% Native13 19.4% Foreign-bornChildren 6 to 17 years - Living with two parents Both parents native 5,943 100.0% NativeBoth parents foreign-born 195 45.4% Native234 54.6% Foreign-bornOne native, one foreign-born parent 312 100.0% NativeChildren 6 to 17 years - Living with one parent Native parent 6,638 100.0% NativeForeign-born parent 337 46.5% Native388 53.5% Foreign-born
Place of birth for residents in Columbia
Grandparents responsible for own grandchildren in Columbia
Grandparents (30 to 59 years) White / Caucasian 15 100.0% Not responsible for grandchildrenBlack or African American 391 68.6% Responsible for grandchildren179 31.4% Not responsible for grandchildrenOther race 8 100.0% Not responsible for grandchildrenTwo or more races 5 100.0% Not responsible for grandchildrenWhite alone, not Hispanic / Latino 15 100.0% Not responsible for grandchildrenHispanic or Latino 9 100.0% Not responsible for grandchildrenGrandparents (60 years and over) White / Caucasian 138 52.3% Responsible for grandchildren126 47.7% Not responsible for grandchildrenBlack or African American 56 15.3% Responsible for grandchildren307 84.7% Not responsible for grandchildrenTwo or more races 12 100.0% Not responsible for grandchildrenWhite alone, not Hispanic / Latino 140 51.9% Responsible for grandchildren129 48.1% Not responsible for grandchildren
Zip codes: 29044 , 29045 , 29061 , 29063 , 29147, 29202 , 29203 , 29204 , 29205 , 29207 , 29208 , 29210 , 29212 , 29225 , 29229 .