Estimated zip code population in 2022: 12,910
Zip code population in 2010: 13,717
Zip code population in 2000: 13,025
Houses and condos: 5,715
Renter-occupied apartments: 1,350
% of renters here:
26%State:
28%
March 2022 cost of living index in zip code 29061: 81.9
(low, U.S. average is 100)
Land area: 89.0
sq. mi.
Water area: 1.5
sq. mi.
Population density: 145 people per square mile (very low).
OSM Map
General Map
Google Map
MSN Map
OSM Map
General Map
Google Map
MSN Map
OSM Map
General Map
Google Map
MSN Map
OSM Map
General Map
Google Map
MSN Map
Please wait while loading the map...
Real estate property taxes paid for housing units in 2022:
This zip code:
0.6% ($1,076)South Carolina:
0.5% ($1,185)
Median real estate property taxes paid for housing units with mortgages in 2022: $1,206 (0.6%)
Median real estate property taxes paid for housing units with no mortgage in 2022: $834 (0.7%)
Business Search - 14 Million verified businesses
Males: 5,935 Females: 6,977
For population 25 years and over in 29061:
High school or higher: 88.3%Bachelor's degree or higher: 24.2%Graduate or professional degree: 5.2%Unemployed: 4.6%Mean travel time to work (commute): 27.9 minutes
For population 15 years and over in 29061:
Never married: 32.0%Now married: 44.4%Separated: 2.3%Widowed: 8.5%Divorced: 12.7%
Zip code 29061 compared to state average:
Black race population percentage above state average. Median age above state average. Foreign-born population percentage below state average. Length of stay since moving in significantly above state average. Number of college students below state average. 7,870 61.0% Black 3,306 25.6% White 914 7.1% Two or more races 599 4.6% Hispanic or Latino 111 0.9% Asian 103 0.8% Some other race 4 0.03% American Indian
Data:
Median household income ($)
Median household income (% change since 2000)
Household income diversity
Ratio of average income to average house value (%)
Ratio of average income to average rent
Median household income ($) - White
Median household income ($) - Black or African American
Median household income ($) - Asian
Median household income ($) - Hispanic or Latino
Median household income ($) - American Indian and Alaska Native
Median household income ($) - Multirace
Median household income ($) - Other Race
Median household income for houses/condos with a mortgage ($)
Median household income for apartments without a mortgage ($)
Races - White alone (%)
Races - White alone (% change since 2000)
Races - Black alone (%)
Races - Black alone (% change since 2000)
Races - American Indian alone (%)
Races - American Indian alone (% change since 2000)
Races - Asian alone (%)
Races - Asian alone (% change since 2000)
Races - Hispanic (%)
Races - Hispanic (% change since 2000)
Races - Native Hawaiian and Other Pacific Islander alone (%)
Races - Native Hawaiian and Other Pacific Islander alone (% change since 2000)
Races - Two or more races (%)
Races - Two or more races (% change since 2000)
Races - Other race alone (%)
Races - Other race alone (% change since 2000)
Racial diversity
Unemployment (%)
Unemployment (% change since 2000)
Unemployment (%) - White
Unemployment (%) - Black or African American
Unemployment (%) - Asian
Unemployment (%) - Hispanic or Latino
Unemployment (%) - American Indian and Alaska Native
Unemployment (%) - Multirace
Unemployment (%) - Other Race
Population density (people per square mile)
Population - Males (%)
Population - Females (%)
Population - Males (%) - White
Population - Males (%) - Black or African American
Population - Males (%) - Asian
Population - Males (%) - Hispanic or Latino
Population - Males (%) - American Indian and Alaska Native
Population - Males (%) - Multirace
Population - Males (%) - Other Race
Population - Females (%) - White
Population - Females (%) - Black or African American
Population - Females (%) - Asian
Population - Females (%) - Hispanic or Latino
Population - Females (%) - American Indian and Alaska Native
Population - Females (%) - Multirace
Population - Females (%) - Other Race
Coronavirus confirmed cases (May 04, 2024)
Deaths caused by coronavirus (May 04, 2024)
Coronavirus confirmed cases (per 100k population) (May 04, 2024)
Deaths caused by coronavirus (per 100k population) (May 04, 2024)
Daily increase in number of cases (May 04, 2024)
Weekly increase in number of cases (May 04, 2024)
Cases doubled (in days) (May 04, 2024)
Hospitalized patients (Apr 18, 2022)
Negative test results (Apr 18, 2022)
Total test results (Apr 18, 2022)
COVID Vaccine doses distributed (per 100k population) (Sep 19, 2023)
COVID Vaccine doses administered (per 100k population) (Sep 19, 2023)
COVID Vaccine doses distributed (Sep 19, 2023)
COVID Vaccine doses administered (Sep 19, 2023)
Likely homosexual households (%)
Likely homosexual households (% change since 2000)
Likely homosexual households - Lesbian couples (%)
Likely homosexual households - Lesbian couples (% change since 2000)
Likely homosexual households - Gay men (%)
Likely homosexual households - Gay men (% change since 2000)
Cost of living index
Median gross rent ($)
Median contract rent ($)
Median monthly housing costs ($)
Median house or condo value ($)
Median house or condo value ($ change since 2000)
Mean house or condo value by units in structure - 1, detached ($)
Mean house or condo value by units in structure - 1, attached ($)
Mean house or condo value by units in structure - 2 ($)
Mean house or condo value by units in structure by units in structure - 3 or 4 ($)
Mean house or condo value by units in structure - 5 or more ($)
Mean house or condo value by units in structure - Boat, RV, van, etc. ($)
Mean house or condo value by units in structure - Mobile home ($)
Median house or condo value ($) - White
Median house or condo value ($) - Black or African American
Median house or condo value ($) - Asian
Median house or condo value ($) - Hispanic or Latino
Median house or condo value ($) - American Indian and Alaska Native
Median house or condo value ($) - Multirace
Median house or condo value ($) - Other Race
Median resident age
Resident age diversity
Median resident age - Males
Median resident age - Females
Median resident age - White
Median resident age - Black or African American
Median resident age - Asian
Median resident age - Hispanic or Latino
Median resident age - American Indian and Alaska Native
Median resident age - Multirace
Median resident age - Other Race
Median resident age - Males - White
Median resident age - Males - Black or African American
Median resident age - Males - Asian
Median resident age - Males - Hispanic or Latino
Median resident age - Males - American Indian and Alaska Native
Median resident age - Males - Multirace
Median resident age - Males - Other Race
Median resident age - Females - White
Median resident age - Females - Black or African American
Median resident age - Females - Asian
Median resident age - Females - Hispanic or Latino
Median resident age - Females - American Indian and Alaska Native
Median resident age - Females - Multirace
Median resident age - Females - Other Race
Commute - mean travel time to work (minutes)
Travel time to work - Less than 5 minutes (%)
Travel time to work - Less than 5 minutes (% change since 2000)
Travel time to work - 5 to 9 minutes (%)
Travel time to work - 5 to 9 minutes (% change since 2000)
Travel time to work - 10 to 19 minutes (%)
Travel time to work - 10 to 19 minutes (% change since 2000)
Travel time to work - 20 to 29 minutes (%)
Travel time to work - 20 to 29 minutes (% change since 2000)
Travel time to work - 30 to 39 minutes (%)
Travel time to work - 30 to 39 minutes (% change since 2000)
Travel time to work - 40 to 59 minutes (%)
Travel time to work - 40 to 59 minutes (% change since 2000)
Travel time to work - 60 to 89 minutes (%)
Travel time to work - 60 to 89 minutes (% change since 2000)
Travel time to work - 90 or more minutes (%)
Travel time to work - 90 or more minutes (% change since 2000)
Marital status - Never married (%)
Marital status - Now married (%)
Marital status - Separated (%)
Marital status - Widowed (%)
Marital status - Divorced (%)
Median family income ($)
Median family income (% change since 2000)
Median non-family income ($)
Median non-family income (% change since 2000)
Median per capita income ($)
Median per capita income (% change since 2000)
Median family income ($) - White
Median family income ($) - Black or African American
Median family income ($) - Asian
Median family income ($) - Hispanic or Latino
Median family income ($) - American Indian and Alaska Native
Median family income ($) - Multirace
Median family income ($) - Other Race
Median year house/condo built
Median year apartment built
Year house built - Built 2005 or later (%)
Year house built - Built 2000 to 2004 (%)
Year house built - Built 1990 to 1999 (%)
Year house built - Built 1980 to 1989 (%)
Year house built - Built 1970 to 1979 (%)
Year house built - Built 1960 to 1969 (%)
Year house built - Built 1950 to 1959 (%)
Year house built - Built 1940 to 1949 (%)
Year house built - Built 1939 or earlier (%)
Average household size
Household density (households per square mile)
Average household size - White
Average household size - Black or African American
Average household size - Asian
Average household size - Hispanic or Latino
Average household size - American Indian and Alaska Native
Average household size - Multirace
Average household size - Other Race
Occupied housing units (%)
Vacant housing units (%)
Owner occupied housing units (%)
Renter occupied housing units (%)
Vacancy status - For rent (%)
Vacancy status - For sale only (%)
Vacancy status - Rented or sold, not occupied (%)
Vacancy status - For seasonal, recreational, or occasional use (%)
Vacancy status - For migrant workers (%)
Vacancy status - Other vacant (%)
Residents with income below the poverty level (%)
Residents with income below 50% of the poverty level (%)
Children below poverty level (%)
Poor families by family type - Married-couple family (%)
Poor families by family type - Male, no wife present (%)
Poor families by family type - Female, no husband present (%)
Poverty status for native-born residents (%)
Poverty status for foreign-born residents (%)
Poverty among high school graduates not in families (%)
Poverty among people who did not graduate high school not in families (%)
Residents with income below the poverty level (%) - White
Residents with income below the poverty level (%) - Black or African American
Residents with income below the poverty level (%) - Asian
Residents with income below the poverty level (%) - Hispanic or Latino
Residents with income below the poverty level (%) - American Indian and Alaska Native
Residents with income below the poverty level (%) - Multirace
Residents with income below the poverty level (%) - Other Race
Air pollution - Air Quality Index (AQI)
Air pollution - CO
Air pollution - NO2
Air pollution - SO2
Air pollution - Ozone
Air pollution - PM10
Air pollution - PM25
Air pollution - Pb
Crime - Murders per 100,000 population
Crime - Rapes per 100,000 population
Crime - Robberies per 100,000 population
Crime - Assaults per 100,000 population
Crime - Burglaries per 100,000 population
Crime - Thefts per 100,000 population
Crime - Auto thefts per 100,000 population
Crime - Arson per 100,000 population
Crime - City-data.com crime index
Crime - Violent crime index
Crime - Property crime index
Crime - Murders per 100,000 population (5 year average)
Crime - Rapes per 100,000 population (5 year average)
Crime - Robberies per 100,000 population (5 year average)
Crime - Assaults per 100,000 population (5 year average)
Crime - Burglaries per 100,000 population (5 year average)
Crime - Thefts per 100,000 population (5 year average)
Crime - Auto thefts per 100,000 population (5 year average)
Crime - Arson per 100,000 population (5 year average)
Crime - City-data.com crime index (5 year average)
Crime - Violent crime index (5 year average)
Crime - Property crime index (5 year average)
1996 Presidential Elections Results (%) - Democratic Party (Clinton)
1996 Presidential Elections Results (%) - Republican Party (Dole)
1996 Presidential Elections Results (%) - Other
2000 Presidential Elections Results (%) - Democratic Party (Gore)
2000 Presidential Elections Results (%) - Republican Party (Bush)
2000 Presidential Elections Results (%) - Other
2004 Presidential Elections Results (%) - Democratic Party (Kerry)
2004 Presidential Elections Results (%) - Republican Party (Bush)
2004 Presidential Elections Results (%) - Other
2008 Presidential Elections Results (%) - Democratic Party (Obama)
2008 Presidential Elections Results (%) - Republican Party (McCain)
2008 Presidential Elections Results (%) - Other
2012 Presidential Elections Results (%) - Democratic Party (Obama)
2012 Presidential Elections Results (%) - Republican Party (Romney)
2012 Presidential Elections Results (%) - Other
2016 Presidential Elections Results (%) - Democratic Party (Clinton)
2016 Presidential Elections Results (%) - Republican Party (Trump)
2016 Presidential Elections Results (%) - Other
2020 Presidential Elections Results (%) - Democratic Party (Biden)
2020 Presidential Elections Results (%) - Republican Party (Trump)
2020 Presidential Elections Results (%) - Other
Ancestries Reported - Arab (%)
Ancestries Reported - Czech (%)
Ancestries Reported - Danish (%)
Ancestries Reported - Dutch (%)
Ancestries Reported - English (%)
Ancestries Reported - French (%)
Ancestries Reported - French Canadian (%)
Ancestries Reported - German (%)
Ancestries Reported - Greek (%)
Ancestries Reported - Hungarian (%)
Ancestries Reported - Irish (%)
Ancestries Reported - Italian (%)
Ancestries Reported - Lithuanian (%)
Ancestries Reported - Norwegian (%)
Ancestries Reported - Polish (%)
Ancestries Reported - Portuguese (%)
Ancestries Reported - Russian (%)
Ancestries Reported - Scotch-Irish (%)
Ancestries Reported - Scottish (%)
Ancestries Reported - Slovak (%)
Ancestries Reported - Subsaharan African (%)
Ancestries Reported - Swedish (%)
Ancestries Reported - Swiss (%)
Ancestries Reported - Ukrainian (%)
Ancestries Reported - United States (%)
Ancestries Reported - Welsh (%)
Ancestries Reported - West Indian (%)
Ancestries Reported - Other (%)
Educational Attainment - No schooling completed (%)
Educational Attainment - Less than high school (%)
Educational Attainment - High school or equivalent (%)
Educational Attainment - Less than 1 year of college (%)
Educational Attainment - 1 or more years of college (%)
Educational Attainment - Associate degree (%)
Educational Attainment - Bachelor's degree (%)
Educational Attainment - Master's degree (%)
Educational Attainment - Professional school degree (%)
Educational Attainment - Doctorate degree (%)
School Enrollment - Nursery, preschool (%)
School Enrollment - Kindergarten (%)
School Enrollment - Grade 1 to 4 (%)
School Enrollment - Grade 5 to 8 (%)
School Enrollment - Grade 9 to 12 (%)
School Enrollment - College undergrad (%)
School Enrollment - Graduate or professional (%)
School Enrollment - Not enrolled in school (%)
School enrollment - Public schools (%)
School enrollment - Private schools (%)
School enrollment - Not enrolled (%)
Median number of rooms in houses and condos
Median number of rooms in apartments
Housing units lacking complete plumbing facilities (%)
Housing units lacking complete kitchen facilities (%)
Density of houses
Urban houses (%)
Rural houses (%)
Households with people 60 years and over (%)
Households with people 65 years and over (%)
Households with people 75 years and over (%)
Households with one or more nonrelatives (%)
Households with no nonrelatives (%)
Population in households (%)
Family households (%)
Nonfamily households (%)
Population in families (%)
Family households with own children (%)
Median number of bedrooms in owner occupied houses
Mean number of bedrooms in owner occupied houses
Median number of bedrooms in renter occupied houses
Mean number of bedrooms in renter occupied houses
Median number of vehichles in owner occupied houses
Mean number of vehichles in owner occupied houses
Median number of vehichles in renter occupied houses
Mean number of vehichles in renter occupied houses
Mortgage status - with mortgage (%)
Mortgage status - with second mortgage (%)
Mortgage status - with home equity loan (%)
Mortgage status - with both second mortgage and home equity loan (%)
Mortgage status - without a mortgage (%)
Average family size
Average family size - White
Average family size - Black or African American
Average family size - Asian
Average family size - Hispanic or Latino
Average family size - American Indian and Alaska Native
Average family size - Multirace
Average family size - Other Race
Geographical mobility - Same house 1 year ago (%)
Geographical mobility - Moved within same county (%)
Geographical mobility - Moved from different county within same state (%)
Geographical mobility - Moved from different state (%)
Geographical mobility - Moved from abroad (%)
Place of birth - Born in state of residence (%)
Place of birth - Born in other state (%)
Place of birth - Native, outside of US (%)
Place of birth - Foreign born (%)
Housing units in structures - 1, detached (%)
Housing units in structures - 1, attached (%)
Housing units in structures - 2 (%)
Housing units in structures - 3 or 4 (%)
Housing units in structures - 5 to 9 (%)
Housing units in structures - 10 to 19 (%)
Housing units in structures - 20 to 49 (%)
Housing units in structures - 50 or more (%)
Housing units in structures - Mobile home (%)
Housing units in structures - Boat, RV, van, etc. (%)
House/condo owner moved in on average (years ago)
Renter moved in on average (years ago)
Year householder moved into unit - Moved in 1999 to March 2000 (%)
Year householder moved into unit - Moved in 1995 to 1998 (%)
Year householder moved into unit - Moved in 1990 to 1994 (%)
Year householder moved into unit - Moved in 1980 to 1989 (%)
Year householder moved into unit - Moved in 1970 to 1979 (%)
Year householder moved into unit - Moved in 1969 or earlier (%)
Means of transportation to work - Drove car alone (%)
Means of transportation to work - Carpooled (%)
Means of transportation to work - Public transportation (%)
Means of transportation to work - Bus or trolley bus (%)
Means of transportation to work - Streetcar or trolley car (%)
Means of transportation to work - Subway or elevated (%)
Means of transportation to work - Railroad (%)
Means of transportation to work - Ferryboat (%)
Means of transportation to work - Taxicab (%)
Means of transportation to work - Motorcycle (%)
Means of transportation to work - Bicycle (%)
Means of transportation to work - Walked (%)
Means of transportation to work - Other means (%)
Working at home (%)
Industry diversity
Most Common Industries - Agriculture, forestry, fishing and hunting, and mining (%)
Most Common Industries - Agriculture, forestry, fishing and hunting (%)
Most Common Industries - Mining, quarrying, and oil and gas extraction (%)
Most Common Industries - Construction (%)
Most Common Industries - Manufacturing (%)
Most Common Industries - Wholesale trade (%)
Most Common Industries - Retail trade (%)
Most Common Industries - Transportation and warehousing, and utilities (%)
Most Common Industries - Transportation and warehousing (%)
Most Common Industries - Utilities (%)
Most Common Industries - Information (%)
Most Common Industries - Finance and insurance, and real estate and rental and leasing (%)
Most Common Industries - Finance and insurance (%)
Most Common Industries - Real estate and rental and leasing (%)
Most Common Industries - Professional, scientific, and management, and administrative and waste management services (%)
Most Common Industries - Professional, scientific, and technical services (%)
Most Common Industries - Management of companies and enterprises (%)
Most Common Industries - Administrative and support and waste management services (%)
Most Common Industries - Educational services, and health care and social assistance (%)
Most Common Industries - Educational services (%)
Most Common Industries - Health care and social assistance (%)
Most Common Industries - Arts, entertainment, and recreation, and accommodation and food services (%)
Most Common Industries - Arts, entertainment, and recreation (%)
Most Common Industries - Accommodation and food services (%)
Most Common Industries - Other services, except public administration (%)
Most Common Industries - Public administration (%)
Occupation diversity
Most Common Occupations - Management, business, science, and arts occupations (%)
Most Common Occupations - Management, business, and financial occupations (%)
Most Common Occupations - Management occupations (%)
Most Common Occupations - Business and financial operations occupations (%)
Most Common Occupations - Computer, engineering, and science occupations (%)
Most Common Occupations - Computer and mathematical occupations (%)
Most Common Occupations - Architecture and engineering occupations (%)
Most Common Occupations - Life, physical, and social science occupations (%)
Most Common Occupations - Education, legal, community service, arts, and media occupations (%)
Most Common Occupations - Community and social service occupations (%)
Most Common Occupations - Legal occupations (%)
Most Common Occupations - Education, training, and library occupations (%)
Most Common Occupations - Arts, design, entertainment, sports, and media occupations (%)
Most Common Occupations - Healthcare practitioners and technical occupations (%)
Most Common Occupations - Health diagnosing and treating practitioners and other technical occupations (%)
Most Common Occupations - Health technologists and technicians (%)
Most Common Occupations - Service occupations (%)
Most Common Occupations - Healthcare support occupations (%)
Most Common Occupations - Protective service occupations (%)
Most Common Occupations - Fire fighting and prevention, and other protective service workers including supervisors (%)
Most Common Occupations - Law enforcement workers including supervisors (%)
Most Common Occupations - Food preparation and serving related occupations (%)
Most Common Occupations - Building and grounds cleaning and maintenance occupations (%)
Most Common Occupations - Personal care and service occupations (%)
Most Common Occupations - Sales and office occupations (%)
Most Common Occupations - Sales and related occupations (%)
Most Common Occupations - Office and administrative support occupations (%)
Most Common Occupations - Natural resources, construction, and maintenance occupations (%)
Most Common Occupations - Farming, fishing, and forestry occupations (%)
Most Common Occupations - Construction and extraction occupations (%)
Most Common Occupations - Installation, maintenance, and repair occupations (%)
Most Common Occupations - Production, transportation, and material moving occupations (%)
Most Common Occupations - Production occupations (%)
Most Common Occupations - Transportation occupations (%)
Most Common Occupations - Material moving occupations (%)
People in Group quarters - Institutionalized population (%)
People in Group quarters - Correctional institutions (%)
People in Group quarters - Federal prisons and detention centers (%)
People in Group quarters - Halfway houses (%)
People in Group quarters - Local jails and other confinement facilities (including police lockups) (%)
People in Group quarters - Military disciplinary barracks (%)
People in Group quarters - State prisons (%)
People in Group quarters - Other types of correctional institutions (%)
People in Group quarters - Nursing homes (%)
People in Group quarters - Hospitals/wards, hospices, and schools for the handicapped (%)
People in Group quarters - Hospitals/wards and hospices for chronically ill (%)
People in Group quarters - Hospices or homes for chronically ill (%)
People in Group quarters - Military hospitals or wards for chronically ill (%)
People in Group quarters - Other hospitals or wards for chronically ill (%)
People in Group quarters - Hospitals or wards for drug/alcohol abuse (%)
People in Group quarters - Mental (Psychiatric) hospitals or wards (%)
People in Group quarters - Schools, hospitals, or wards for the mentally retarded (%)
People in Group quarters - Schools, hospitals, or wards for the physically handicapped (%)
People in Group quarters - Institutions for the deaf (%)
People in Group quarters - Institutions for the blind (%)
People in Group quarters - Orthopedic wards and institutions for the physically handicapped (%)
People in Group quarters - Wards in general hospitals for patients who have no usual home elsewhere (%)
People in Group quarters - Wards in military hospitals for patients who have no usual home elsewhere (%)
People in Group quarters - Juvenile institutions (%)
People in Group quarters - Long-term care (%)
People in Group quarters - Homes for abused, dependent, and neglected children (%)
People in Group quarters - Residential treatment centers for emotionally disturbed children (%)
People in Group quarters - Training schools for juvenile delinquents (%)
People in Group quarters - Short-term care, detention or diagnostic centers for delinquent children (%)
People in Group quarters - Type of juvenile institution unknown (%)
People in Group quarters - Noninstitutionalized population (%)
People in Group quarters - College dormitories (includes college quarters off campus) (%)
People in Group quarters - Military quarters (%)
People in Group quarters - On base (%)
People in Group quarters - Barracks, unaccompanied personnel housing (UPH), (Enlisted/Officer), ;and similar group living quarters for military personnel (%)
People in Group quarters - Transient quarters for temporary residents (%)
People in Group quarters - Military ships (%)
People in Group quarters - Group homes (%)
People in Group quarters - Homes or halfway houses for drug/alcohol abuse (%)
People in Group quarters - Homes for the mentally ill (%)
People in Group quarters - Homes for the mentally retarded (%)
People in Group quarters - Homes for the physically handicapped (%)
People in Group quarters - Other group homes (%)
People in Group quarters - Religious group quarters (%)
People in Group quarters - Dormitories (%)
People in Group quarters - Agriculture workers' dormitories on farms (%)
People in Group quarters - Job Corps and vocational training facilities (%)
People in Group quarters - Other workers' dormitories (%)
People in Group quarters - Crews of maritime vessels (%)
People in Group quarters - Other nonhousehold living situations (%)
People in Group quarters - Other noninstitutional group quarters (%)
Residents speaking English at home (%)
Residents speaking English at home - Born in the United States (%)
Residents speaking English at home - Native, born elsewhere (%)
Residents speaking English at home - Foreign born (%)
Residents speaking Spanish at home (%)
Residents speaking Spanish at home - Born in the United States (%)
Residents speaking Spanish at home - Native, born elsewhere (%)
Residents speaking Spanish at home - Foreign born (%)
Residents speaking other language at home (%)
Residents speaking other language at home - Born in the United States (%)
Residents speaking other language at home - Native, born elsewhere (%)
Residents speaking other language at home - Foreign born (%)
Class of Workers - Employee of private company (%)
Class of Workers - Self-employed in own incorporated business (%)
Class of Workers - Private not-for-profit wage and salary workers (%)
Class of Workers - Local government workers (%)
Class of Workers - State government workers (%)
Class of Workers - Federal government workers (%)
Class of Workers - Self-employed workers in own not incorporated business and Unpaid family workers (%)
House heating fuel used in houses and condos - Utility gas (%)
House heating fuel used in houses and condos - Bottled, tank, or LP gas (%)
House heating fuel used in houses and condos - Electricity (%)
House heating fuel used in houses and condos - Fuel oil, kerosene, etc. (%)
House heating fuel used in houses and condos - Coal or coke (%)
House heating fuel used in houses and condos - Wood (%)
House heating fuel used in houses and condos - Solar energy (%)
House heating fuel used in houses and condos - Other fuel (%)
House heating fuel used in houses and condos - No fuel used (%)
House heating fuel used in apartments - Utility gas (%)
House heating fuel used in apartments - Bottled, tank, or LP gas (%)
House heating fuel used in apartments - Electricity (%)
House heating fuel used in apartments - Fuel oil, kerosene, etc. (%)
House heating fuel used in apartments - Coal or coke (%)
House heating fuel used in apartments - Wood (%)
House heating fuel used in apartments - Solar energy (%)
House heating fuel used in apartments - Other fuel (%)
House heating fuel used in apartments - No fuel used (%)
Armed forces status - In Armed Forces (%)
Armed forces status - Civilian (%)
Armed forces status - Civilian - Veteran (%)
Armed forces status - Civilian - Nonveteran (%)
Fatal accidents locations in years 2005-2021
Fatal accidents locations in 2005
Fatal accidents locations in 2006
Fatal accidents locations in 2007
Fatal accidents locations in 2008
Fatal accidents locations in 2009
Fatal accidents locations in 2010
Fatal accidents locations in 2011
Fatal accidents locations in 2012
Fatal accidents locations in 2013
Fatal accidents locations in 2014
Fatal accidents locations in 2015
Fatal accidents locations in 2016
Fatal accidents locations in 2017
Fatal accidents locations in 2018
Fatal accidents locations in 2019
Fatal accidents locations in 2020
Fatal accidents locations in 2021
Alcohol use - People drinking some alcohol every month (%)
Alcohol use - People not drinking at all (%)
Alcohol use - Average days/month drinking alcohol
Alcohol use - Average drinks/week
Alcohol use - Average days/year people drink much
Audiometry - Average condition of hearing (%)
Audiometry - People that can hear a whisper from across a quiet room (%)
Audiometry - People that can hear normal voice from across a quiet room (%)
Audiometry - Ears ringing, roaring, buzzing (%)
Audiometry - Had a job exposure to loud noise (%)
Audiometry - Had off-work exposure to loud noise (%)
Blood Pressure & Cholesterol - Has high blood pressure (%)
Blood Pressure & Cholesterol - Checking blood pressure at home (%)
Blood Pressure & Cholesterol - Frequently checking blood cholesterol (%)
Blood Pressure & Cholesterol - Has high cholesterol level (%)
Consumer Behavior - Money monthly spent on food at supermarket/grocery store
Consumer Behavior - Money monthly spent on food at other stores
Consumer Behavior - Money monthly spent on eating out
Consumer Behavior - Money monthly spent on carryout/delivered foods
Consumer Behavior - Income spent on food at supermarket/grocery store (%)
Consumer Behavior - Income spent on food at other stores (%)
Consumer Behavior - Income spent on eating out (%)
Consumer Behavior - Income spent on carryout/delivered foods (%)
Current Health Status - General health condition (%)
Current Health Status - Blood donors (%)
Current Health Status - Has blood ever tested for HIV virus (%)
Current Health Status - Left-handed people (%)
Dermatology - People using sunscreen (%)
Diabetes - Diabetics (%)
Diabetes - Had a blood test for high blood sugar (%)
Diabetes - People taking insulin (%)
Diet Behavior & Nutrition - Diet health (%)
Diet Behavior & Nutrition - Milk product consumption (# of products/month)
Diet Behavior & Nutrition - Meals not home prepared (#/week)
Diet Behavior & Nutrition - Meals from fast food or pizza place (#/week)
Diet Behavior & Nutrition - Ready-to-eat foods (#/month)
Diet Behavior & Nutrition - Frozen meals/pizza (#/month)
Drug Use - People that ever used marijuana or hashish (%)
Drug Use - Ever used hard drugs (%)
Drug Use - Ever used any form of cocaine (%)
Drug Use - Ever used heroin (%)
Drug Use - Ever used methamphetamine (%)
Health Insurance - People covered by health insurance (%)
Kidney Conditions-Urology - Avg. # of times urinating at night
Medical Conditions - People with asthma (%)
Medical Conditions - People with anemia (%)
Medical Conditions - People with psoriasis (%)
Medical Conditions - People with overweight (%)
Medical Conditions - Elderly people having difficulties in thinking or remembering (%)
Medical Conditions - People who ever received blood transfusion (%)
Medical Conditions - People having trouble seeing even with glass/contacts (%)
Medical Conditions - People with arthritis (%)
Medical Conditions - People with gout (%)
Medical Conditions - People with congestive heart failure (%)
Medical Conditions - People with coronary heart disease (%)
Medical Conditions - People with angina pectoris (%)
Medical Conditions - People who ever had heart attack (%)
Medical Conditions - People who ever had stroke (%)
Medical Conditions - People with emphysema (%)
Medical Conditions - People with thyroid problem (%)
Medical Conditions - People with chronic bronchitis (%)
Medical Conditions - People with any liver condition (%)
Medical Conditions - People who ever had cancer or malignancy (%)
Mental Health - People who have little interest in doing things (%)
Mental Health - People feeling down, depressed, or hopeless (%)
Mental Health - People who have trouble sleeping or sleeping too much (%)
Mental Health - People feeling tired or having little energy (%)
Mental Health - People with poor appetite or overeating (%)
Mental Health - People feeling bad about themself (%)
Mental Health - People who have trouble concentrating on things (%)
Mental Health - People moving or speaking slowly or too fast (%)
Mental Health - People having thoughts they would be better off dead (%)
Oral Health - Average years since last visit a dentist
Oral Health - People embarrassed because of mouth (%)
Oral Health - People with gum disease (%)
Oral Health - General health of teeth and gums (%)
Oral Health - Average days a week using dental floss/device
Oral Health - Average days a week using mouthwash for dental problem
Oral Health - Average number of teeth
Pesticide Use - Households using pesticides to control insects (%)
Pesticide Use - Households using pesticides to kill weeds (%)
Physical Activity - People doing vigorous-intensity work activities (%)
Physical Activity - People doing moderate-intensity work activities (%)
Physical Activity - People walking or bicycling (%)
Physical Activity - People doing vigorous-intensity recreational activities (%)
Physical Activity - People doing moderate-intensity recreational activities (%)
Physical Activity - Average hours a day doing sedentary activities
Physical Activity - Average hours a day watching TV or videos
Physical Activity - Average hours a day using computer
Physical Functioning - People having limitations keeping them from working (%)
Physical Functioning - People limited in amount of work they can do (%)
Physical Functioning - People that need special equipment to walk (%)
Physical Functioning - People experiencing confusion/memory problems (%)
Physical Functioning - People requiring special healthcare equipment (%)
Prescription Medications - Average number of prescription medicines taking
Preventive Aspirin Use - Adults 40+ taking low-dose aspirin (%)
Reproductive Health - Vaginal deliveries (%)
Reproductive Health - Cesarean deliveries (%)
Reproductive Health - Deliveries resulted in a live birth (%)
Reproductive Health - Pregnancies resulted in a delivery (%)
Reproductive Health - Women breastfeeding newborns (%)
Reproductive Health - Women that had a hysterectomy (%)
Reproductive Health - Women that had both ovaries removed (%)
Reproductive Health - Women that have ever taken birth control pills (%)
Reproductive Health - Women taking birth control pills (%)
Reproductive Health - Women that have ever used Depo-Provera or injectables (%)
Reproductive Health - Women that have ever used female hormones (%)
Sexual Behavior - People 18+ that ever had sex (vaginal, anal, or oral) (%)
Sexual Behavior - Males 18+ that ever had vaginal sex with a woman (%)
Sexual Behavior - Males 18+ that ever performed oral sex on a woman (%)
Sexual Behavior - Males 18+ that ever had anal sex with a woman (%)
Sexual Behavior - Males 18+ that ever had any sex with a man (%)
Sexual Behavior - Females 18+ that ever had vaginal sex with a man (%)
Sexual Behavior - Females 18+ that ever performed oral sex on a man (%)
Sexual Behavior - Females 18+ that ever had anal sex with a man (%)
Sexual Behavior - Females 18+ that ever had any kind of sex with a woman (%)
Sexual Behavior - Average age people first had sex
Sexual Behavior - Average number of female sex partners in lifetime (males 18+)
Sexual Behavior - Average number of female vaginal sex partners in lifetime (males 18+)
Sexual Behavior - Average age people first performed oral sex on a woman (18+)
Sexual Behavior - Average number of woman performed oral sex on in lifetime (18+)
Sexual Behavior - Average number of male sex partners in lifetime (males 18+)
Sexual Behavior - Average number of male anal sex partners in lifetime (males 18+)
Sexual Behavior - Average age people first performed oral sex on a man (18+)
Sexual Behavior - Average number of male oral sex partners in lifetime (18+)
Sexual Behavior - People using protection when performing oral sex (%)
Sexual Behavior - Average number of times people have vaginal or anal sex a year
Sexual Behavior - People having sex without condom (%)
Sexual Behavior - Average number of male sex partners in lifetime (females 18+)
Sexual Behavior - Average number of male vaginal sex partners in lifetime (females 18+)
Sexual Behavior - Average number of female sex partners in lifetime (females 18+)
Sexual Behavior - Circumcised males 18+ (%)
Sleep Disorders - Average hours sleeping at night
Sleep Disorders - People that has trouble sleeping (%)
Smoking-Cigarette Use - People smoking cigarettes (%)
Taste & Smell - People 40+ having problems with smell (%)
Taste & Smell - People 40+ having problems with taste (%)
Taste & Smell - People 40+ that ever had wisdom teeth removed (%)
Taste & Smell - People 40+ that ever had tonsils teeth removed (%)
Taste & Smell - People 40+ that ever had a loss of consciousness because of a head injury (%)
Taste & Smell - People 40+ that ever had a broken nose or other serious injury to face or skull (%)
Taste & Smell - People 40+ that ever had two or more sinus infections (%)
Weight - Average height (inches)
Weight - Average weight (pounds)
Weight - Average BMI
Weight - People that are obese (%)
Weight - People that ever were obese (%)
Weight - People trying to lose weight (%)
Urban population: 4,105
Rural population: 8,804
Estimated median house/condo value in 2022: $180,999
29061:
$180,999South Carolina:
$254,600
Median resident age: This zip code:
44.5 yearsSouth Carolina median age:
40.5 years
Average household size: This zip code:
2.5 peopleSouth Carolina:
2.4 people
Averages for the 2020 tax year for zip code 29061, filed in 2021:
Average Adjusted Gross Income (AGI) in 2020: $42,289 (Individual Income Tax Returns) Here:
$42,289State:
$65,754
Salary/wage: $37,800 (reported on 82.9% of returns )Here:
$37,800State:
$52,566
(% of AGI for various income ranges: 1290.6% for AGIs below $25k , 3857.9% for AGIs $25k-50k , 7168.3% for AGIs $50k-75k , 11932.3% for AGIs $75k-100k , 17233.2% for AGIs $100k-200k ) Taxable interest for individuals: $786 (reported on 14.9% of returns )This zip code:
$786South Carolina:
$1,749
(% of AGI for various income ranges: 4.8% for AGIs below $25k , 5.2% for AGIs $25k-50k , 19.7% for AGIs $50k-75k , 48.8% for AGIs $75k-100k , 89.1% for AGIs $100k-200k ) Ordinary dividends: $4,132 (reported on 7.2% of returns )(% of AGI for various income ranges: 3.7% for AGIs below $25k , 4.9% for AGIs $25k-50k , 29.7% for AGIs $50k-75k , 78.8% for AGIs $75k-100k , 315.9% for AGIs $100k-200k ) Net capital gain/loss in AGI: +$12,215 (reported on 5.9% of returns )Here:
+$12,215State:
+$24,194
(% of AGI for various income ranges: 2.3% for AGIs below $25k , 5.6% for AGIs $25k-50k , 30.3% for AGIs $50k-75k , 94.6% for AGIs $75k-100k , 393.2% for AGIs $100k-200k ) Profit/loss from business: +$867 (reported on 16.5% of returns )(% of AGI for various income ranges: 16.7% for AGIs below $25k , 74.9% for AGIs $50k-75k , 71.2% for AGIs $75k-100k , 78.6% for AGIs $100k-200k ) Taxable individual retirement arrangement distribution: $14,755 (reported on 5.8% of returns )29061:
$14,755South Carolina:
$21,604
(% of AGI for various income ranges: 20.2% for AGIs below $25k , 48.6% for AGIs $25k-50k , 144.9% for AGIs $50k-75k , 471.9% for AGIs $75k-100k , 1160.9% for AGIs $100k-200k ) Total itemized deductions: $26,454 (reported on 5.9% of returns )Here:
$26,454State:
$35,199
(% of AGI for various income ranges: 24.4% for AGIs below $25k , 104.7% for AGIs $25k-50k , 410.0% for AGIs $50k-75k , 629.2% for AGIs $75k-100k , 1545.9% for AGIs $100k-200k ) Charity contributions: $10,150 (reported on 5.2% of returns )Here:
$10,150State:
$14,319
(% of AGI for various income ranges: 4.2% for AGIs below $25k , 26.6% for AGIs $25k-50k , 128.3% for AGIs $50k-75k , 214.6% for AGIs $75k-100k , 597.7% for AGIs $100k-200k ) Taxes paid: $5,873 (reported on 5.9% of returns )(% of AGI for various income ranges: 2.3% for AGIs below $25k , 18.1% for AGIs $25k-50k , 72.7% for AGIs $50k-75k , 179.2% for AGIs $75k-100k , 415.0% for AGIs $100k-200k ) Earned income credit: $2,491 (reported on 26.9% of returns )(% of AGI for various income ranges: 140.4% for AGIs below $25k , 93.4% for AGIs $25k-50k ) Percentage of individuals using paid preparers for their 2020 taxes: 91.5%(% for various income ranges: 92.1% for AGIs below $25k , 92.8% for AGIs $25k-50k , 90.0% for AGIs $50k-75k , 87.8% for AGIs $75k-100k , 88.6% for AGIs $100k-200k , 85.7% for AGIs over 200k )
Averages for the 2012 tax year for zip code 29061, filed in 2013:
Average Adjusted Gross Income (AGI) in 2012: $39,587 (Individual Income Tax Returns) Here:
$39,587State:
$51,133
Salary/wage: $34,026 (reported on 87.5% of returns )Here:
$34,026State:
$42,173
(% of AGI for various income ranges: 80.5% for AGIs below $25k , 85.0% for AGIs $25k-50k , 78.8% for AGIs $50k-75k , 74.3% for AGIs $75k-100k , 70.5% for AGIs $100k-200k , 36.8% for AGIs over 200k ) Taxable interest for individuals: $603 (reported on 18.5% of returns )This zip code:
$603South Carolina:
$1,468
(% of AGI for various income ranges: 0.3% for AGIs below $25k , 0.2% for AGIs $25k-50k , 0.3% for AGIs $50k-75k , 0.5% for AGIs $75k-100k , 0.2% for AGIs $100k-200k , 0.2% for AGIs over 200k ) Ordinary dividends: $2,674 (reported on 8.4% of returns )(% of AGI for various income ranges: 0.3% for AGIs below $25k , 0.2% for AGIs $25k-50k , 0.4% for AGIs $50k-75k , 0.8% for AGIs $75k-100k , 0.6% for AGIs $100k-200k , 2.0% for AGIs over 200k ) Net capital gain/loss in AGI: +$5,239 (reported on 4.4% of returns )Here:
+$5,239State:
+$13,061
(% of AGI for various income ranges: 0.1% for AGIs $50k-75k , 0.2% for AGIs $75k-100k , 3.3% for AGIs $100k-200k ) Profit/loss from business: +$2,499 (reported on 13.9% of returns )Here:
+$2,499State:
+$10,167
(% of AGI for various income ranges: 5.1% for AGIs below $25k , 0.4% for AGIs $75k-100k , 0.9% for AGIs $100k-200k ) Taxable individual retirement arrangement distribution: $11,487 (reported on 6.2% of returns )29061:
$11,487South Carolina:
$17,019
(% of AGI for various income ranges: 1.3% for AGIs below $25k , 1.5% for AGIs $25k-50k , 2.0% for AGIs $50k-75k , 1.6% for AGIs $75k-100k , 3.7% for AGIs $100k-200k ) Total itemized deductions: $18,659 (26% of AGI, reported on 29.1% of returns )Here:
$18,659State:
$22,890
Here:
26.1% of AGIState:
21.4% of AGI
(% of AGI for various income ranges: 7.3% for AGIs below $25k , 12.9% for AGIs $25k-50k , 15.9% for AGIs $50k-75k , 16.3% for AGIs $75k-100k , 17.1% for AGIs $100k-200k , 12.8% for AGIs over 200k ) Charity contributions: $4,725 (reported on 24.8% of returns )(% of AGI for various income ranges: 1.0% for AGIs below $25k , 2.6% for AGIs $25k-50k , 3.7% for AGIs $50k-75k , 3.7% for AGIs $75k-100k , 4.6% for AGIs $100k-200k , 1.8% for AGIs over 200k ) Taxes paid: $5,438 (reported on 28.8% of returns )(% of AGI for various income ranges: 1.2% for AGIs below $25k , 2.8% for AGIs $25k-50k , 4.1% for AGIs $50k-75k , 5.2% for AGIs $75k-100k , 6.0% for AGIs $100k-200k , 6.8% for AGIs over 200k ) Earned income credit: $2,517 (reported on 31.5% of returns )(% of AGI for various income ranges: 10.1% for AGIs below $25k , 1.5% for AGIs $25k-50k ) Percentage of individuals using paid preparers for their 2012 taxes: 47.0%(% for various income ranges: 46.4% for AGIs below $25k , 43.5% for AGIs $25k-50k , 51.3% for AGIs $50k-75k , 50.0% for AGIs $75k-100k , 56.2% for AGIs $100k-200k , 75.0% for AGIs over 200k )
Averages for the 2004 tax year for zip code 29061, filed in 2005:
Average Adjusted Gross Income (AGI) in 2004: $34,105 (Individual Income Tax Returns) Here:
$34,105State:
$41,965
Salary/wage: $31,223 (reported on 90.8% of returns )Here:
$31,223State:
$35,695
(% of AGI for various income ranges: 96.8% for AGIs below $10k , 87.3% for AGIs $10k-25k , 87.9% for AGIs $25k-50k , 85.0% for AGIs $50k-75k , 81.7% for AGIs $75k-100k , 68.4% for AGIs over 100k ) Taxable interest for individuals: $805 (reported on 24.6% of returns )This zip code:
$805South Carolina:
$1,623
(% of AGI for various income ranges: 1.6% for AGIs below $10k , 0.7% for AGIs $10k-25k , 0.4% for AGIs $25k-50k , 0.5% for AGIs $50k-75k , 0.5% for AGIs $75k-100k , 0.8% for AGIs over 100k ) Taxable dividends: $1,430 (reported on 10.3% of returns )(% of AGI for various income ranges: 1.5% for AGIs below $10k , 0.3% for AGIs $10k-25k , 0.3% for AGIs $25k-50k , 0.2% for AGIs $50k-75k , 0.7% for AGIs $75k-100k , 0.8% for AGIs over 100k ) Net capital gain/loss: +$3,563 (reported on 6.8% of returns )Here:
+$3,563State:
+$13,100
(% of AGI for various income ranges: -1.3% for AGIs below $10k , -0.0% for AGIs $10k-25k , 0.0% for AGIs $25k-50k , 0.1% for AGIs $50k-75k , 0.2% for AGIs $75k-100k , 3.9% for AGIs over 100k ) Profit/loss from business: +$2,962 (reported on 11.6% of returns )Here:
+$2,962State:
+$9,144
(% of AGI for various income ranges: 2.9% for AGIs below $10k , 1.6% for AGIs $10k-25k , 0.7% for AGIs $25k-50k , 1.0% for AGIs $50k-75k , -0.4% for AGIs $75k-100k , 1.6% for AGIs over 100k ) IRA payment deduction: $2,296 (reported on 1.6% of returns )29061:
$2,296South Carolina:
$2,972
(% of AGI for various income ranges: 0.1% for AGIs $10k-25k , 0.1% for AGIs $25k-50k , 0.2% for AGIs $50k-75k , 0.3% for AGIs $75k-100k ) Self-employed pension: $6,300 (reported on 0.2% of returns )Here:
$6,300South Carolina:
$15,117
Total itemized deductions: $15,980 (26% of AGI, reported on 32.4% of returns )Here:
$15,980State:
$19,039
Here:
26.3% of AGIState:
22.8% of AGI
(% of AGI for various income ranges: 6.5% for AGIs below $10k , 8.8% for AGIs $10k-25k , 15.7% for AGIs $25k-50k , 18.2% for AGIs $50k-75k , 18.5% for AGIs $75k-100k , 15.9% for AGIs over 100k ) Charity contributions deductions: $3,870 (6% of AGI, reported on 29.7% of returns )Here:
6.2% of AGIState:
5.0% of AGI
(% of AGI for various income ranges: 0.9% for AGIs below $10k , 1.4% for AGIs $10k-25k , 3.4% for AGIs $25k-50k , 4.1% for AGIs $50k-75k , 4.2% for AGIs $75k-100k , 4.1% for AGIs over 100k ) Total tax: $4,388 (reported on 65.6% of returns )(% of AGI for various income ranges: 1.8% for AGIs below $10k , 2.8% for AGIs $10k-25k , 5.7% for AGIs $25k-50k , 8.3% for AGIs $50k-75k , 9.7% for AGIs $75k-100k , 18.5% for AGIs over 100k ) Earned income credit: $1,947 (reported on 28.0% of returns )Percentage of individuals using paid preparers for their 2004 taxes: 60.2%(% for various income ranges: 54.7% for AGIs below $10k , 63.0% for AGIs $10k-25k , 61.6% for AGIs $25k-50k , 58.5% for AGIs $50k-75k , 57.6% for AGIs $75k-100k , 60.7% for AGIs over 100k )
Estimated median household income in 2022: This zip code:
$63,046South Carolina:
$64,115
Nearest zip codes: 29209 ,
29207 ,
29052 ,
29044 ,
29206 ,
29205 .
Gadsden Zip Code Map
Percentage of family households: This zip code:
40.9%South Carolina:
44.7%
Percentage of households with unmarried partners: This zip code:
6.0%South Carolina:
47.7%
No gay or lesbian households reported
Household received Food Stamps/SNAP in the past 12 months: 730Household did not receive Food Stamps/SNAP in the past 12 months: 4,376
Women who had a birth in the past 12 months: 18 (0 now married , 16 unmarried) Women who did not have a birth in the past 12 months: 2,571 (1,008 now married , 1,560 unmarried)
Housing units in zip code 29061 with a mortgage: 2,196 (193
second mortgage , 113
both second mortgage and home equity loan )
Houses without a mortgage: 99
Median monthly owner costs for units with a mortgage: $1,163
Median monthly owner costs for units without a mortgage: $447
Residents with income below the poverty level in 2022:
This zip code:
10.8%Whole state:
14.0%
Residents with income below 50% of the poverty level in 2022:
This zip code:
6.9%Whole state:
7.3%
Median number of rooms in houses and condos: Median number of rooms in apartments: Notable locations in this zip code not listed on our city pages
Click to draw/clear zip code borders Notable locations in zip code 29061: (A) , Cedar Creek Hunt Club (B) , Columbia - Richland Fire Department Lower Richland (C) , Columbia - Richland Fire Department Hopkins (D) . Display/hide their locations on the map
Churches in zip code 29061 include: (A) , Siloam Church (B) , Beulah Church (C) , Mount Olive Church (D) , Zion Pilgrim Church (E) , Lebanon Church (F) , Jerusalem Church (G) , Browns Chapel (H) , Caponia Church (I) . Display/hide their locations on the map
Cemeteries: (1) , Myers Cemetery (2) , Logues Cemetery (3) , Bethel Cemetery (4) . Display/hide their locations on the map
Lakes and reservoirs: (A) , Wise Lake (B) , Roundabout Lake (C) , Goose Pond (D) , Sunset Lake (E) , Caughmans Pond (F) , Clarkson Pond (G) , Duffies Pond (H) . Display/hide their locations on the map
Streams, rivers, and creeks: (A) , Reeves Branch (B) , Horsepen Branch (C) , Dry Branch (D) , Dead River (E) , Goose Branch (F) , Cabin Branch (G) , Mill Creek (H) . Display/hide their locations on the map
Year house built (houses)
7 2020 or later514 2010 to 20191,232 2000 to 20091,098 1990 to 19991,024 1980 to 1989755 1970 to 1979350 1960 to 1969249 1950 to 195999 1940 to 1949175 1939 or earlier
Zip code 29061 household income distribution in 2022 273 Less than $10,000236 $10,000 to $14,999278 $15,000 to $19,999156 $20,000 to $24,99977 $25,000 to $29,999174 $30,000 to $34,999270 $35,000 to $39,999285 $40,000 to $44,999124 $45,000 to $49,999535 $50,000 to $59,999498 $60,000 to $74,999667 $75,000 to $99,999460 $100,000 to $124,999507 $125,000 to $149,999326 $150,000 to $199,999220 $200,000 or moreEstimate of home value of owner-occupied houses/condos in 2022 in zip code 29061 79 Less than $10,00062 $15,000 to $19,99954 $20,000 to $24,99920 $25,000 to $29,99914 $30,000 to $34,99996 $35,000 to $39,99980 $40,000 to $49,999157 $50,000 to $59,99964 $60,000 to $69,999181 $70,000 to $79,999152 $80,000 to $89,999119 $90,000 to $99,999184 $100,000 to $124,999168 $125,000 to $149,999399 $150,000 to $174,999168 $175,000 to $199,999391 $200,000 to $249,999315 $250,000 to $299,999258 $300,000 to $399,999321 $400,000 to $499,99946 $500,000 to $749,99953 $750,000 to $999,99926 $1,000,000 to $1,499,999Rent paid by renters in 2022 in zip code 29061 30 $350 to $399107 $450 to $49925 $500 to $54988 $550 to $59913 $600 to $64950 $650 to $69915 $700 to $74984 $800 to $899100 $900 to $999370 $1,000 to $1,24986 $1,250 to $1,4996 $1,500 to $1,99947 $2,500 to $2,999253 No cash rent
Median gross rent in 2022: $1,301.
Median price asked for vacant for-sale houses and condos in 2022: $147,757.
Estimated median house (or condo) value in 2022 for: White Non-Hispanic householders: $233,159Black or African American householders: $188,450American Indian or Alaska Native householders: $156,240Asian householders: $186,287Some other race householders: $178,595Two or more races householders: $244,216Hispanic or Latino householders: $166,336Estimated median house or condo value in 2022: $180,999
29061:
$180,999South Carolina:
$254,600
Lower value quartile - upper value quartile: $99,412 - $271,556
Mean price in 2022: Detached houses: $254,966Here:
$254,966State:
$368,255
Mobile homes: $72,754Here:
$72,754State:
$102,531
Housing units in structures:
One, detached: 4,0503 or 4: 175 to 9: 1220 to 49: 62Mobile homes: 1,514Unemployment : 4.6%
Means of transportation to work in zip code 29061 78.1% 4,884 Drove a car alone5.7% 359 Carpooled0.8% 49 Bus or trolley bus5.9% 367 Other means9.3% 579 Worked at homeTravel time to work (commute) in zip code 29061 63 Less than 5 minutes231 5 to 9 minutes202 10 to 14 minutes594 15 to 19 minutes1,256 20 to 24 minutes644 25 to 29 minutes1,432 30 to 34 minutes182 35 to 39 minutes309 40 to 44 minutes456 45 to 59 minutes213 60 to 89 minutes49 90 or more minutes
Neighborhoods in zip code 29061: Percentage of zip code residents living and working in this county: 85.6%
Household type by relationship:
Households: 12,910
Male householders: 2,511 (520 living alone ), Female householders: 2,587 (905 living alone )2,058 spouses (2,003 opposite-sex spouses ), 461 unmarried partners , (461 opposite-sex unmarried partners ), 3,167 children (3,053 natural , 53 adopted , 55 stepchildren ), 708 grandchildren , 116 brothers or sisters , 241 parents , 266 foster children , 531 other relatives , 227 non-relatives In group quarters: 108 (-1 institutionalized population )
Size of family households: 1,388 2-persons , 1,124 3-persons , 472 4-persons , 198 5-persons , 76 6-persons , 92 7-or-more-persons
Size of nonfamily households: 1,426 1-person , 283 2-persons , 28 3-persons
1,024 married couples with children. single-parent households (198 men , 509 women ).
95.8% of residents of 29061 zip code speak English at home. of residents speak Spanish at home (84% very well, 8% well, 8% not well ).of residents speak other Indo-European language at home (30% very well, 70% well ).of residents speak Asian or Pacific Island language at home (3% very well, 97% well ).of residents speak other language at home (100% very well ).
Foreign born population: 367 (2.8%)
(64.4%
of them are naturalized citizens )
This zip code:
2.8%Whole state:
5.2%
39% Honduras 18% Bhutan 12% Bolivia 10% Liberia 8% Brazil 5% France 4% Dominican Republic 5% American 5% German 3% European 2% Italian 1% English 1% African 1% Eastern European
Year of entry for the foreign-born population
97 2010 or later 23 2000 to 2009 89 1990 to 1999 175 Before 1990
Facilities with environmental interests located in this zip code:
CORESLAB STRUCTURES COLUMBIA INCORPORATED (9790 GARNERS FERRY RD in HOPKINS, SC)
AIR MINOR (AIRS/AFS) STATE MASTER (South Carolina database) - AIR PROGRAM, Business SIC classification: CONCRETE PRODUCTS, EXCEPT BLOCK AND BRICK; READY-MIXED CONCRETE; SERVICES
Housing units lacking complete plumbing facilities: 2.7%
Housing units lacking complete kitchen facilities: 2.7%
83.6% Electricity 6.1% Bottled, tank, or LP gas 5.4% Utility gas 2.1% Other fuel 1.3% Fuel oil, kerosene, etc. 1.0% Wood 0.6% Solar energy
Population in 1990: 12,297. Population change in the 1990s: +728 (+5.9%).
Place of birth for U.S.-born residents:
This state: 9,027Northeast: 812Midwest: 473South: 1,533West: 548
69% of the 29061 zip code residents lived in the same house 5 years ago.
Out of people who lived in different houses, 73% lived in this county.
Out of people who lived in different counties, 50% lived in South Carolina.
89% of the 29061 zip code residents lived in the same house 1 year ago.
Out of people who lived in different houses, 70% moved from this county.
Out of people who lived in different houses, 7% moved from different county within same state.
Out of people who lived in different houses, 7% moved from different state.
Out of people who lived in different houses, 5% moved from abroad.
Private vs. public school enrollment:
Students in private schools in grades 1 to 8 (elementary and middle school): 161
Here:
10.8%South Carolina:
14.4%
Students in private schools in grades 9 to 12 (high school): 29
Here:
5.5%South Carolina:
11.1%
Students in private undergraduate colleges: 36
Here:
20.5%South Carolina:
21.9%
Occupation by median earnings in the past 12 months ($)
88,401 Health diagnosing and treating practitioners and other technical occupations 70,450 Education, training, and library occupations 59,440 Management occupations 57,682 Life, physical, and social science occupations 57,106 Production occupations 55,920 Installation, maintenance, and repair occupations
Companies with federal contracts located in this zip code (HOPKINS, SC):
NORRIS, MICHAEL J (1225 CANDLEWOOD DRIVE; small business) in 2 contracts from 2005 to 2006
$27,040 with Army for Other Administrative Support Services. Signed on 2006-05-04. Completion date: 2006-08-04.
with Army for Miscellaneous Items. Signed on 2005-07-12. Completion date: 2005-08-12.
E G COMPANY INC (1223 RIDGE RD; small business) in 3 contracts from 2002 to 2004
$7,200 with Army for Forest Tree Planting Services. Signed on 2004-03-15. Completion date: 2004-04-05.
with Army for Ophthalmic Instruments, Equipment, and Supplies. Signed on 2002-12-02. Completion date: 2002-11-04.
, same as above. Signed on 2003-02-04. Completion date: 2002-11-04.
MAC'S ELECTRIC (2709 TROTTER RD; small business) in 3 contracts from 2004 to 2005
$5,150 with Army for Installation of Equipment -- Electrical and Electronic Equipment Components. Signed on 2004-09-01. Completion date: 2004-09-16.
, same as above. Signed on 2005-08-22. Completion date: 2005-09-06.
, same as above. Signed on 2004-09-23. Completion date: 2004-09-23.
CLEAN AIRE OF COLUMBIA (1006 RABBIT RUN; small business)
$6,500 with Navy for Maintenance, Repair or Alteration of Real Property -- Troop Housing Facilities. Taking place in GA. Signed on 1999-11-09. Completion date: 1999-11-30.
CONCRETE JUNGLE (611 HARMON RD LOT 14; small business) in 3 contracts in 2005
$7,700 with Army for Landscaping/Groundskeeping Services. Signed on 2005-05-13. Completion date: 2005-06-25.
, same as above. Signed on 2005-12-19. Completion date: 2005-06-25.
, same as above. Signed on 2005-09-07. Completion date: 2005-06-25.
NEW DIMENSIONS CABLING (1575 CONGAREE ROAD; small business)
$2,500 with Army for Construction of Structures and Facilities -- Museums and Exhibition Buildings. Signed on 2002-03-19. Completion date: 2002-04-04.
Top industries in this zip code by the number of employees in 2005:
Health Care and Social Assistance: Nursing Care Facilities (50-99 employees: 1 establishment)Other Services (except Public Administration): Religious Organizations (10-19: 2, 5-9: 2, 1-4: 3)Health Care and Social Assistance: Residential Mental Retardation Facilities (10-19: 1, 5-9: 4)Construction: Masonry Contractors (10-19: 1, 5-9: 1, 1-4: 2)Administrative and Support and Waste Management and Remediation Services: Janitorial Services (10-19: 1, 5-9: 1, 1-4: 1)Health Care and Social Assistance: Child Day Care Services (5-9: 2, 1-4: 2)
People in group quarters in 2010:
35 people in nursing facilities/skilled-nursing facilities
23 people in group homes intended for adults
20 people in residential treatment centers for adults
People in group quarters in 2000:
22 people in other noninstitutional group quarters
20 people in nursing homes
8 people in schools, hospitals, or wards for the intellectually disabled
Fatal accident statistics in 2014:
Fatal accident count: 3Vehicles involved in fatal accidents: 4Fatal accidents caused by drunken drivers: 0Fatalities: 3Persons involved in fatal accidents: 10Pedestrians involved in fatal accidents: 2
Fatal accident statistics in 2013:
Fatal accident count: 4Vehicles involved in fatal accidents: 7Fatal accidents caused by drunken drivers: 3Fatalities: 4Persons involved in fatal accidents: 9Pedestrians involved in fatal accidents: 0
Home Mortgage Disclosure Act Aggregated Statistics For Year 2009(Based on 6 partial tracts) A) FHA, FSA/RHS & VA B) Conventional C) Refinancings D) Home Improvement Loans F) Non-occupant Loans on G) Loans On Manufactured Number Average Value Number Average Value Number Average Value Number Average Value Number Average Value Number Average Value
LOANS ORIGINATED 182 $127,916 83 $103,220 368 $141,041 13 $64,555 49 $84,086 13 $64,946 APPLICATIONS APPROVED, NOT ACCEPTED 5 $179,978 9 $85,392 44 $129,775 1 $109,290 10 $60,122 4 $55,212 APPLICATIONS DENIED 41 $92,241 35 $68,540 247 $124,631 22 $42,540 22 $102,194 23 $59,954 APPLICATIONS WITHDRAWN 15 $106,498 7 $121,626 127 $121,619 6 $66,802 10 $84,120 6 $79,493 FILES CLOSED FOR INCOMPLETENESS 5 $89,984 2 $87,335 31 $139,190 1 $33,870 2 $172,830 1 $78,110
Aggregated Statistics For Year 2008(Based on 6 partial tracts) A) FHA, FSA/RHS & VA B) Conventional C) Refinancings D) Home Improvement Loans E) Loans on Dwellings For 5+ Families F) Non-occupant Loans on G) Loans On Manufactured Number Average Value Number Average Value Number Average Value Number Average Value Number Average Value Number Average Value Number Average Value
LOANS ORIGINATED 155 $122,854 124 $110,883 279 $126,927 18 $31,495 1 $126,490 67 $81,699 26 $66,403 APPLICATIONS APPROVED, NOT ACCEPTED 2 $111,635 31 $73,648 72 $110,261 13 $36,185 0 $0 17 $65,292 10 $65,721 APPLICATIONS DENIED 26 $99,663 59 $80,866 328 $114,420 82 $41,492 0 $0 32 $98,957 39 $58,184 APPLICATIONS WITHDRAWN 14 $100,456 14 $80,816 112 $115,843 7 $62,776 0 $0 10 $52,343 4 $40,512 FILES CLOSED FOR INCOMPLETENESS 4 $102,270 1 $17,280 27 $131,264 7 $24,953 0 $0 4 $48,555 1 $105,060
Aggregated Statistics For Year 2007(Based on 6 partial tracts) A) FHA, FSA/RHS & VA B) Conventional C) Refinancings D) Home Improvement Loans F) Non-occupant Loans on G) Loans On Manufactured Number Average Value Number Average Value Number Average Value Number Average Value Number Average Value Number Average Value
LOANS ORIGINATED 73 $134,498 294 $99,301 314 $106,544 42 $58,373 90 $72,747 45 $63,890 APPLICATIONS APPROVED, NOT ACCEPTED 12 $156,661 56 $84,401 126 $122,077 18 $19,008 11 $71,354 15 $58,032 APPLICATIONS DENIED 11 $106,031 99 $98,176 465 $106,740 134 $49,802 36 $86,147 44 $69,958 APPLICATIONS WITHDRAWN 9 $98,589 40 $124,822 176 $116,273 9 $73,413 12 $86,725 2 $77,760 FILES CLOSED FOR INCOMPLETENESS 1 $115,640 13 $126,353 38 $125,038 4 $47,392 3 $55,723 2 $20,320
Aggregated Statistics For Year 2006(Based on 6 partial tracts) A) FHA, FSA/RHS & VA B) Conventional C) Refinancings D) Home Improvement Loans F) Non-occupant Loans on G) Loans On Manufactured Number Average Value Number Average Value Number Average Value Number Average Value Number Average Value Number Average Value
LOANS ORIGINATED 89 $131,099 387 $90,381 330 $103,989 58 $32,994 136 $80,815 37 $56,922 APPLICATIONS APPROVED, NOT ACCEPTED 5 $111,354 71 $66,228 99 $85,454 16 $16,742 19 $50,526 25 $55,695 APPLICATIONS DENIED 9 $124,860 186 $82,781 565 $101,494 118 $44,809 68 $72,277 80 $51,255 APPLICATIONS WITHDRAWN 8 $140,239 57 $86,558 223 $103,415 10 $58,595 34 $59,866 3 $167,727 FILES CLOSED FOR INCOMPLETENESS 1 $102,990 19 $84,179 68 $101,576 3 $72,083 7 $83,000 2 $53,430
Aggregated Statistics For Year 2005(Based on 6 partial tracts) A) FHA, FSA/RHS & VA B) Conventional C) Refinancings D) Home Improvement Loans F) Non-occupant Loans on G) Loans On Manufactured Number Average Value Number Average Value Number Average Value Number Average Value Number Average Value Number Average Value
LOANS ORIGINATED 57 $104,435 335 $90,664 415 $89,690 47 $46,115 112 $72,840 54 $61,160 APPLICATIONS APPROVED, NOT ACCEPTED 2 $104,025 67 $60,714 96 $99,171 24 $24,302 12 $56,548 22 $56,335 APPLICATIONS DENIED 4 $96,498 137 $62,888 580 $86,337 115 $38,596 41 $58,161 87 $53,417 APPLICATIONS WITHDRAWN 2 $89,695 61 $95,000 275 $102,412 25 $142,242 22 $148,160 21 $64,792 FILES CLOSED FOR INCOMPLETENESS 0 $0 19 $212,258 96 $97,946 0 $0 7 $61,951 5 $76,508
Aggregated Statistics For Year 2004(Based on 6 partial tracts) A) FHA, FSA/RHS & VA B) Conventional C) Refinancings D) Home Improvement Loans E) Loans on Dwellings For 5+ Families F) Non-occupant Loans on G) Loans On Manufactured Number Average Value Number Average Value Number Average Value Number Average Value Number Average Value Number Average Value Number Average Value
LOANS ORIGINATED 75 $98,561 244 $92,459 430 $88,175 42 $23,593 0 $0 116 $60,067 48 $52,072 APPLICATIONS APPROVED, NOT ACCEPTED 3 $45,370 55 $74,709 138 $76,498 11 $13,322 0 $0 16 $59,019 25 $57,900 APPLICATIONS DENIED 4 $71,802 146 $74,945 511 $81,375 76 $30,616 0 $0 36 $62,779 104 $56,971 APPLICATIONS WITHDRAWN 4 $70,328 45 $105,455 237 $87,754 9 $45,956 2 $73,545 13 $57,864 11 $72,225 FILES CLOSED FOR INCOMPLETENESS 0 $0 17 $139,027 61 $90,199 3 $50,667 0 $0 7 $72,231 0 $0
Aggregated Statistics For Year 2003(Based on 6 partial tracts) A) FHA, FSA/RHS & VA B) Conventional C) Refinancings D) Home Improvement Loans F) Non-occupant Loans on Number Average Value Number Average Value Number Average Value Number Average Value Number Average Value
LOANS ORIGINATED 45 $106,197 229 $86,248 726 $91,263 35 $26,968 117 $71,603 APPLICATIONS APPROVED, NOT ACCEPTED 1 $22,810 48 $72,411 153 $74,158 2 $63,875 10 $65,351 APPLICATIONS DENIED 11 $77,875 104 $63,606 541 $79,609 44 $17,224 36 $53,069 APPLICATIONS WITHDRAWN 0 $0 32 $82,233 197 $81,144 9 $77,771 38 $59,118 FILES CLOSED FOR INCOMPLETENESS 3 $69,080 9 $75,980 44 $71,207 2 $12,985 6 $58,528
Aggregated Statistics For Year 2002(Based on 6 partial tracts) A) FHA, FSA/RHS & VA B) Conventional C) Refinancings D) Home Improvement Loans F) Non-occupant Loans on Number Average Value Number Average Value Number Average Value Number Average Value Number Average Value
LOANS ORIGINATED 78 $80,306 181 $80,371 586 $82,515 37 $26,918 149 $58,997 APPLICATIONS APPROVED, NOT ACCEPTED 1 $66,360 38 $54,257 165 $77,765 5 $36,382 23 $57,618 APPLICATIONS DENIED 19 $81,345 127 $55,268 478 $79,765 26 $15,715 22 $63,712 APPLICATIONS WITHDRAWN 4 $75,552 25 $94,999 216 $82,611 14 $35,850 18 $50,685 FILES CLOSED FOR INCOMPLETENESS 1 $95,310 19 $90,048 64 $108,786 1 $15,210 5 $68,806
Aggregated Statistics For Year 2001(Based on 6 partial tracts) A) FHA, FSA/RHS & VA B) Conventional C) Refinancings D) Home Improvement Loans F) Non-occupant Loans on Number Average Value Number Average Value Number Average Value Number Average Value Number Average Value
LOANS ORIGINATED 74 $91,907 171 $68,846 480 $85,429 16 $21,052 65 $61,980 APPLICATIONS APPROVED, NOT ACCEPTED 0 $0 82 $50,157 118 $85,272 6 $28,855 6 $55,770 APPLICATIONS DENIED 15 $70,988 216 $54,253 639 $66,938 42 $14,290 16 $50,921 APPLICATIONS WITHDRAWN 9 $92,752 32 $73,103 262 $77,457 10 $20,060 9 $49,739 FILES CLOSED FOR INCOMPLETENESS 3 $54,113 4 $59,765 64 $76,617 0 $0 3 $53,797
Aggregated Statistics For Year 2000(Based on 6 partial tracts) A) FHA, FSA/RHS & VA B) Conventional C) Refinancings D) Home Improvement Loans F) Non-occupant Loans on Number Average Value Number Average Value Number Average Value Number Average Value Number Average Value
LOANS ORIGINATED 70 $77,028 229 $61,437 240 $63,607 50 $15,806 36 $52,156 APPLICATIONS APPROVED, NOT ACCEPTED 9 $60,864 85 $56,117 136 $63,846 23 $26,887 6 $41,592 APPLICATIONS DENIED 21 $57,496 368 $49,338 537 $61,158 75 $21,676 19 $37,293 APPLICATIONS WITHDRAWN 11 $73,349 24 $64,595 142 $60,261 7 $44,319 2 $16,590 FILES CLOSED FOR INCOMPLETENESS 3 $62,793 15 $51,615 87 $60,176 1 $34,560 0 $0
Aggregated Statistics For Year 1999(Based on 3 partial tracts) A) FHA, FSA/RHS & VA B) Conventional C) Refinancings D) Home Improvement Loans F) Non-occupant Loans on Number Average Value Number Average Value Number Average Value Number Average Value Number Average Value
LOANS ORIGINATED 39 $75,343 100 $64,289 207 $67,208 17 $13,221 16 $49,219 APPLICATIONS APPROVED, NOT ACCEPTED 1 $76,050 61 $48,200 90 $65,581 12 $17,916 5 $61,610 APPLICATIONS DENIED 10 $70,107 242 $49,810 319 $61,297 31 $12,535 15 $34,007 APPLICATIONS WITHDRAWN 1 $63,220 18 $68,332 110 $58,155 3 $16,980 3 $73,147 FILES CLOSED FOR INCOMPLETENESS 0 $0 10 $47,941 39 $61,856 0 $0 5 $51,862
Detailed HMDA statistics for the following Tracts:
0118.00
,
0119.01 ,
0119.02
Private Mortgage Insurance Companies Aggregated Statistics For Year 2009(Based on 6 partial tracts) A) Conventional B) Refinancings C) Non-occupant Loans on Number Average Value Number Average Value Number Average Value
LOANS ORIGINATED 12 $158,141 16 $157,144 0 $0 APPLICATIONS APPROVED, NOT ACCEPTED 9 $89,437 2 $68,200 6 $40,450 APPLICATIONS DENIED 4 $115,238 0 $0 0 $0 APPLICATIONS WITHDRAWN 0 $0 0 $0 0 $0 FILES CLOSED FOR INCOMPLETENESS 0 $0 1 $311,350 0 $0
Aggregated Statistics For Year 2008(Based on 6 partial tracts) A) Conventional B) Refinancings C) Non-occupant Loans on D) Loans On Manufactured Number Average Value Number Average Value Number Average Value Number Average Value
LOANS ORIGINATED 58 $121,733 37 $146,691 20 $88,293 1 $27,650 APPLICATIONS APPROVED, NOT ACCEPTED 24 $113,796 25 $127,388 7 $70,130 0 $0 APPLICATIONS DENIED 4 $33,555 6 $137,542 4 $33,555 0 $0 APPLICATIONS WITHDRAWN 4 $144,790 2 $213,225 2 $40,450 0 $0 FILES CLOSED FOR INCOMPLETENESS 1 $61,520 0 $0 0 $0 0 $0
Aggregated Statistics For Year 2007(Based on 6 partial tracts) A) Conventional B) Refinancings C) Non-occupant Loans on Number Average Value Number Average Value Number Average Value
LOANS ORIGINATED 168 $103,621 64 $113,528 22 $72,508 APPLICATIONS APPROVED, NOT ACCEPTED 20 $97,416 15 $132,119 7 $74,970 APPLICATIONS DENIED 1 $91,930 0 $0 0 $0 APPLICATIONS WITHDRAWN 10 $139,999 0 $0 0 $0 FILES CLOSED FOR INCOMPLETENESS 0 $0 0 $0 0 $0
Aggregated Statistics For Year 2006(Based on 6 partial tracts) A) Conventional B) Refinancings C) Non-occupant Loans on D) Loans On Manufactured Number Average Value Number Average Value Number Average Value Number Average Value
LOANS ORIGINATED 84 $95,699 40 $131,618 9 $73,102 2 $38,360 APPLICATIONS APPROVED, NOT ACCEPTED 11 $75,135 10 $185,497 2 $79,775 0 $0 APPLICATIONS DENIED 1 $47,000 2 $74,465 1 $47,000 0 $0 APPLICATIONS WITHDRAWN 6 $146,197 4 $220,415 1 $73,710 0 $0 FILES CLOSED FOR INCOMPLETENESS 0 $0 1 $292,280 0 $0 0 $0
Aggregated Statistics For Year 2005(Based on 6 partial tracts) A) Conventional B) Refinancings C) Non-occupant Loans on D) Loans On Manufactured Number Average Value Number Average Value Number Average Value Number Average Value
LOANS ORIGINATED 81 $106,195 41 $121,829 23 $68,430 2 $58,515 APPLICATIONS APPROVED, NOT ACCEPTED 14 $141,839 10 $154,092 3 $72,767 0 $0 APPLICATIONS DENIED 4 $104,772 1 $89,860 2 $68,775 0 $0 APPLICATIONS WITHDRAWN 15 $122,135 7 $116,786 5 $69,044 0 $0 FILES CLOSED FOR INCOMPLETENESS 0 $0 0 $0 0 $0 0 $0
Aggregated Statistics For Year 2004(Based on 6 partial tracts) A) Conventional B) Refinancings C) Non-occupant Loans on D) Loans On Manufactured Number Average Value Number Average Value Number Average Value Number Average Value
LOANS ORIGINATED 68 $93,054 50 $115,521 17 $64,874 1 $78,800 APPLICATIONS APPROVED, NOT ACCEPTED 10 $109,483 13 $81,575 2 $50,560 0 $0 APPLICATIONS DENIED 3 $122,213 1 $90,230 1 $175,370 3 $88,533 APPLICATIONS WITHDRAWN 16 $131,253 13 $117,212 2 $69,865 0 $0 FILES CLOSED FOR INCOMPLETENESS 2 $85,495 0 $0 0 $0 0 $0
Aggregated Statistics For Year 2003(Based on 6 partial tracts) A) Conventional B) Refinancings C) Non-occupant Loans on Number Average Value Number Average Value Number Average Value
LOANS ORIGINATED 94 $99,174 111 $109,799 14 $104,777 APPLICATIONS APPROVED, NOT ACCEPTED 19 $104,052 46 $118,980 2 $48,725 APPLICATIONS DENIED 6 $89,785 9 $77,126 8 $80,699 APPLICATIONS WITHDRAWN 1 $60,130 9 $131,352 2 $241,775 FILES CLOSED FOR INCOMPLETENESS 2 $65,270 3 $79,773 1 $73,270
Aggregated Statistics For Year 2002(Based on 6 partial tracts) A) Conventional B) Refinancings C) Non-occupant Loans on Number Average Value Number Average Value Number Average Value
LOANS ORIGINATED 44 $90,383 120 $95,540 13 $63,664 APPLICATIONS APPROVED, NOT ACCEPTED 8 $92,656 32 $97,232 3 $65,547 APPLICATIONS DENIED 2 $79,980 22 $89,402 1 $94,040 APPLICATIONS WITHDRAWN 2 $152,605 7 $72,113 6 $57,303 FILES CLOSED FOR INCOMPLETENESS 0 $0 8 $93,536 0 $0
Aggregated Statistics For Year 2001(Based on 6 partial tracts) A) Conventional B) Refinancings C) Non-occupant Loans on Number Average Value Number Average Value Number Average Value
LOANS ORIGINATED 63 $91,701 128 $100,006 18 $63,094 APPLICATIONS APPROVED, NOT ACCEPTED 12 $80,178 23 $118,389 4 $49,642 APPLICATIONS DENIED 4 $76,565 24 $82,980 1 $72,440 APPLICATIONS WITHDRAWN 5 $84,516 10 $111,754 1 $181,720 FILES CLOSED FOR INCOMPLETENESS 0 $0 10 $84,575 0 $0
Aggregated Statistics For Year 2000(Based on 6 partial tracts) A) Conventional B) Refinancings C) Non-occupant Loans on Number Average Value Number Average Value Number Average Value
LOANS ORIGINATED 46 $91,581 28 $92,802 4 $63,500 APPLICATIONS APPROVED, NOT ACCEPTED 3 $146,727 8 $100,766 0 $0 APPLICATIONS DENIED 2 $74,510 3 $70,530 0 $0 APPLICATIONS WITHDRAWN 1 $88,960 1 $109,900 0 $0 FILES CLOSED FOR INCOMPLETENESS 0 $0 0 $0 0 $0
Aggregated Statistics For Year 1999(Based on 3 partial tracts) A) Conventional B) Refinancings C) Non-occupant Loans on Number Average Value Number Average Value Number Average Value
LOANS ORIGINATED 20 $112,260 17 $100,535 3 $53,450 APPLICATIONS APPROVED, NOT ACCEPTED 2 $95,265 3 $80,427 0 $0 APPLICATIONS DENIED 1 $219,450 2 $50,285 0 $0 APPLICATIONS WITHDRAWN 0 $0 2 $67,805 0 $0 FILES CLOSED FOR INCOMPLETENESS 0 $0 1 $80,820 0 $0
Detailed PMIC statistics for the following Tracts:
0118.00
,
0119.01 ,
0119.02
2002 - 2018 National Fire Incident Reporting System (NFIRS) incidents See full 2006 National Fire Incident Reporting System statistics for zip code 29061, South Carolina
Most common first names in zip code 29061 among deceased individuals Name Count Lived (average)
James 60 71.8 years John 53 68.7 years William 48 72.0 years Mary 38 72.1 years Robert 36 66.6 years Willie 29 68.7 years George 21 70.7 years Joseph 21 67.0 years Annie 21 76.3 years Rosa 18 79.1 years
Most common last names in zip code 29061 among deceased individuals Last name Count Lived (average)
Jones 53 72.9 years Davis 37 70.1 years Johnson 36 74.1 years Anderson 34 67.4 years Sumter 28 68.0 years Smith 24 74.5 years Goodwin 23 64.7 years Williams 23 72.1 years Adams 21 71.6 years Brown 21 72.6 years
Businesses in zip code 29061
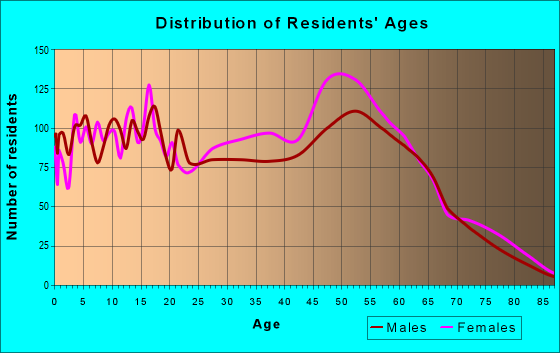
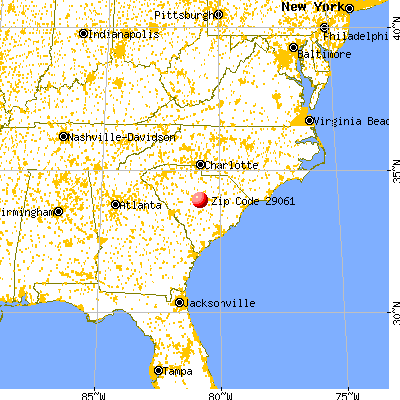

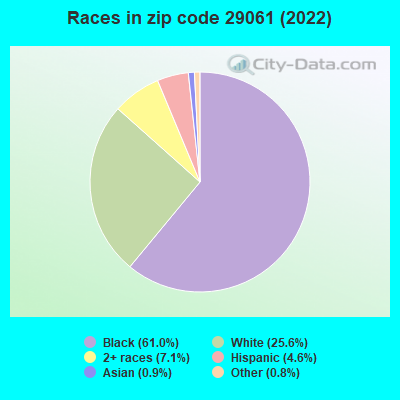


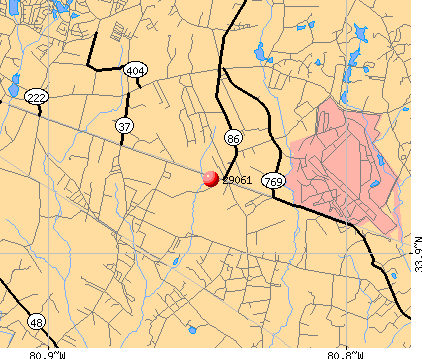 Nearest zip codes: 29209, 29207, 29052, 29044, 29206, 29205.
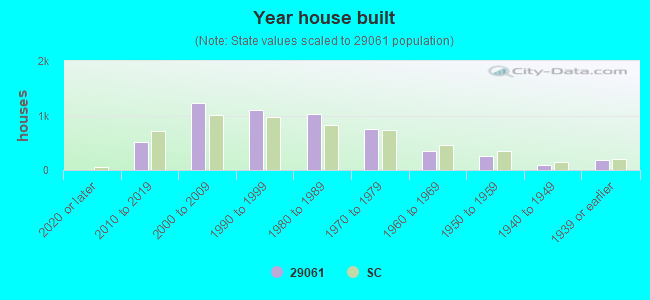
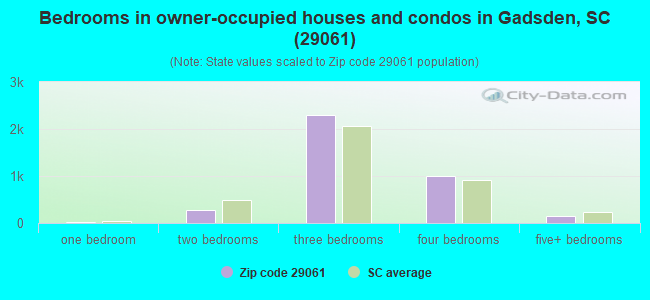
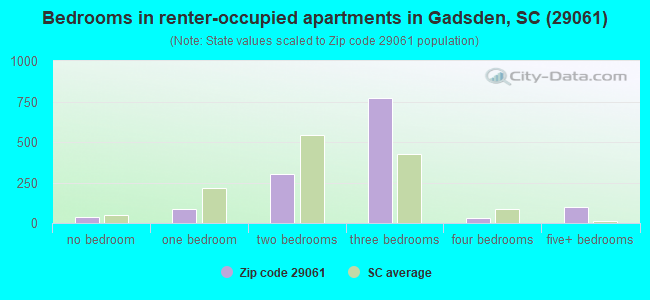
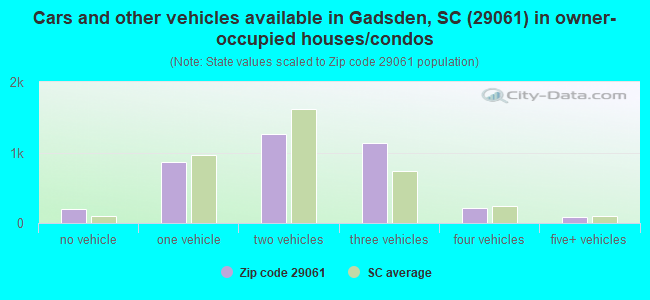
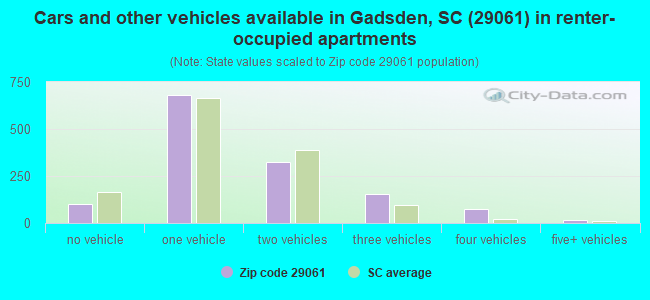


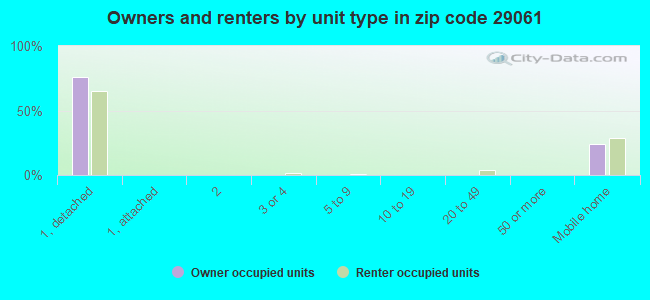
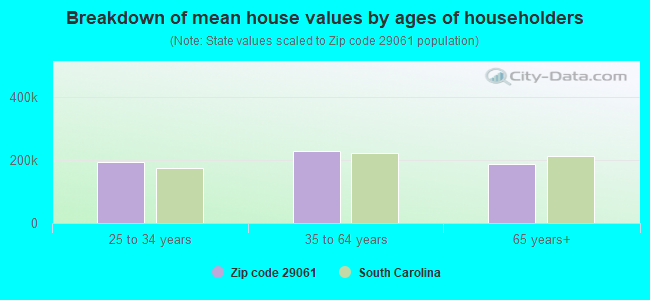


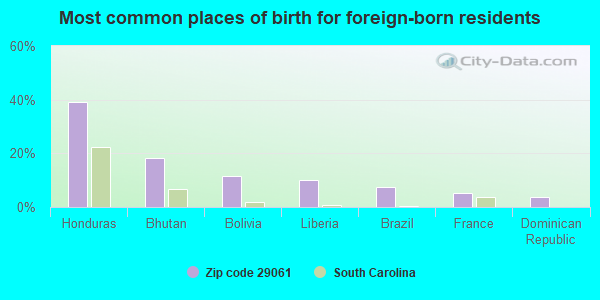
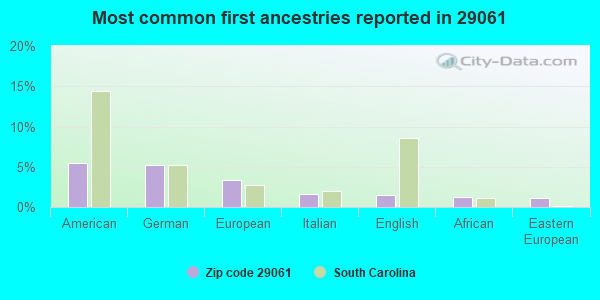
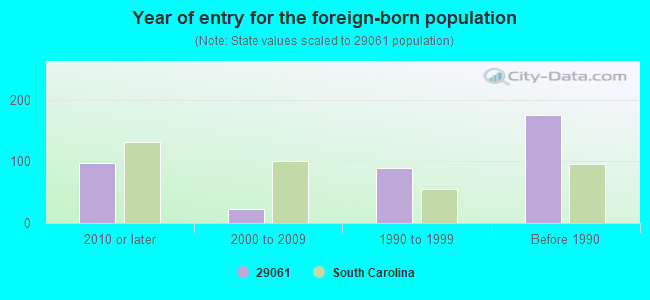

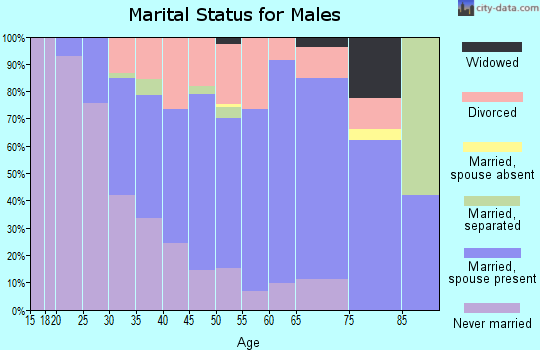
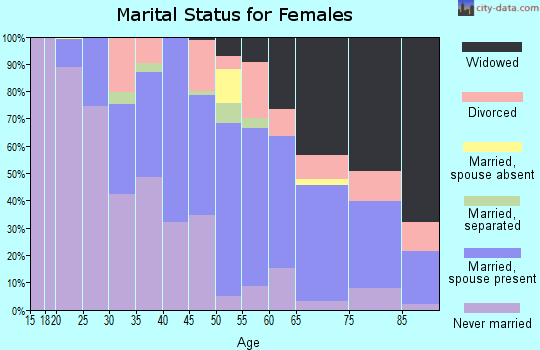
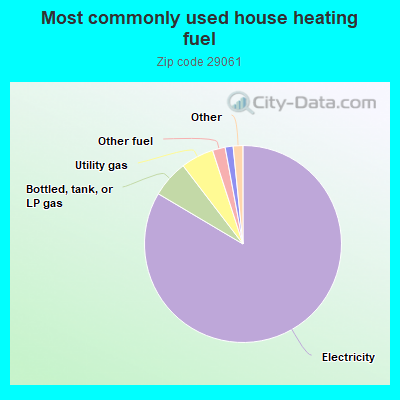
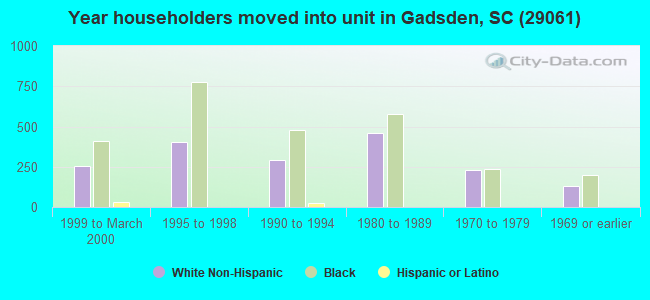
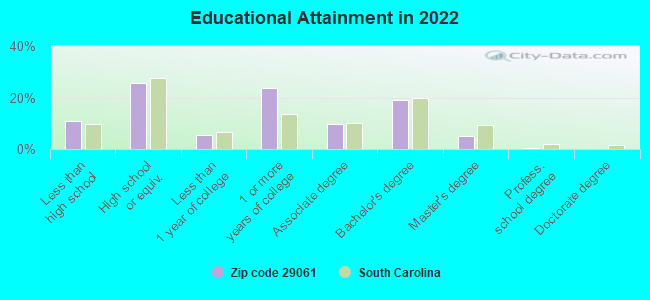
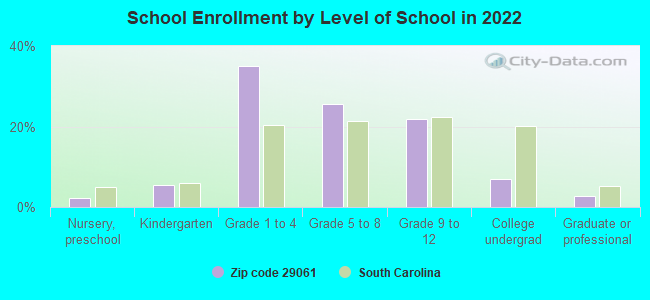
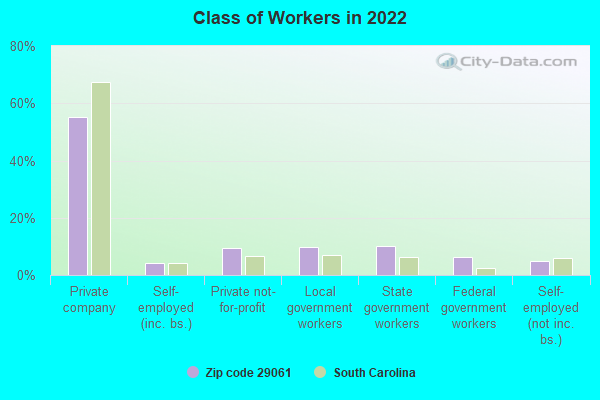
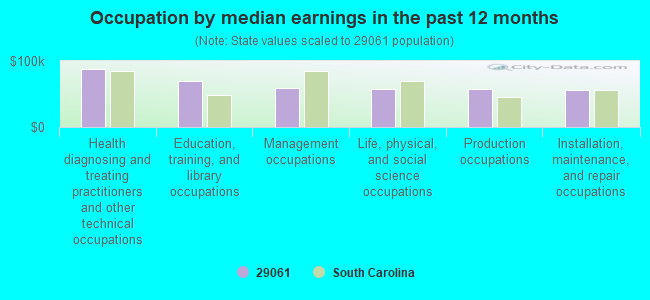
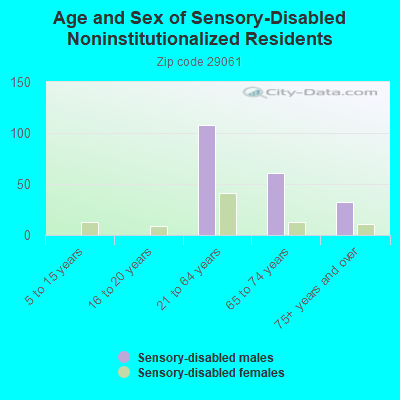
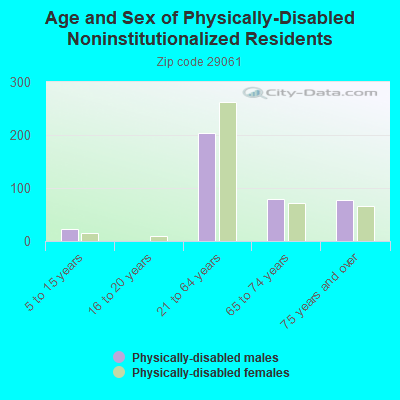
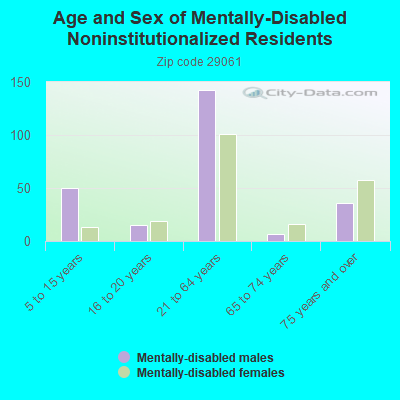
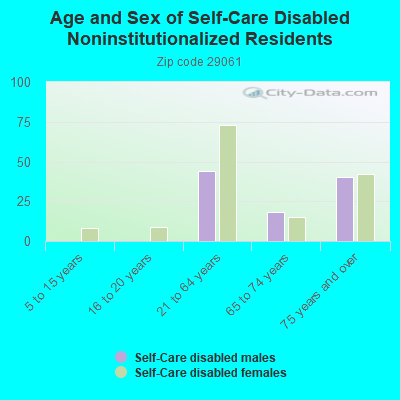
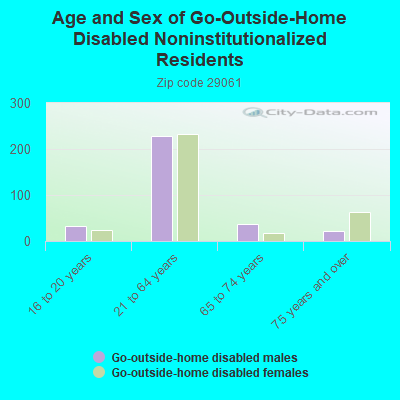
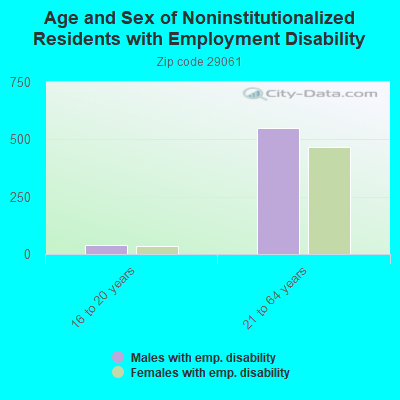
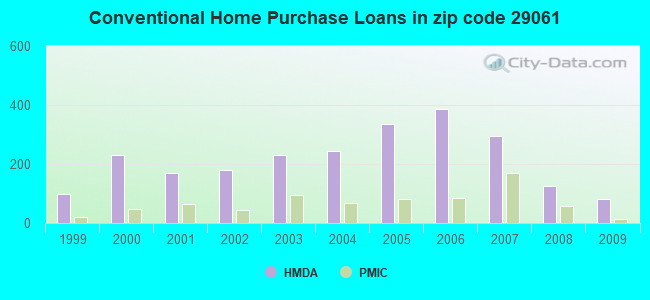
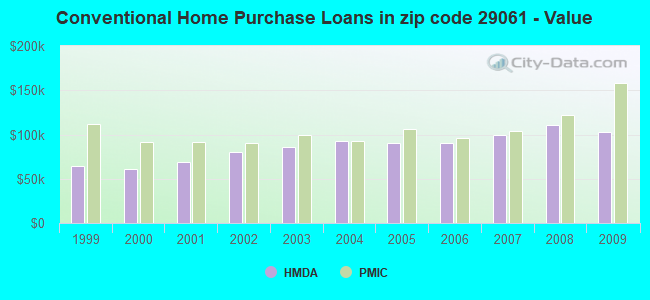
 According to the data from the years 2002 - 2018 the average number of fires per year is 95. The highest number of fire incidents - 143 took place in 2007, and the least - 45 in 2012. The data has a declining trend.
 When looking into fire subcategories, the most reports belonged to: Outside Fires (50.8%), and Structure Fires (19.4%).