Races in Cincinnati, Ohio (OH) Detailed Stats
Data:
Races - White alone (%)
Races - White alone (% change since 2000)
Races - Black alone (%)
Races - Black alone (% change since 2000)
Races - American Indian alone (%)
Races - American Indian alone (% change since 2000)
Races - Asian alone (%)
Races - Asian alone (% change since 2000)
Races - Hispanic (%)
Races - Hispanic (% change since 2000)
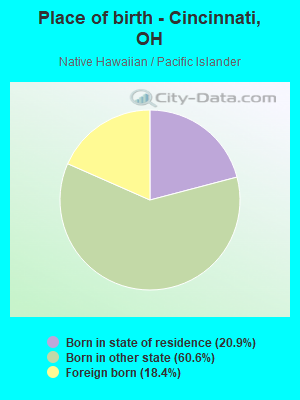
Races - Native Hawaiian and Other Pacific Islander alone (%)
Races - Native Hawaiian and Other Pacific Islander alone (% change since 2000)
Races - Two or more races(%)
Races - Two or more races(% change since 2000)
Races - Other race alone (%)
Races - Other race alone (% change since 2000)
Racial diversity
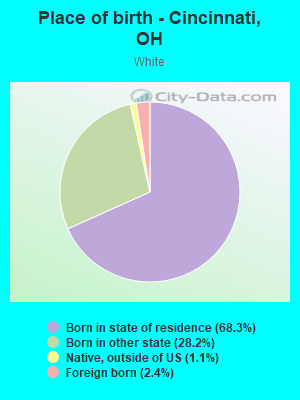
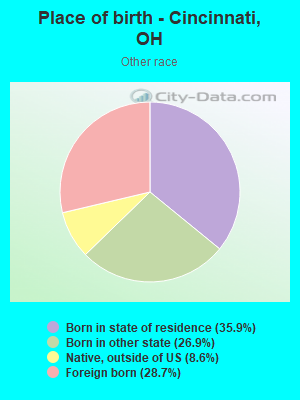
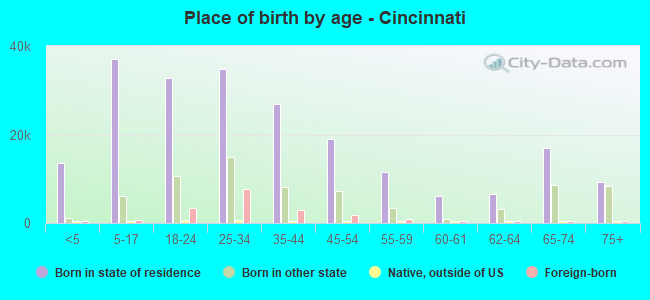
Place of birth - Born in state of residence (%)
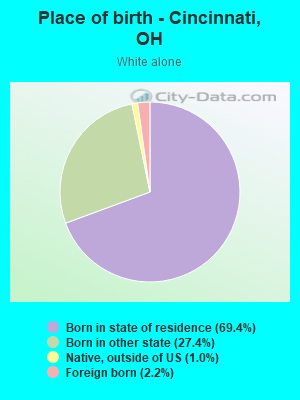
Place of birth - Born in state of residence (%) - White
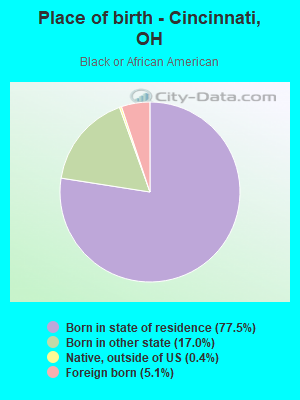
Place of birth - Born in state of residence (%) - Black or African American
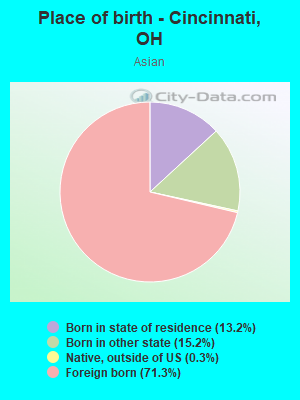
Place of birth - Born in state of residence (%) - Asian
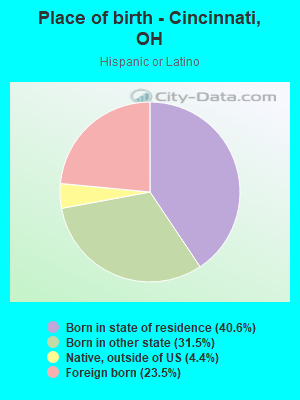
Place of birth - Born in state of residence (%) - Hispanic or Latino
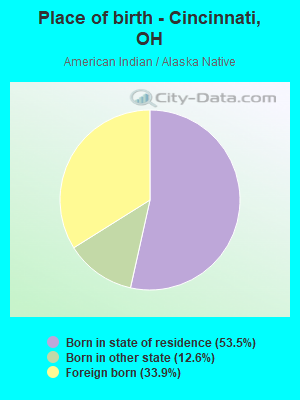
Place of birth - Born in state of residence (%) - American Indian and Alaska Native
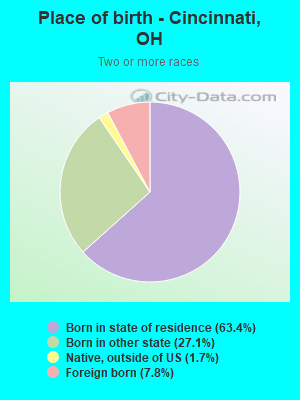
Place of birth - Born in state of residence (%) - Multirace
Place of birth - Born in state of residence (%) - Other Race
Place of birth - Born in other state (%)
Place of birth - Born in other state (%) - White
Place of birth - Born in other state (%) - Black or African American
Place of birth - Born in other state (%) - Asian
Place of birth - Born in other state (%) - Hispanic or Latino
Place of birth - Born in other state (%) - American Indian and Alaska Native
Place of birth - Born in other state (%) - Multirace
Place of birth - Born in other state (%) - Other Race
Place of birth - Native, outside of US (%)
Place of birth - Native, outside of US (%) - White
Place of birth - Native, outside of US (%) - Black or African American
Place of birth - Native, outside of US (%) - Asian
Place of birth - Native, outside of US (%) - Hispanic or Latino
Place of birth - Native, outside of US (%) - American Indian and Alaska Native
Place of birth - Native, outside of US (%) - Multirace
Place of birth - Native, outside of US (%) - Other Race
Place of birth - Foreign born (%)
Place of birth - Foreign born (%) - White
Place of birth - Foreign born (%) - Black or African American
Place of birth - Foreign born (%) - Asian
Place of birth - Foreign born (%) - Hispanic or Latino
Place of birth - Foreign born (%) - American Indian and Alaska Native
Place of birth - Foreign born (%) - Multirace
Place of birth - Foreign born (%) - Other Race
Residents speaking English at home (%)
Residents speaking English at home - Born in the United States (%)
Residents speaking English at home - Native, born elsewhere (%)
Residents speaking English at home - Foreign born (%)
Residents speaking Spanish at home (%)
Residents speaking Spanish at home - Born in the United States (%)
Residents speaking Spanish at home - Native, born elsewhere (%)
Residents speaking Spanish at home - Foreign born (%)
Residents speaking other language at home (%)
Residents speaking other language at home - Born in the United States (%)
Residents speaking other language at home - Native, born elsewhere (%)
Residents speaking other language at home - Foreign born (%)
Marital status - Never married (%)
Marital status - Now married (%)
Marital status - Separated (%)
Marital status - Widowed (%)
Marital status - Divorced (%)
Ancestries Reported - Arab (%)
Ancestries Reported - Czech (%)
Ancestries Reported - Danish (%)
Ancestries Reported - Dutch (%)
Ancestries Reported - English (%)
Ancestries Reported - French (%)
Ancestries Reported - French Canadian (%)
Ancestries Reported - German (%)
Ancestries Reported - Greek (%)
Ancestries Reported - Hungarian (%)
Ancestries Reported - Irish (%)
Ancestries Reported - Italian (%)
Ancestries Reported - Lithuanian (%)
Ancestries Reported - Norwegian (%)
Ancestries Reported - Polish (%)
Ancestries Reported - Portuguese (%)
Ancestries Reported - Russian (%)
Ancestries Reported - Scotch-Irish (%)
Ancestries Reported - Scottish (%)
Ancestries Reported - Slovak (%)
Ancestries Reported - Subsaharan African (%)
Ancestries Reported - Swedish (%)
Ancestries Reported - Swiss (%)
Ancestries Reported - Ukrainian (%)
Ancestries Reported - United States (%)
Ancestries Reported - Welsh (%)
Ancestries Reported - West Indian (%)
Ancestries Reported - Other (%)
Geographical mobility - Same house 1 year ago (%)
Geographical mobility - Same house 1 year ago (%) - White
Geographical mobility - Same house 1 year ago (%) - Black or African American
Geographical mobility - Same house 1 year ago (%) - Asian
Geographical mobility - Same house 1 year ago (%) - Hispanic or Latino
Geographical mobility - Same house 1 year ago (%) - American Indian and Alaska Native
Geographical mobility - Same house 1 year ago (%) - Multirace
Geographical mobility - Same house 1 year ago (%) - Other Race
Geographical mobility - Moved within same county (%)
Geographical mobility - Moved within same county (%) - White
Geographical mobility - Moved within same county (%) - Black or African American
Geographical mobility - Moved within same county (%) - Asian
Geographical mobility - Moved within same county (%) - Hispanic or Latino
Geographical mobility - Moved within same county (%) - American Indian and Alaska Native
Geographical mobility - Moved within same county (%) - Multirace
Geographical mobility - Moved within same county (%) - Other Race
Geographical mobility - Moved from different county within same state (%)
Geographical mobility - Moved from different county within same state (%) - White
Geographical mobility - Moved from different county within same state (%) - Black or African American
Geographical mobility - Moved from different county within same state (%) - Asian
Geographical mobility - Moved from different county within same state (%) - Hispanic or Latino
Geographical mobility - Moved from different county within same state (%) - American Indian and Alaska Native
Geographical mobility - Moved from different county within same state (%) - Multirace
Geographical mobility - Moved from different county within same state (%) - Other Race
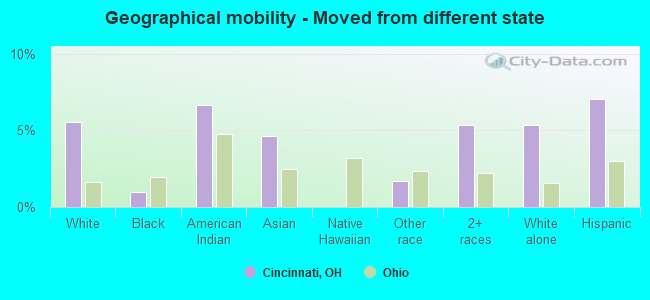
Geographical mobility - Moved from different state (%)
Geographical mobility - Moved from different state (%) - White
Geographical mobility - Moved from different state (%) - Black or African American
Geographical mobility - Moved from different state (%) - Asian
Geographical mobility - Moved from different state (%) - Hispanic or Latino
Geographical mobility - Moved from different state (%) - American Indian and Alaska Native
Geographical mobility - Moved from different state (%) - Multirace
Geographical mobility - Moved from different state (%) - Other Race
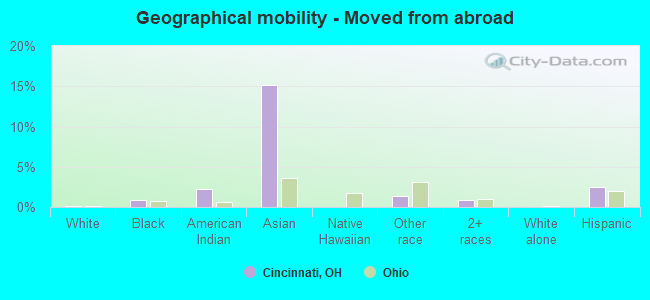
Geographical mobility - Moved from abroad (%)
Geographical mobility - Moved from abroad (%) - White
Geographical mobility - Moved from abroad (%) - Black or African American
Geographical mobility - Moved from abroad (%) - Asian
Geographical mobility - Moved from abroad (%) - Hispanic or Latino
Geographical mobility - Moved from abroad (%) - American Indian and Alaska Native
Geographical mobility - Moved from abroad (%) - Multirace
Geographical mobility - Moved from abroad (%) - Other Race
Place of birth for the foreign-born population - Ireland (%)
Place of birth for the foreign-born population - Denmark (%)
Place of birth for the foreign-born population - Norway (%)
Place of birth for the foreign-born population - Sweden (%)
Place of birth for the foreign-born population - United Kingdom (%)
Place of birth for the foreign-born population - England (%)
Place of birth for the foreign-born population - Scotland (%)
Place of birth for the foreign-born population - Other Northern Europe (%)
Place of birth for the foreign-born population - Austria (%)
Place of birth for the foreign-born population - Belgium (%)
Place of birth for the foreign-born population - France (%)
Place of birth for the foreign-born population - Germany (%)
Place of birth for the foreign-born population - Netherlands (%)
Place of birth for the foreign-born population - Switzerland (%)
Place of birth for the foreign-born population - Other Western Europe (%)
Place of birth for the foreign-born population - Greece (%)
Place of birth for the foreign-born population - Italy (%)
Place of birth for the foreign-born population - Portugal (%)
Place of birth for the foreign-born population - Spain (%)
Place of birth for the foreign-born population - Other Southern Europe (%)
Place of birth for the foreign-born population - Albania (%)
Place of birth for the foreign-born population - Belarus (%)
Place of birth for the foreign-born population - Bosnia and Herzegovina (%)
Place of birth for the foreign-born population - Bulgaria (%)
Place of birth for the foreign-born population - Croatia (%)
Place of birth for the foreign-born population - Czechoslovakia (%)
Place of birth for the foreign-born population - Hungary (%)
Place of birth for the foreign-born population - Latvia (%)
Place of birth for the foreign-born population - Lithuania (%)
Place of birth for the foreign-born population - North Macedonia (Macedonia) (%)
Place of birth for the foreign-born population - Moldova (%)
Place of birth for the foreign-born population - Poland (%)
Place of birth for the foreign-born population - Romania (%)
Place of birth for the foreign-born population - Russia (%)
Place of birth for the foreign-born population - Serbia (%)
Place of birth for the foreign-born population - Ukraine (%)
Place of birth for the foreign-born population - Other Eastern Europe (%)
Place of birth for the foreign-born population - China (%)
Place of birth for the foreign-born population - Hong Kong (%)
Place of birth for the foreign-born population - Taiwan (%)
Place of birth for the foreign-born population - Japan (%)
Place of birth for the foreign-born population - Korea (%)
Place of birth for the foreign-born population - Other Eastern Asia (%)
Place of birth for the foreign-born population - Afghanistan (%)
Place of birth for the foreign-born population - Bangladesh (%)
Place of birth for the foreign-born population - India (%)
Place of birth for the foreign-born population - Iran (%)
Place of birth for the foreign-born population - Kazakhstan (%)
Place of birth for the foreign-born population - Nepal (%)
Place of birth for the foreign-born population - Pakistan (%)
Place of birth for the foreign-born population - Sri Lanka (%)
Place of birth for the foreign-born population - Uzbekistan (%)
Place of birth for the foreign-born population - Other South Central Asia (%)
Place of birth for the foreign-born population - Burma (%)
Place of birth for the foreign-born population - Cambodia (%)
Place of birth for the foreign-born population - Indonesia (%)
Place of birth for the foreign-born population - Laos (%)
Place of birth for the foreign-born population - Malaysia (%)
Place of birth for the foreign-born population - Philippines (%)
Place of birth for the foreign-born population - Singapore (%)
Place of birth for the foreign-born population - Thailand (%)
Place of birth for the foreign-born population - Vietnam (%)
Place of birth for the foreign-born population - Other South Eastern Asia (%)
Place of birth for the foreign-born population - Armenia (%)
Place of birth for the foreign-born population - Iraq (%)
Place of birth for the foreign-born population - Israel (%)
Place of birth for the foreign-born population - Jordan (%)
Place of birth for the foreign-born population - Kuwait (%)
Place of birth for the foreign-born population - Lebanon (%)
Place of birth for the foreign-born population - Saudi Arabia (%)
Place of birth for the foreign-born population - Syria (%)
Place of birth for the foreign-born population - Turkey (%)
Place of birth for the foreign-born population - Yemen (%)
Place of birth for the foreign-born population - Other Western Asia (%)
Place of birth for the foreign-born population - Eritrea (%)
Place of birth for the foreign-born population - Ethiopia (%)
Place of birth for the foreign-born population - Kenya (%)
Place of birth for the foreign-born population - Somalia (%)
Place of birth for the foreign-born population - Uganda (%)
Place of birth for the foreign-born population - Zimbabwe (%)
Place of birth for the foreign-born population - Other Eastern Africa (%)
Place of birth for the foreign-born population - Cameroon (%)
Place of birth for the foreign-born population - Congo (%)
Place of birth for the foreign-born population - Democratic Republic of Congo (Zaire) (%)
Place of birth for the foreign-born population - Other Middle Africa (%)
Place of birth for the foreign-born population - Egypt (%)
Place of birth for the foreign-born population - Morocco (%)
Place of birth for the foreign-born population - Sudan (%)
Place of birth for the foreign-born population - Other Northern Africa (%)
Place of birth for the foreign-born population - South Africa (%)
Place of birth for the foreign-born population - Other Southern Africa (%)
Place of birth for the foreign-born population - Cabo Verde (%)
Place of birth for the foreign-born population - Ghana (%)
Place of birth for the foreign-born population - Liberia (%)
Place of birth for the foreign-born population - Nigeria (%)
Place of birth for the foreign-born population - Senegal (%)
Place of birth for the foreign-born population - Sierra Leone (%)
Place of birth for the foreign-born population - Other Western Africa (%)
Place of birth for the foreign-born population - Australia (%)
Place of birth for the foreign-born population - New Zealand (%)
Place of birth for the foreign-born population - Fiji (%)
Place of birth for the foreign-born population - Micronesia (%)
Place of birth for the foreign-born population - Bahamas (%)
Place of birth for the foreign-born population - Barbados (%)
Place of birth for the foreign-born population - Cuba (%)
Place of birth for the foreign-born population - Dominica (%)
Place of birth for the foreign-born population - Dominican Republic (%)
Place of birth for the foreign-born population - Grenada (%)
Place of birth for the foreign-born population - Haiti (%)
Place of birth for the foreign-born population - Jamaica (%)
Place of birth for the foreign-born population - St. Vincent and the Grenadines (%)
Place of birth for the foreign-born population - Trinidad and Tobago (%)
Place of birth for the foreign-born population - West Indies (%)
Place of birth for the foreign-born population - Other Caribbean (%)
Place of birth for the foreign-born population - Belize (%)
Place of birth for the foreign-born population - Costa Rica (%)
Place of birth for the foreign-born population - El Salvador (%)
Place of birth for the foreign-born population - Guatemala (%)
Place of birth for the foreign-born population - Honduras (%)
Place of birth for the foreign-born population - Mexico (%)
Place of birth for the foreign-born population - Nicaragua (%)
Place of birth for the foreign-born population - Panama (%)
Place of birth for the foreign-born population - Other Central America (%)
Place of birth for the foreign-born population - Argentina (%)
Place of birth for the foreign-born population - Bolivia (%)
Place of birth for the foreign-born population - Brazil (%)
Place of birth for the foreign-born population - Chile (%)
Place of birth for the foreign-born population - Colombia (%)
Place of birth for the foreign-born population - Ecuador (%)
Place of birth for the foreign-born population - Guyana (%)
Place of birth for the foreign-born population - Peru (%)
Place of birth for the foreign-born population - Uruguay (%)
Place of birth for the foreign-born population - Venezuela (%)
Place of birth for the foreign-born population - Other South America (%)
Place of birth for the foreign-born population - Canada (%)
Place of birth for the foreign-born population - Other Northern America (%)
Place of birth for the foreign-born population - Other (%)
Latest news about races in Cincinnati, OH collected exclusively by city-data.com from local newspapers, TV, and radio stations
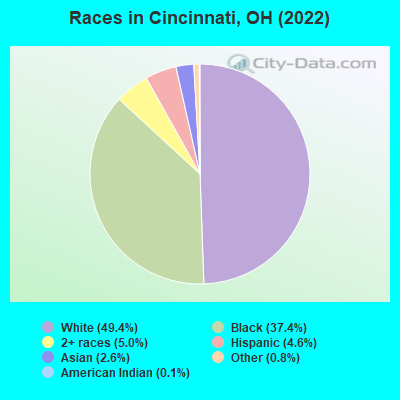
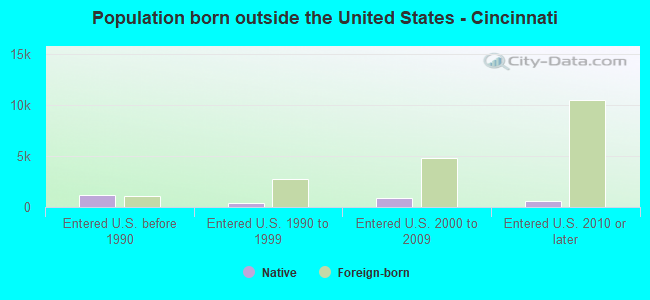
According to 2022 data, the most numerous races in Cincinnati, OH are White alone (152,799 residents), Black alone (115,732 residents), and Two or more races (15,620 residents). 91.9% of Cincinnati residents speak English at home. 7.0% of Cincinnati, OH residents are foreign-born (2.2% born in Africa, 2.0% born in Asia, 1.6% born in Latin America, 0.8% born in Europe), which is 42.4% greater than the foreign-born rate of 4.0% across the entire state of Ohio.
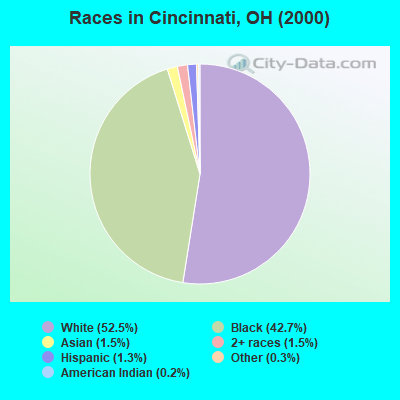
Race distribution in Cincinnati
2000 2022
173,781 52.5% White alone 141,534 42.7% Black alone 5,052 1.5% Two or more races 5,099 1.5% Asian alone 4,230 1.3% Hispanic 838 0.3% Other race alone 641 0.2% American Indian alone 110 0.03% Native Hawaiian and Other
152,799 49.4% White alone 115,732 37.4% Black alone 15,620 5.0% Two or more races 14,365 4.6% Hispanic 8,197 2.6% Asian alone 2,435 0.8% Other race alone 314 0.1% American Indian alone 74 0.02% Native Hawaiian and Other
2000 2022
9,538,111 84.0% White alone 1,290,662 11.4% Black alone 217,123 1.9% Hispanic 137,770 1.2% Two or more races 131,670 1.2% Asian alone 21,985 0.2% American Indian alone 13,483 0.1% Other race alone 2,336 0.02% Native Hawaiian and Other
8,948,793 76.1% White alone 1,401,403 11.9% Black alone 529,291 4.5% Two or more races 517,232 4.4% Hispanic 293,387 2.5% Asian alone 52,805 0.4% Other race alone 9,785 0.08% American Indian alone 3,362 0.03% Native Hawaiian and Other
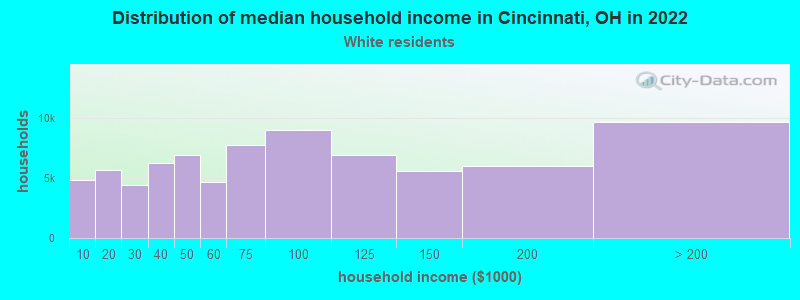
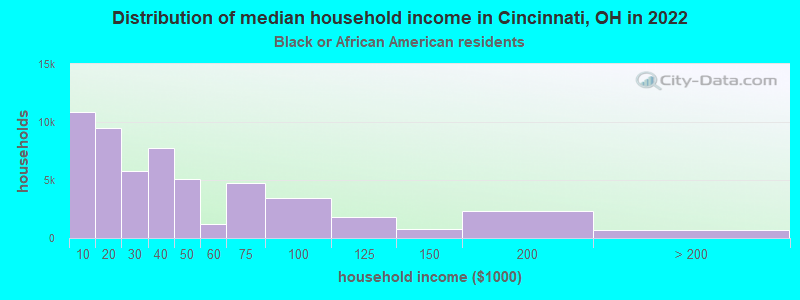
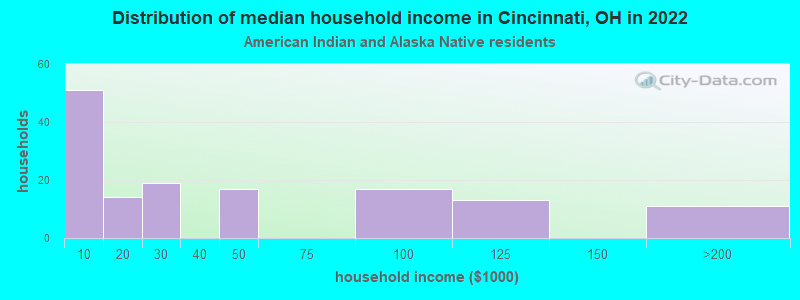
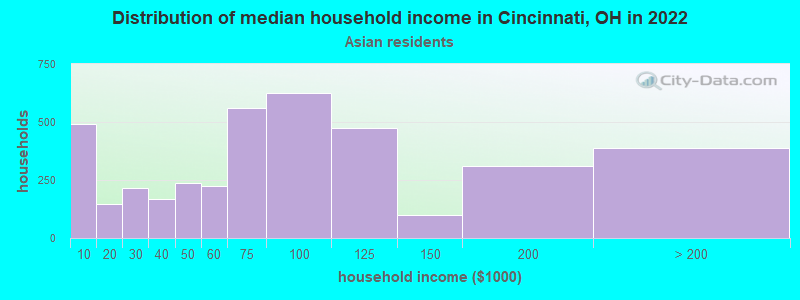
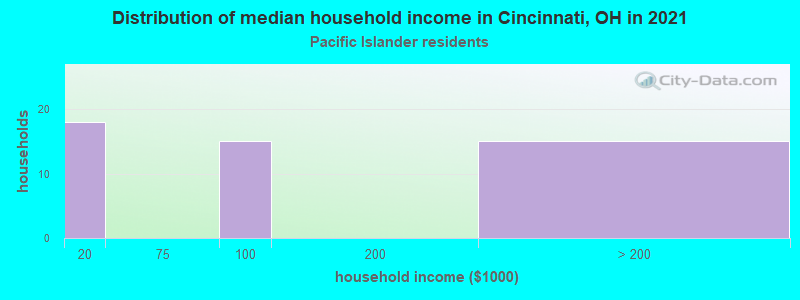
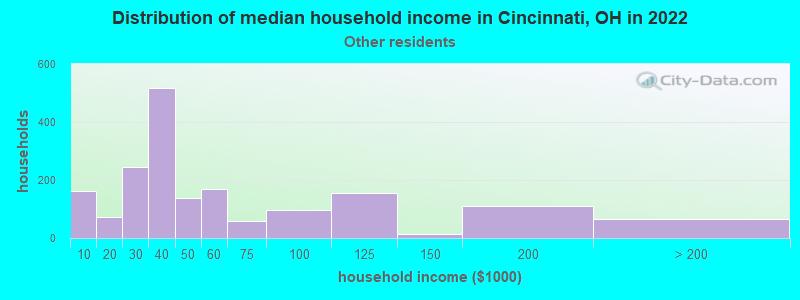
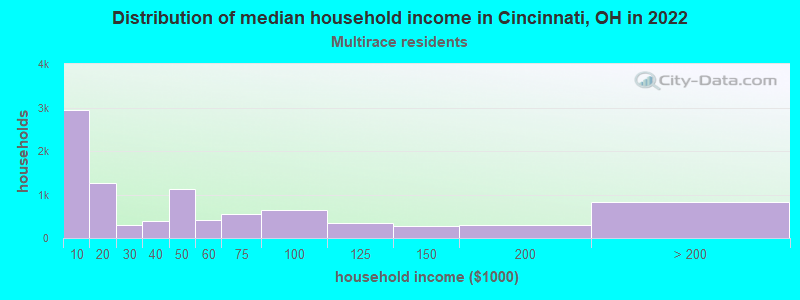
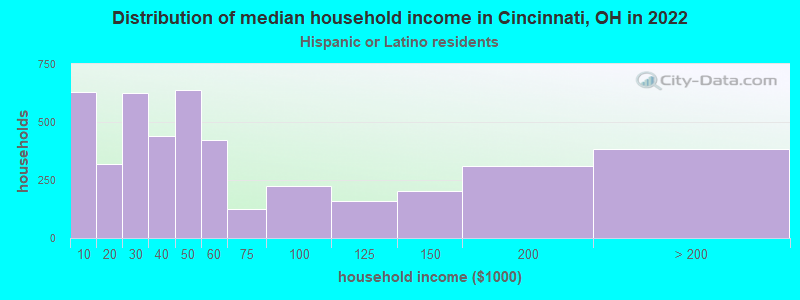
Income and house value in Cincinnati Median household income in 2022 $71,905 White non-Hispanic householders$30,850 Black householders$60,050 Asian householders$38,423 Some other race householders$35,625 Two or more races householders$40,319 Hispanic or Latino race householdersMedian 2022 house value $243,198 White Non-Hispanic householders$194,314 Black or African American householders$201,646 American Indian or Alaska Native householders $318,724 Asian householders$158,873 Native Hawaiian and other Pacific Islander householders$249,797 Some other race householders$208,246 Two or more races householders$276,439 Hispanic or Latino householders
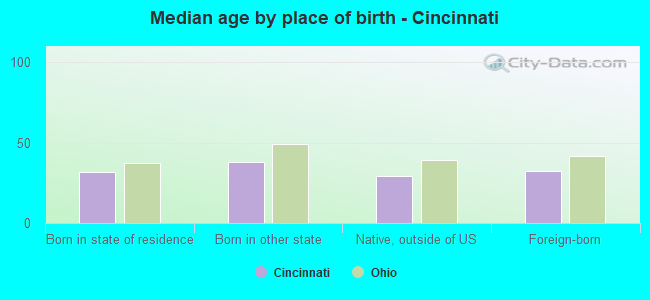
Median age by race in Cincinnati
34.8 Median age for White residents34.2 35.8 33.8 Median age for Black or African American residents31.4 35.9 26.4 Median age for American Indian / Alaska Native residents29.3 29.3 25.4 Median age for Asian residents27.2 24.8 -666,666,666.0 Median age for Native Hawaiian / Pacific Islander residents-666,666,666.0 -666,666,666.0 23.0 Median age for Other race residents23.4 22.6 26.3 Median age for Two or more races residents31.3 22.3 35.2 Median age for White alone residents34.6 36.1 23.1 Median age for Hispanic or Latino residents23.3 22.9
Owner/renter occupied households by race in Cincinnati
House owners and renters - White residents 41,307 53.4% Owner occupied36,092 46.6% Renter occupiedHouse owners and renters - Black or African American residents 12,292 22.8% Owner occupied41,664 77.2% Renter occupiedHouse owners and renters - American Indian / Alaska Native residents 25 19.3% Owner occupied106 80.7% Renter occupiedHouse owners and renters - Asian residents 909 29.2% Owner occupied2,199 70.8% Renter occupiedHouse owners and renters - Native Hawaiian / Pacific Islander residents 22 56.9% Owner occupied17 43.1% Renter occupiedHouse owners and renters - Other race residents 480 28.3% Owner occupied1,218 71.7% Renter occupiedHouse owners and renters - Two or more races residents 3,345 35.7% Owner occupied6,024 64.3% Renter occupiedHouse owners and renters - White alone residents 40,974 53.6% Owner occupied35,539 46.4% Renter occupiedHouse owners and renters - Hispanic or Latino residents 1,725 38.4% Owner occupied2,765 61.6% Renter occupied
Language usage in Cincinnati
English speakers - Total 91.9% of residents of Cincinnati speak English at home.
2.7% of residents speak Spanish at home 5,008 62.1% Speak English very well3,061 37.9% Speak English less than very well5.4% of residents speak other language at home 10,874 68.6% Speak English very well4,976 31.4% Speak English less than very well
English speakers - Born in the United States 95.7% of residents of Cincinnati speak English at home.
2.9% of residents speak Spanish at home 1,990 97.1% Speak English very well60 2.9% Speak English less than very well1.5% of residents speak other language at home 938 88.2% Speak English very well126 11.8% Speak English less than very well
English speakers - Native, born elsewhere 73.3% of residents of Cincinnati speak English at home.
19.8% of residents speak Spanish at home 499 82.5% Speak English very well106 17.5% Speak English less than very well6.9% of residents speak other language at home 211 100.0% Speak English very well
English speakers - Foreign-born 25.4% of residents of Cincinnati speak English at home.
13.4% of residents speak Spanish at home 675 26.3% Speak English very well1,893 73.7% Speak English less than very well61.2% of residents speak other language at home 7,205 61.5% Speak English very well4,510 38.5% Speak English less than very well
White (Caucasian) - Speak only English Native:
97.6% (143,447)Foreign-born:
50.6% (1,921)
White (Caucasian) - Speak another language Native:
2.4% (3,490)Foreign-born:
49.4% (1,877)
Black or African American - Speak only English Native:
98.2% (103,853)Foreign-born:
26.1% (1,557)
Black or African American - Speak another language Native:
1.8% (1,890)Foreign-born:
73.9% (4,406)
American Indian / Alaska Native - Speak only English Native:
76.4% (252)Foreign-born:
24.1% (36)
American Indian / Alaska Native - Speak another language Native:
20.4% (67)Foreign-born:
76.9% (116)
Asian - Speak only English Native:
69.5% (1,317)Foreign-born:
12.7% (751)
Asian - Speak another language Native:
30.5% (578)Foreign-born:
87.3% (5,181)
Native Hawaiian / Pacific Islander - Speak another language Native:
24.4% (14)Foreign-born:
100.0% (7)
Other race - Speak only English Native:
61.2% (2,030)Foreign-born:
12.4% (202)
Other race - Speak another language Native:
38.8% (1,286)Foreign-born:
87.6% (1,432)
Two or more races - Speak only English Native:
86.6% (15,019)Foreign-born:
18.6% (317)
Two or more races - Speak another language Native:
13.4% (2,332)Foreign-born:
81.4% (1,387)
White alone - Speak only English Native:
98.0% (141,126)Foreign-born:
57.3% (1,921)
White alone - Speak another language Native:
2.0% (2,913)Foreign-born:
42.7% (1,429)
Hispanic or Latino - Speak only English Native:
61.3% (5,711)Foreign-born:
7.4% (251)
Hispanic or Latino - Speak another language Native:
38.7% (3,598)Foreign-born:
92.6% (3,121)
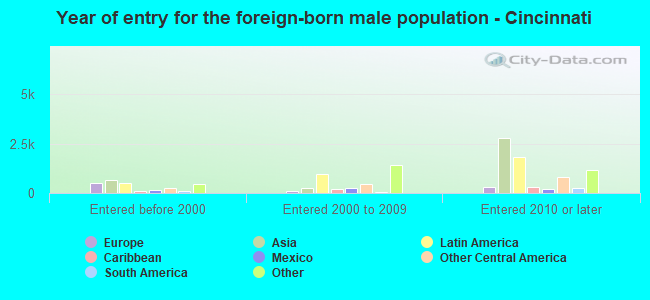
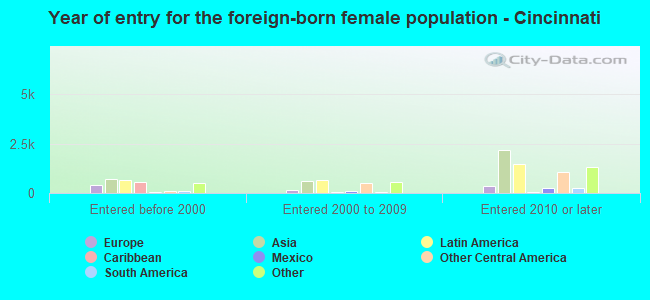
Foreign-born residents in Cincinnati 21,399 residents are foreign born (2.2% Africa , 2.0% Asia , 1.6% Latin America , 0.8% Europe ).
Marital status for residents in Cincinnati Marital status - White (Caucasian) population 15 years and over
Males 53.6% Never married36.6% Now married0.7% Separated2.6% Widowed6.5% DivorcedFemales 47.9% Never married33.7% Now married1.5% Separated5.8% Widowed11.1% DivorcedWomen who gave birth in the past 12 months Now married:
63.4% (1,070)Unmarried:
36.6% (617)
Women who did not give birth in the past 12 months Now married:
28.4% (12,890)Unmarried:
71.6% (32,421)
Marital status - Black or African American population 15 years and over
Males 65.7% Never married20.9% Now married2.8% Separated3.6% Widowed7.0% DivorcedFemales 63.7% Never married14.9% Now married3.9% Separated5.9% Widowed11.6% DivorcedWomen who gave birth in the past 12 months Now married:
48.9% (877)Unmarried:
51.1% (918)
Women who did not give birth in the past 12 months Now married:
11.8% (3,563)Unmarried:
88.2% (26,611)
Marital status - American Indian / Alaska Native population 15 years and over
Males 57.4% Never married36.8% Now married0.0% Separated4.9% Widowed1.0% DivorcedFemales 70.7% Never married15.4% Now married4.9% Separated0.0% Widowed8.9% DivorcedWomen who gave birth in the past 12 months Now married:
100.0% (11)Unmarried:
0.0% (0)
Women who did not give birth in the past 12 months Now married:
2.5% (2)Unmarried:
97.5% (94)
Marital status - Asian population 15 years and over
Males 61.0% Never married34.4% Now married1.2% Separated0.3% Widowed3.2% DivorcedFemales 57.1% Never married38.1% Now married0.7% Separated1.3% Widowed2.7% DivorcedWomen who gave birth in the past 12 months Now married:
74.5% (38)Unmarried:
25.5% (13)
Women who did not give birth in the past 12 months Now married:
34.5% (1,118)Unmarried:
65.5% (2,121)
Marital status - Native Hawaiian / Pacific Islander population 15 years and over
Males 0.0% Never married100.0% Now married0.0% Separated0.0% Widowed0.0% DivorcedFemales 13.0% Never married63.0% Now married0.0% Separated24.1% Widowed0.0% DivorcedWomen who did not give birth in the past 12 months Now married:
69.6% (17)Unmarried:
30.4% (7)
Marital status - Other race population 15 years and over
Males 53.8% Never married41.6% Now married0.3% Separated0.0% Widowed4.3% DivorcedFemales 60.9% Never married28.8% Now married4.5% Separated1.2% Widowed4.6% DivorcedWomen who gave birth in the past 12 months Now married:
40.5% (22)Unmarried:
59.5% (33)
Women who did not give birth in the past 12 months Now married:
22.0% (337)Unmarried:
78.0% (1,196)
Marital status - Two or more races population 15 years and over
Males 63.2% Never married22.1% Now married0.0% Separated2.7% Widowed12.1% DivorcedFemales 61.7% Never married26.0% Now married0.0% Separated2.8% Widowed9.4% DivorcedWomen who gave birth in the past 12 months Now married:
100.0% (354)Unmarried:
0.0% (0)
Women who did not give birth in the past 12 months Now married:
23.1% (1,472)Unmarried:
76.9% (4,890)
Marital status - White alone, not Hispanic / Latino population 15 years and over
Males 53.6% Never married36.5% Now married0.7% Separated2.7% Widowed6.5% DivorcedFemales 47.4% Never married33.9% Now married1.5% Separated5.9% Widowed11.3% DivorcedWomen who gave birth in the past 12 months Now married:
61.9% (1,004)Unmarried:
38.1% (617)
Women who did not give birth in the past 12 months Now married:
28.9% (12,845)Unmarried:
71.1% (31,535)
Marital status - Hispanic or Latino population 15 years and over
Males 55.0% Never married36.4% Now married0.0% Separated2.1% Widowed6.5% DivorcedFemales 64.9% Never married30.4% Now married0.2% Separated0.8% Widowed3.7% DivorcedWomen who gave birth in the past 12 months Now married:
100.0% (287)Unmarried:
0.0% (0)
Women who did not give birth in the past 12 months Now married:
23.9% (996)Unmarried:
76.1% (3,169)
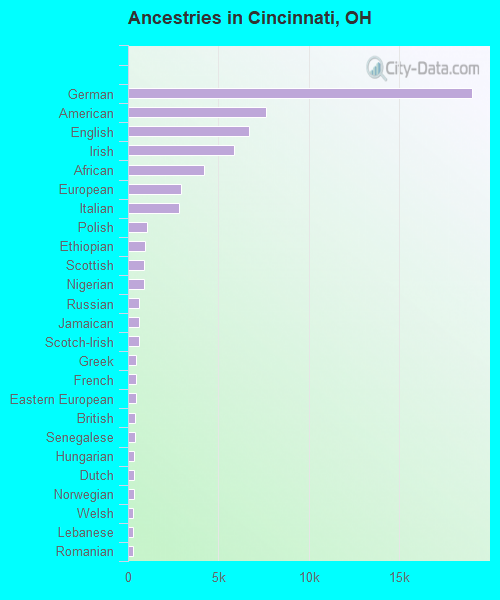
Ancestries in Cincinnati
19,018 11.4% German7,629 4.6% American6,675 4.0% English5,878 3.5% Irish4,217 2.5% African2,937 1.8% European2,798 1.7% Italian1,065 0.6% Polish966 0.6% Ethiopian884 0.5% Scottish878 0.5% Nigerian628 0.4% Russian609 0.4% Jamaican594 0.4% Scotch-Irish467 0.3% Greek465 0.3% French463 0.3% Eastern European401 0.2% British383 0.2% Senegalese343 0.2% Hungarian319 0.2% Dutch308 0.2% Norwegian270 0.2% Welsh255 0.2% Lebanese252 0.2% Romanian251 0.2% Ukrainian203 0.1% Egyptian202 0.1% Haitian200 0.1% Ghanaian193 0.1% French Canadian192 0.1% Ugandan186 0.1% Iranian185 0.1% Slovak169 0.1% Northern European151 0.09% Turkish142 0.09% Canadian141 0.08% Lithuanian140 0.08% Kenyan133 0.08% Afghan121 0.07% Brazilian118 0.07% Slovene117 0.07% Croatian116 0.07% Swedish99 0.06% Finnish93 0.06% Portuguese88 0.05% Bulgarian87 0.05% Scandinavian81 0.05% Sudanese73 0.04% Albanian71 0.04% Moroccan69 0.04% Danish65 0.04% Armenian56 0.03% Slavic55 0.03% Arab47 0.03% Czech44 0.03% South African40 0.02% Zimbabwean39 0.02% Belgian36 0.02% Serbian35 0.02% Macedonian35 0.02% Jordanian34 0.02% Sierra Leonean33 0.02% Swiss29 0.02% Palestinian27 0.02% Czechoslovakian26 0.02% Austrian23 0.01% Yugoslavian21 0.01% Celtic20 0.01% Cajun19 0.01% Barbadian17 0.01% Australian16 0.01% Guyanese16 0.01% Icelander14 0.01% Israeli12 0.01% Alsatian9 0.01% Luxembourger
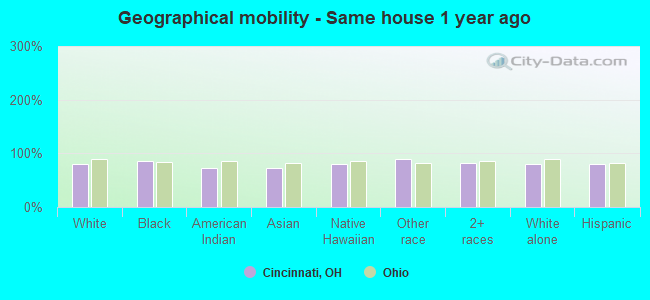
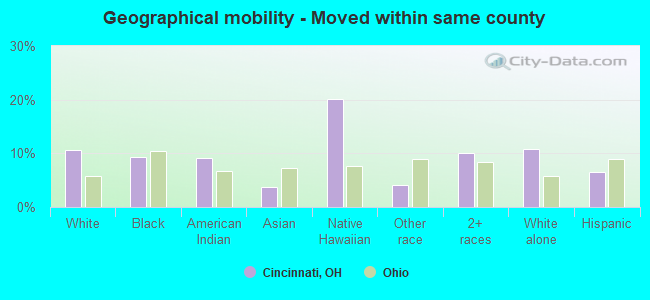
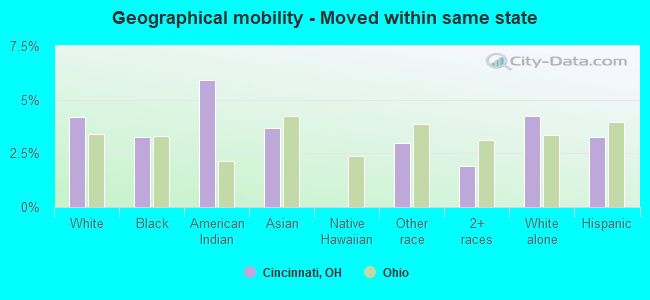
Geographical mobility in Cincinnati Same house 1 year ago 123,350 79.6% White (Caucasian)98,674 85.5% Black or African American333 72.0% American Indian / Alaska Native6,046 72.7% Asian52 79.5% Native Hawaiian / Pacific Islander5,217 89.7% Other race17,442 81.8% Two or more races120,837 79.7% White alone, not Hispanic / Latino11,211 80.7% Hispanic or LatinoMoved within same county 16,514 10.7% White / Caucasian10,843 9.4% Black or African American43 9.2% American Indian / Alaska Native317 3.8% Asian13 20.2% Native Hawaiian / Pacific Islander240 4.1% Other race2,148 10.1% Two or more races16,331 10.8% White alone, not Hispanic / Latino912 6.6% Hispanic or LatinoMoved within same state 6,476 4.2% White / Caucasian3,743 3.2% Black or African American27 5.9% American Indian / Alaska Native308 3.7% Asian172 3.0% Other race405 1.9% Two or more races6,393 4.2% White alone, not Hispanic / Latino453 3.3% Hispanic or LatinoMoved from different state 8,562 5.5% White / Caucasian1,141 1.0% Black or African American31 6.7% American Indian / Alaska Native383 4.6% Asian98 1.7% Other race1,134 5.3% Two or more races8,077 5.3% White alone, not Hispanic / Latino975 7.0% Hispanic or LatinoMoved from abroad 134 0.1% White970 0.8% Black or African American10 2.2% American Indian / Alaska Native1,264 15.2% Asian77 1.3% Other race196 0.9% Two or more races346 2.5% Hispanic or Latino
Children Nativity (place of birth) in Cincinnati
Children under 6 years - Living with two parents Both parents native 5,924 100.0% NativeBoth parents foreign-born 1,397 100.0% NativeOne native, one foreign-born parent 907 100.0% NativeChildren under 6 years - Living with one parent Native parent 8,683 100.0% NativeForeign-born parent 382 100.0% NativeChildren 6 to 17 years - Living with two parents Both parents native 12,203 99.4% Native75 0.6% Foreign-bornBoth parents foreign-born 1,609 74.9% Native540 25.1% Foreign-bornOne native, one foreign-born parent 1,494 100.0% NativeChildren 6 to 17 years - Living with one parent Native parent 20,114 100.0% NativeForeign-born parent 889 55.4% Native717 44.6% Foreign-born
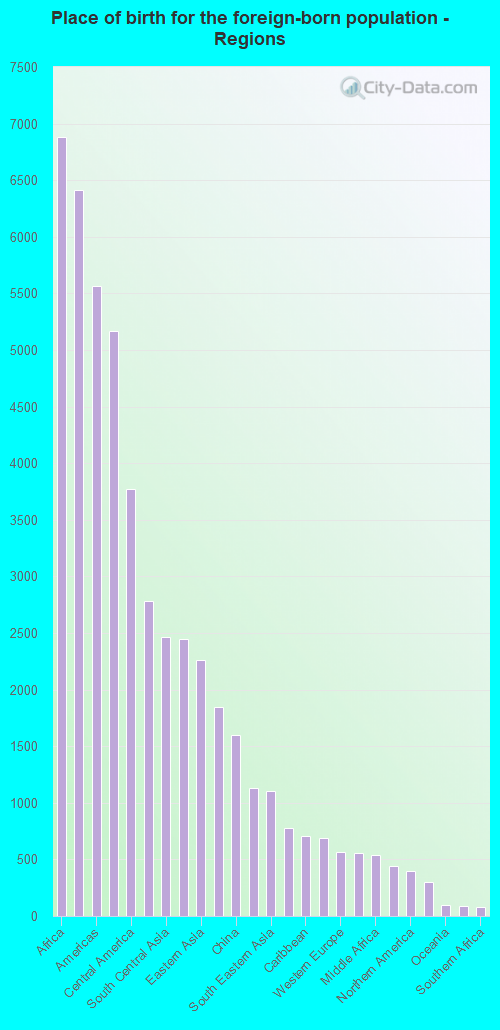
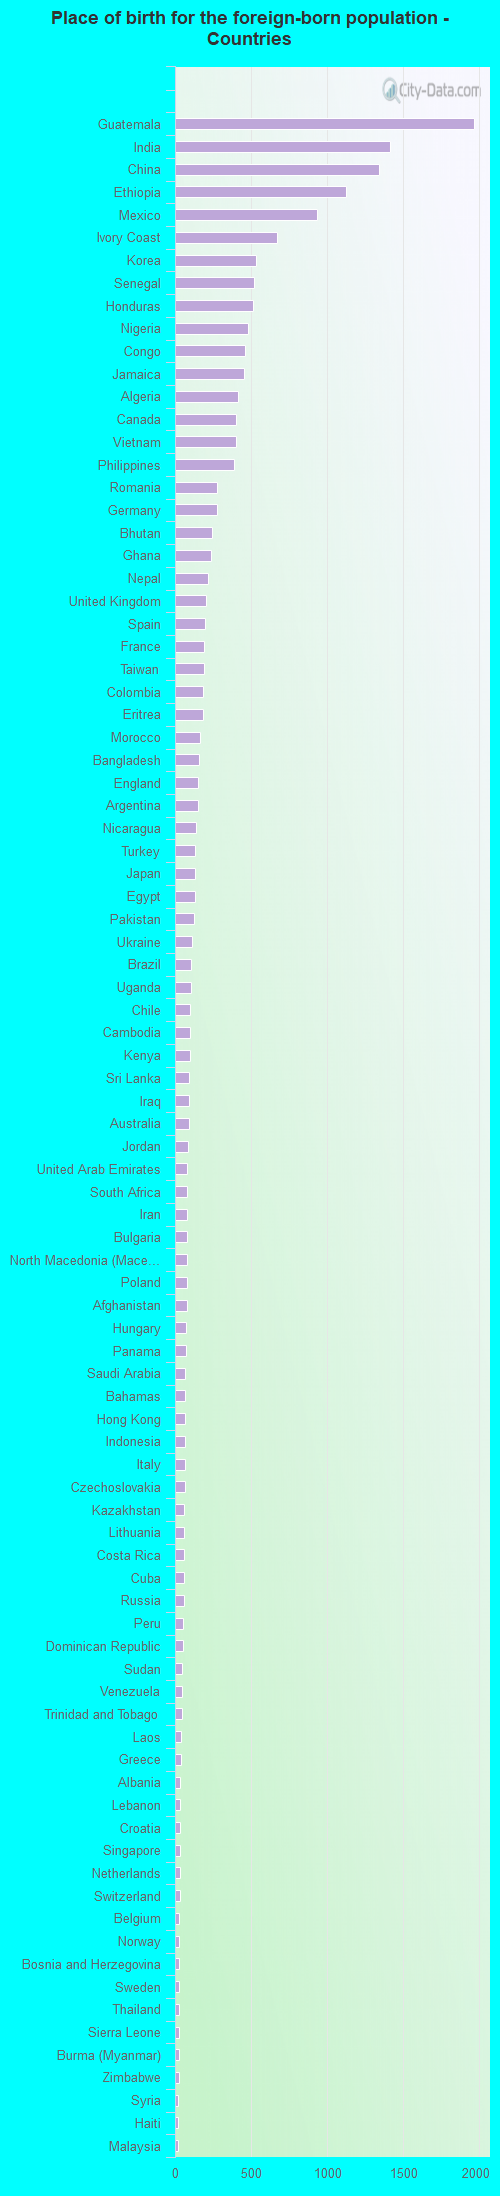
Place of birth for residents in Cincinnati 6,879 Africa6,411 Asia5,568 Americas5,169 Latin America3,775 Central America2,781 Western Africa2,461 South Central Asia2,443 Europe2,263 Eastern Asia1,850 Eastern Africa1,600 China1,127 Eastern Europe1,105 South Eastern Asia776 Northern Africa705 Caribbean689 South America568 Western Europe559 Western Asia541 Middle Africa445 Northern Europe399 Northern America303 Southern Europe96 Oceania89 Australia and New Zealand Subregion80 Southern Africa1,967 Guatemala1,411 India1,343 China1,126 Ethiopia933 Mexico670 Ivory Coast532 Korea521 Senegal510 Honduras481 Nigeria458 Congo452 Jamaica416 Algeria399 Canada399 Vietnam389 Philippines276 Romania273 Germany245 Bhutan236 Ghana216 Nepal205 United Kingdom196 Spain191 France189 Taiwan183 Colombia182 Eritrea162 Morocco155 Bangladesh153 England149 Argentina141 Nicaragua134 Turkey131 Japan129 Egypt122 Pakistan114 Ukraine107 Brazil105 Uganda101 Chile99 Cambodia98 Kenya93 Sri Lanka91 Iraq89 Australia84 Jordan81 United Arab Emirates80 South Africa79 Iran78 Bulgaria78 North Macedonia (Macedonia)77 Poland76 Afghanistan74 Hungary70 Panama69 Saudi Arabia68 Bahamas67 Hong Kong65 Indonesia65 Italy64 Czechoslovakia59 Kazakhstan58 Lithuania58 Costa Rica57 Cuba57 Russia55 Peru51 Dominican Republic49 Sudan46 Venezuela44 Trinidad and Tobago41 Laos40 Greece36 Albania36 Lebanon34 Croatia34 Singapore31 Netherlands30 Switzerland28 Belgium28 Norway27 Bosnia and Herzegovina27 Sweden26 Thailand26 Sierra Leone26 Burma (Myanmar)24 Zimbabwe23 Syria22 Haiti22 Malaysia17 Ireland17 Israel12 Austria12 Ecuador12 Uruguay12 Scotland10 El Salvador10 Belarus10 Tanzania9 Liberia9 Dominica9 Moldova8 Guyana
Grandparents responsible for own grandchildren in Cincinnati
Grandparents (30 to 59 years) White / Caucasian 533 80.7% Responsible for grandchildren128 19.3% Not responsible for grandchildrenBlack or African American 643 63.7% Responsible for grandchildren366 36.3% Not responsible for grandchildrenOther race 6 8.5% Responsible for grandchildren63 91.5% Not responsible for grandchildrenTwo or more races 70 64.5% Responsible for grandchildren39 35.5% Not responsible for grandchildrenWhite alone, not Hispanic / Latino 368 76.3% Responsible for grandchildren114 23.7% Not responsible for grandchildrenHispanic or Latino 65 100.0% Not responsible for grandchildrenGrandparents (60 years and over) White / Caucasian 305 51.2% Responsible for grandchildren291 48.8% Not responsible for grandchildrenBlack or African American 401 39.5% Responsible for grandchildren613 60.5% Not responsible for grandchildrenOther race 5 100.0% Responsible for grandchildrenTwo or more races 45 76.6% Responsible for grandchildren14 23.4% Not responsible for grandchildrenWhite alone, not Hispanic / Latino 305 51.0% Responsible for grandchildren293 49.0% Not responsible for grandchildren
Zip codes: 45202 , 45203 , 45204 , 45205 , 45206 , 45207 , 45208 , 45209 , 45212 , 45214 , 45216 , 45217 , 45219 , 45220 , 45223 , 45224 , 45225 , 45226 , 45227 , 45229 , 45230 , 45231 , 45232 , 45239 , 45243 .