Estimated zip code population in 2022: 8,885 Zip code population in 2010: 9,570 Zip code population in 2000: 9,856
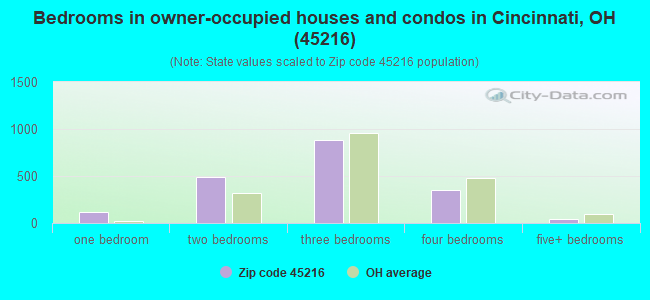
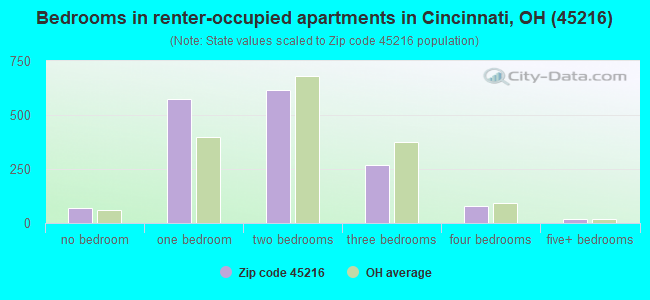
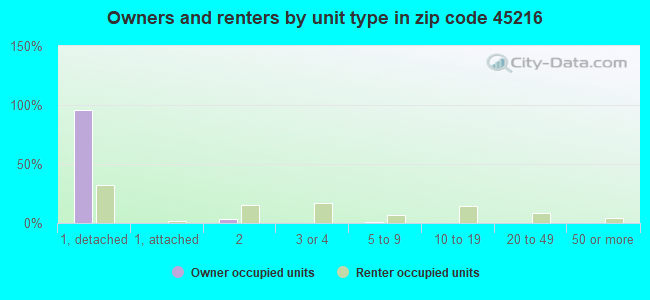
Houses and condos: 4,164 Renter-occupied apartments: 1,614
% of renters here:
46%
State:
33%
March 2022 cost of living index in zip code 45216: 87.5 (less than average, U.S. average is 100)
Land area: 3.0 sq. mi. Water area: 0.0 sq. mi.
Population density: 2,947 people per square mile
(average).
OSM Map
General Map
Google Map
MSN Map
OSM Map
General Map
Google Map
MSN Map
OSM Map
General Map
Google Map
MSN Map
OSM Map
General Map
Google Map
MSN Map
Please wait while loading the map...
Real estate property taxes paid for housing units in 2022:
This zip code:
1.4% ($1,601)
Ohio:
1.3% ($2,639)
Median real estate property taxes paid for housing units with mortgages in 2022: $1,772 (1.5%) Median real estate property taxes paid for housing units with no mortgage in 2022: $1,371 (1.3%)
Business Search- 14 Million verified businesses
Males: 4,300
(48.4%)
Females: 4,585
(51.6%)
For population 25 years and over in 45216:
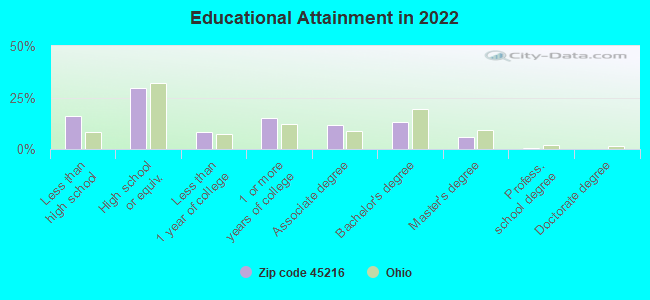
High school or higher: 82.4%
Bachelor's degree or higher: 19.2%
Graduate or professional degree: 6.4%
Unemployed: 2.5%
Mean travel time to work (commute): 24.0 minutes
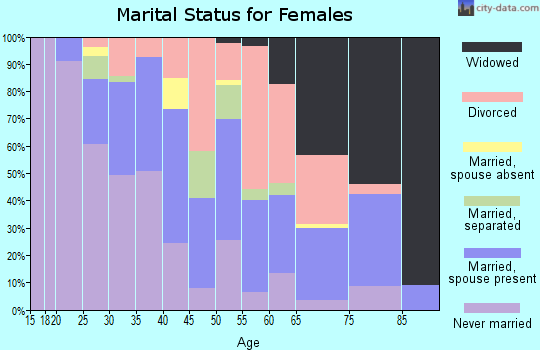
For population 15 years and over in 45216:
Never married: 47.7%
Now married: 33.5%
Separated: 2.7%
Widowed: 6.0%
Divorced: 10.1%
Zip code 45216 compared to state average:
Median household income below state average.
Median house value below state average.
Black race population percentage above state average.
Hispanic race population percentage above state average.
Foreign-born population percentage above state average.
Length of stay since moving in significantly above state average.
House age above state average.
Number of college students below state average.
Percentage of population with a bachelor's degree or higher below state average.
Averages for the 2020 tax year for zip code 45216, filed in 2021:
Average Adjusted Gross Income (AGI) in 2020: $37,834 (Individual Income Tax Returns)
Here:
$37,834
State:
$67,288
Salary/wage: $34,270 (reported on 85.7% of returns)
Here:
$34,270
State:
$55,628
(% of AGI for various income ranges: 1237.1% for AGIs below $25k, 3789.8% for AGIs $25k-50k, 6759.0% for AGIs $50k-75k, 10655.7% for AGIs $75k-100k, 18092.7% for AGIs $100k-200k)
Taxable interest for individuals: $452 (reported on 12.6% of returns)
This zip code:
$452
Ohio:
$1,518
(% of AGI for various income ranges: 4.7% for AGIs below $25k, 2.2% for AGIs $25k-50k, 16.3% for AGIs $50k-75k, 32.1% for AGIs $75k-100k, 34.5% for AGIs $100k-200k)
Ordinary dividends: $4,231 (reported on 8.5% of returns)
Here:
$4,231
State:
$7,167
(% of AGI for various income ranges: 12.2% for AGIs below $25k, 10.5% for AGIs $25k-50k, 45.9% for AGIs $50k-75k, 179.3% for AGIs $75k-100k, 695.5% for AGIs $100k-200k)
Net capital gain/loss in AGI: +$6,077 (reported on 6.3% of returns)
Here:
+$6,077
State:
+$18,919
(% of AGI for various income ranges: 3.6% for AGIs below $25k, 10.0% for AGIs $25k-50k, 41.0% for AGIs $50k-75k, 159.3% for AGIs $75k-100k, 936.4% for AGIs $100k-200k)
Profit/loss from business: +$7,828 (reported on 13.1% of returns)
Here:
+$7,828
State:
+$13,744
(% of AGI for various income ranges: 112.6% for AGIs below $25k, 127.4% for AGIs $25k-50k, 111.2% for AGIs $50k-75k, 230.7% for AGIs $75k-100k, 505.5% for AGIs $100k-200k)
Taxable individual retirement arrangement distribution: $13,005 (reported on 5.3% of returns)
45216:
$13,005
Ohio:
$18,876
(% of AGI for various income ranges: 32.1% for AGIs below $25k, 33.5% for AGIs $25k-50k, 122.4% for AGIs $50k-75k, 301.4% for AGIs $75k-100k, 1040.0% for AGIs $100k-200k)
Total itemized deductions: $22,444 (reported on 2.2% of returns)
Here:
$22,444
State:
$33,869
(% of AGI for various income ranges: 59.6% for AGIs $25k-50k, 494.3% for AGIs $75k-100k, 594.5% for AGIs $100k-200k)
Charity contributions: $8,700 (reported on 1.5% of returns)
Here:
$8,700
State:
$14,577
(% of AGI for various income ranges: 6.9% for AGIs $25k-50k, 143.6% for AGIs $75k-100k, 220.9% for AGIs $100k-200k)
Taxes paid: $5,000 (reported on 2.2% of returns)
45216:
$5,000
State:
$7,681
(% of AGI for various income ranges: 9.4% for AGIs $25k-50k, 100.7% for AGIs $75k-100k, 184.5% for AGIs $100k-200k)
Earned income credit: $2,482 (reported on 26.2% of returns)
Here:
$2,482
State:
$2,304
(% of AGI for various income ranges: 132.1% for AGIs below $25k, 86.5% for AGIs $25k-50k)
Percentage of individuals using paid preparers for their 2020 taxes: 92.3%
Here:
92%
State:
94%
(% for various income ranges: 92.4% for AGIs below $25k, 93.7% for AGIs $25k-50k, 92.7% for AGIs $50k-75k, 87.0% for AGIs $75k-100k, 94.7% for AGIs $100k-200k, 0.0% for AGIs over 200k)
Averages for the 2012 tax year for zip code 45216, filed in 2013:
Average Adjusted Gross Income (AGI) in 2012: $32,043 (Individual Income Tax Returns)
Here:
$32,043
State:
$54,926
Salary/wage: $29,359 (reported on 86.4% of returns)
Here:
$29,359
State:
$45,869
(% of AGI for various income ranges: 80.2% for AGIs below $25k, 84.9% for AGIs $25k-50k, 81.9% for AGIs $50k-75k, 76.3% for AGIs $75k-100k, 60.8% for AGIs $100k-200k)
Taxable interest for individuals: $652 (reported on 16.0% of returns)
This zip code:
$652
Ohio:
$1,297
(% of AGI for various income ranges: 0.5% for AGIs below $25k, 0.3% for AGIs $25k-50k, 0.2% for AGIs $50k-75k, 0.4% for AGIs $75k-100k, 0.3% for AGIs $100k-200k)
Ordinary dividends: $3,911 (reported on 11.0% of returns)
Here:
$3,911
State:
$5,821
(% of AGI for various income ranges: 0.6% for AGIs below $25k, 0.8% for AGIs $25k-50k, 0.6% for AGIs $50k-75k, 3.2% for AGIs $75k-100k, 3.3% for AGIs $100k-200k)
Net capital gain/loss in AGI: +$3,879 (reported on 5.7% of returns)
Here:
+$3,879
State:
+$11,232
(% of AGI for various income ranges: 0.2% for AGIs below $25k, 0.3% for AGIs $25k-50k, 0.5% for AGIs $50k-75k, 0.4% for AGIs $75k-100k, 3.2% for AGIs $100k-200k)
Profit/loss from business: +$7,568 (reported on 11.2% of returns)
Here:
+$7,568
State:
+$12,773
(% of AGI for various income ranges: 7.8% for AGIs below $25k, 1.3% for AGIs $25k-50k, 1.9% for AGIs $50k-75k, 0.8% for AGIs $75k-100k, 0.6% for AGIs $100k-200k)
Taxable individual retirement arrangement distribution: $13,668 (reported on 6.7% of returns)
45216:
$13,668
Ohio:
$14,511
(% of AGI for various income ranges: 1.8% for AGIs below $25k, 1.6% for AGIs $25k-50k, 2.0% for AGIs $50k-75k, 3.9% for AGIs $75k-100k, 8.3% for AGIs $100k-200k)
Total itemized deductions: $14,422 (23% of AGI, reported on 16.2% of returns)
Here:
$14,422
State:
$21,278
Here:
23.1% of AGI
State:
18.8% of AGI
(% of AGI for various income ranges: 3.7% for AGIs below $25k, 5.5% for AGIs $25k-50k, 8.8% for AGIs $50k-75k, 11.6% for AGIs $75k-100k, 11.3% for AGIs $100k-200k)
Charity contributions: $3,111 (reported on 11.0% of returns)
Here:
$3,111
State:
$3,943
(% of AGI for various income ranges: 0.3% for AGIs below $25k, 0.6% for AGIs $25k-50k, 1.3% for AGIs $50k-75k, 2.2% for AGIs $75k-100k, 2.0% for AGIs $100k-200k)
Taxes paid: $5,482 (reported on 16.0% of returns)
45216:
$5,482
State:
$9,568
(% of AGI for various income ranges: 0.8% for AGIs below $25k, 1.6% for AGIs $25k-50k, 4.3% for AGIs $50k-75k, 4.1% for AGIs $75k-100k, 5.0% for AGIs $100k-200k)
Earned income credit: $2,481 (reported on 28.3% of returns)
Here:
$2,481
State:
$2,285
(% of AGI for various income ranges: 8.8% for AGIs below $25k, 1.0% for AGIs $25k-50k)
Percentage of individuals using paid preparers for their 2012 taxes: 47.1%
Here:
47%
State:
51%
(% for various income ranges: 45.6% for AGIs below $25k, 48.8% for AGIs $25k-50k, 46.8% for AGIs $50k-75k, 47.4% for AGIs $75k-100k, 58.3% for AGIs $100k-200k)
Averages for the 2004 tax year for zip code 45216, filed in 2005:
Average Adjusted Gross Income (AGI) in 2004: $30,176 (Individual Income Tax Returns)
Here:
$30,176
State:
$44,480
Salary/wage: $28,096 (reported on 86.9% of returns)
Here:
$28,096
State:
$39,198
(% of AGI for various income ranges: 86.1% for AGIs below $10k, 81.4% for AGIs $10k-25k, 87.4% for AGIs $25k-50k, 79.7% for AGIs $50k-75k, 80.0% for AGIs $75k-100k, 56.8% for AGIs over 100k)
Taxable interest for individuals: $1,050 (reported on 27.0% of returns)
This zip code:
$1,050
Ohio:
$1,532
(% of AGI for various income ranges: 2.3% for AGIs below $10k, 1.3% for AGIs $10k-25k, 0.5% for AGIs $25k-50k, 1.2% for AGIs $50k-75k, 0.2% for AGIs $75k-100k, 1.7% for AGIs over 100k)
Taxable dividends: $3,981 (reported on 15.1% of returns)
Here:
$3,981
State:
$3,496
(% of AGI for various income ranges: 1.9% for AGIs below $10k, 1.0% for AGIs $10k-25k, 0.9% for AGIs $25k-50k, 2.0% for AGIs $50k-75k, 2.0% for AGIs $75k-100k, 7.9% for AGIs over 100k)
Net capital gain/loss: +$5,072 (reported on 9.0% of returns)
Here:
+$5,072
State:
+$8,582
(% of AGI for various income ranges: -0.5% for AGIs below $10k, 0.4% for AGIs $10k-25k, 0.2% for AGIs $25k-50k, 1.3% for AGIs $50k-75k, 1.7% for AGIs $75k-100k, 9.4% for AGIs over 100k)
Profit/loss from business: +$6,635 (reported on 9.0% of returns)
Here:
+$6,635
State:
+$10,813
(% of AGI for various income ranges: 5.2% for AGIs below $10k, 4.3% for AGIs $10k-25k, 1.3% for AGIs $25k-50k, 1.3% for AGIs $50k-75k, 1.0% for AGIs $75k-100k, 1.6% for AGIs over 100k)
IRA payment deduction: $2,170 (reported on 1.1% of returns)
45216:
$2,170
Ohio:
$2,794
Total itemized deductions: $14,116 (26% of AGI, reported on 23.6% of returns)
Here:
$14,116
State:
$17,503
Here:
26.2% of AGI
State:
20.8% of AGI
(% of AGI for various income ranges: 5.9% for AGIs below $10k, 6.1% for AGIs $10k-25k, 9.3% for AGIs $25k-50k, 16.2% for AGIs $50k-75k, 14.0% for AGIs $75k-100k, 14.0% for AGIs over 100k)
Charity contributions deductions: $2,152 (4% of AGI, reported on 18.3% of returns)
Here:
$2,152
State:
$3,087
Here:
3.8% of AGI
State:
3.4% of AGI
(% of AGI for various income ranges: 0.5% for AGIs below $10k, 0.6% for AGIs $10k-25k, 1.2% for AGIs $25k-50k, 1.6% for AGIs $50k-75k, 1.6% for AGIs $75k-100k, 2.3% for AGIs over 100k)
Total tax: $3,525 (reported on 70.1% of returns)
45216:
$3,525
State:
$6,781
(% of AGI for various income ranges: 1.7% for AGIs below $10k, 4.0% for AGIs $10k-25k, 7.2% for AGIs $25k-50k, 9.4% for AGIs $50k-75k, 11.1% for AGIs $75k-100k, 16.3% for AGIs over 100k)
Earned income credit: $1,856 (reported on 22.7% of returns)
Here:
$1,856
State:
$1,696
Percentage of individuals using paid preparers for their 2004 taxes: 52.9%
Here:
53%
State:
55%
(% for various income ranges: 45.1% for AGIs below $10k, 54.7% for AGIs $10k-25k, 53.9% for AGIs $25k-50k, 54.5% for AGIs $50k-75k, 62.1% for AGIs $75k-100k, 63.7% for AGIs over 100k)
Household received Food Stamps/SNAP in the past 12 months: 791 Household did not receive Food Stamps/SNAP in the past 12 months: 2,721
Women who had a birth in the past 12 months: 161 (45 now married, 112 unmarried) Women who did not have a birth in the past 12 months: 2,080 (392 now married, 1,689 unmarried)
Housing units in zip code 45216 with a mortgage: 990 (89 second mortgage, 54 both second mortgage and home equity loan) Houses without a mortgage: 29
Median monthly owner costs for units with a mortgage: $1,003 Median monthly owner costs for units without a mortgage: $473
Residents with income below the poverty level in 2022:
This zip code:
20.7%
Whole state:
13.4%
Residents with income below 50% of the poverty level in 2022:
This zip code:
12.9%
Whole state:
7.0%
Median number of rooms in houses and condos:
Here:
6.2
State:
6.7
Median number of rooms in apartments:
Here:
4.0
State:
4.4
Notable locations in this zip code not listed on our city pages
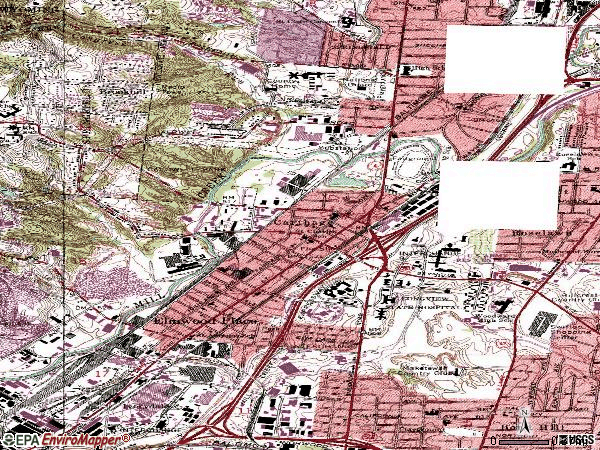
Notable locations in zip code 45216: Hamilton County Fairgrounds (A), Hartwell Country Club (B), Hamilton County Home (C), Elmwood Place Fire Department (D), Elmwood Place Branch Public Library (E), Elmwood Place Town Hall (F), Cincinnati Fire Department Engine and Truck 2 (G), Number 2 Engine Company (H). Display/hide their locations on the map
Churches in zip code 45216 include: Faith United Methodist Church (A), New Jerusalem Baptist Church (B), Full Gospel Independence Missionary Baptist Church (C), First Baptist Church (D), Saint Matthews United Church of Christ (E), Carthage United Church of Christ (F), Valley Fellowship Church of God (G), Positive Living Center (H), Hartwell Church of God (I). Display/hide their locations on the map
669 married couples with children.
1,038 single-parent households (129 men, 909 women).
88.8% of residents of 45216 zip code speak English at home.
10.6% of residents speak Spanish at home (43% very well, 34% well, 19% not well, 4% not at all).
0.7% of residents speak Asian or Pacific Island language at home (100% very well).
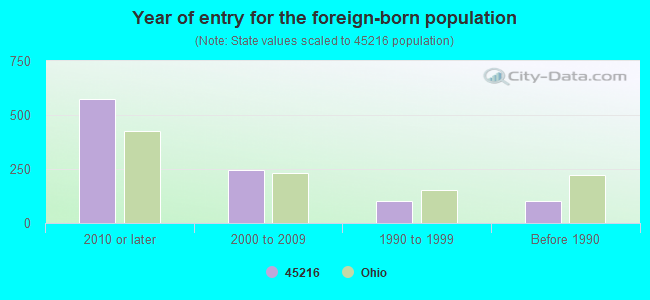
Foreign born population: 894 (10.1%) (27.1% of them are naturalized citizens)
This zip code:
10.1%
Whole state:
5.0%
31%El Salvador
25%Honduras
19%Liberia
12%Haiti
5%Brazil
4%Belize
3%Uruguay
10%American
10%Irish
10%English
9%German
4%Nigerian
1%Italian
1%Scotch-Irish
Year of entry for the foreign-born population
5762010 or later
2472000 to 2009
1021990 to 1999
104Before 1990
Facilities with environmental interests located in this zip code:
AB STEEL MILL INC (204 WEST NORTH BEND ROAD in CINCINNATI, OH)
(Integrated Compliance Information System) - ICIS-05-1994-0262, FORMAL ENFORCEMENT ACTION COMPLIANCE ACTIVITY (Tracking inspections of insecticide, fungicide, and rodenticide, and toxic substances) STATE MASTER (Ohio general info) - EPCRA, RCRA-OHD099870842, HAZARDOUS WASTE PROGRAM Small Quantity Generators, between 100 kg and 1000 kg of hazardous waste/month (Resource Conservation and Recovery Act (tracking hazardous waste)) - notification Organizations: BYER HERBERT (CONTACT/OWNER)
Alternative names: A B STEEL MILL INC., AB STEEL MILLS INC
AMERICAN COMPRESSED STEEL CORP * (200 WEST NORTH BEND ROAD in CINCINNATI, OH)
(Integrated Compliance Information System) - ICIS-05-1996-0093, FORMAL ENFORCEMENT ACTION COMPLIANCE ACTIVITY (Tracking inspections of insecticide, fungicide, and rodenticide, and toxic substances) STATE MASTER (Ohio general info) - AIR MAJOR Business SIC classification: SCRAP AND WASTE MATERIALS
BON DEVELOPMENT CO * (415 W SEYMOUR AVE in CINCINNATI, OH)
AIR MINOR (AIRS/AFS) STATE MASTER (Ohio general info) - AIR MAJOR Business SIC classification: TERMINAL AND JOINT TERMINAL MAINTENANCE FACILITIES FOR MOTOR FREIGHT TRANSPORTATION Alternative names: BON DEVELOPMENT COMPANY
CHC FABRICATING CORP * (220 W. NORTH BEND RD. in CINCINNATI, OH)
AIR MINOR (AIRS/AFS) STATE MASTER (Ohio general info) - RCRA-OHD987019775, HAZARDOUS WASTE PROGRAM, AIR MAJOR Conditionally Exempt Small Quantity Generators, less than 100 kg/month of hazardous waste (Resource Conservation and Recovery Act (tracking hazardous waste)) - notification TRI REPORTER (Tracking of toxic chemicals releasing facilities) Business SIC classification: FABRICATED STRUCTURAL METAL; ARCHITECTURAL AND ORNAMENTAL METALWORK; MISCELLANEOUS STRUCTURAL METALWORK Organizations: CHC FABRICATING CORPORATION (CONTACT/OWNER)
, GOTHAM INC - PROPERTY (CONTACT/OWNER)
ALLWASTE CONTAINER SERVICES (588 W SEYMOUR AVE. in CINCINNATI, OH)
STATE MASTER (Ohio general info) - RCRA-OHD980896831, HAZARDOUS WASTE PROGRAM, AIR MAJOR (Resource Conservation and Recovery Act (tracking hazardous waste)) Organizations: ALLWASTE TANK CLEANING INC (CONTACT/OWNER)
BONDED 1026 (3 E N BEND RD in CINCINNATI, OH)
STATE MASTER (Ohio general info) - RCRA-OHD987002581, HAZARDOUS WASTE PROGRAM, AIR MAJOR, -31-5541-899-1, EPCRA Conditionally Exempt Small Quantity Generators, less than 100 kg/month of hazardous waste (Resource Conservation and Recovery Act (tracking hazardous waste)) - notification Organizations: SPEEDWAY/SUPERAMERICA LLC (CONTACT/OPERATOR)
, SPEEDWAY/SUPERAMERICA (CONTACT/OWNER)
BARRETT PAVING MATERIALS INC (7721 VINE STREET in CINCINNATI, OH)
AIR SYNTHETIC MINOR (AIRS/AFS) STATE MASTER (Ohio general info) - AIR MAJOR Business SIC classification: ASPHALT PAVING MIXTURES AND BLOCKS Alternative names: BARRETT PAVING MTRLS
CHC FABRICATING CORPORATION (10270 WAYNE AVENUE in CINCINNATI, OH)
AIR SYNTHETIC MINOR (AIRS/AFS) Conditionally Exempt Small Quantity Generators, less than 100 kg/month of hazardous waste (Resource Conservation and Recovery Act (tracking hazardous waste)) Business SIC and NAICS classification: FABRICATED STRUCTURAL METAL
AT&T CORPORATION (140 E GALBRAITH RD in CINCINNATI, OH)
Small Quantity Generators, between 100 kg and 1000 kg of hazardous waste/month (Resource Conservation and Recovery Act (tracking hazardous waste)) - notification Organizations: AT & T CORP (CONTACT/OWNER)
BON DEVELOPMENT CO (360 WEST SEYMOUR AVENUE in CINCINNATI, OH)
Small Quantity Generators, between 100 kg and 1000 kg of hazardous waste/month (Resource Conservation and Recovery Act (tracking hazardous waste)) - notification Organizations: JOHN OLDFIELD (CONTACT/OWNER)
BALI REALTY CO INC (16 DECAMP AVE in CINCINNATI, OH)
TSD (Resource Conservation and Recovery Act (tracking hazardous waste))
Housing units lacking complete plumbing facilities: 2.9% Housing units lacking complete kitchen facilities: 7.0%
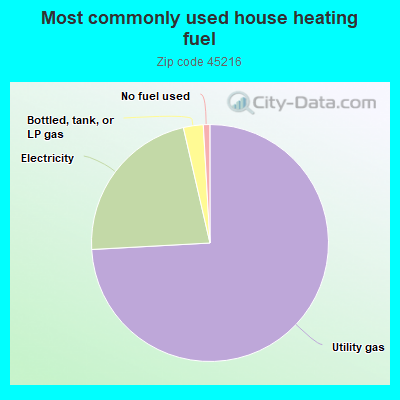
74.2%Utility gas
22.3%Electricity
2.7%Bottled, tank, or LP gas
0.9%No fuel used
Population in 1990: 10,261.
Place of birth for U.S.-born residents:
This state: 6,566
Northeast: 131
Midwest: 127
South: 1,005
West: 57
52% of the 45216 zip code residents lived in the same house 5 years ago. Out of people who lived in different houses, 75% lived in this county. Out of people who lived in different counties, 50% lived in Ohio.
87% of the 45216 zip code residents lived in the same house 1 year ago. Out of people who lived in different houses, 65% moved from this county. Out of people who lived in different houses, 18% moved from different county within same state. Out of people who lived in different houses, 13% moved from different state.
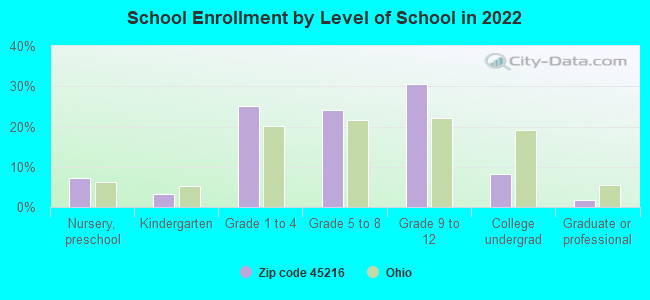
Private vs. public school enrollment:
Students in private schools in grades 1 to 8 (elementary and middle school): 255
Here:
22.6%
Ohio:
16.0%
Students in private schools in grades 9 to 12 (high school): 266
Here:
38.0%
Ohio:
13.1%
Students in private undergraduate colleges:
Here:
0.0%
Ohio:
22.3%
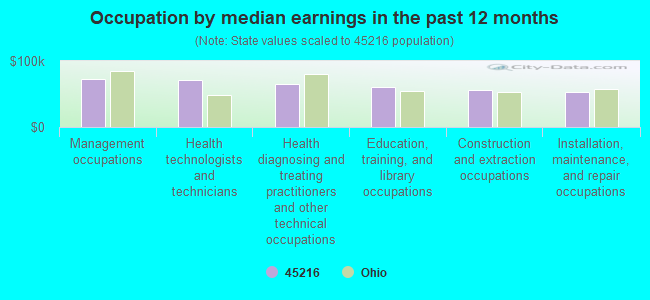
Occupation by median earnings in the past 12 months ($)
72,170Management occupations
70,469Health technologists and technicians
64,777Health diagnosing and treating practitioners and other technical occupations
60,632Education, training, and library occupations
56,543Construction and extraction occupations
53,529Installation, maintenance, and repair occupations
Companies with federal contracts located in this zip code (CINCINNATI, OH):
VILLAGE BUILDING SERVICES INC (7311 VINE ST; small business) : $201,006 in 10 contractsfrom 1999 to 2001
Contracts for Maintenance, Repair or Alteration of Real Property -- Laboratories and Clinics, Maintenance, Repair or Alteration of Real Property -- Other Non-Building Facilities by Air Force, Defense Logistics Agency Signed by year:2000: $164,102; 2001: $16,057; 2002: $0; 2003: $0; 2004: $0; 2005: $0; 2006: $0.
Biggest contracts:
$84,061 with Air Force for Maintenance, Repair or Alteration of Real Property -- Laboratories and Clinics. Signed on 2000-07-11. Completion date: 2000-08-10.
$33,697, same as above.Signed on 2000-08-01. Completion date: 2000-09-25.
$20,847 with Defense Logistics Agency for Maintenance, Repair or Alteration of Real Property -- Other Non-Building Facilities. Signed on 1999-12-03. Completion date: 2000-03-29.
$15,886 with Air Force for Maintenance, Repair or Alteration of Real Property -- Laboratories and Clinics. Signed on 2000-09-25. Completion date: 2000-11-03.
MIDWEST CASTER & WHEEL, INC (431 W SEYMOUR AVE; small business) : $136,401 in 5 contractsfrom 2000 to 2006
Contracts for Hardware, Commercial, Aircraft Maintenance and Repair Shop Specialized Equipment, Vehicular Brake, Steering, Axle, Wheel, and Track Components by Defense Logistics Agency, Army Signed by year:2000: $97,295; 2001: $28,560; 2002: $0; 2003: $0; 2004: $0; 2005: $6,979; 2006: $3,567.
Biggest contracts:
$97,295 with Defense Logistics Agency for Hardware, Commercial. Signed on 2000-12-05. Completion date: 2001-12-05.
$28,560, same as above.Signed on 2001-06-11. Completion date: 2001-06-11.
$4,353 with Army for Aircraft Maintenance and Repair Shop Specialized Equipment. Signed on 2005-09-07. Completion date: 2005-10-07.
$3,567 with Defense Logistics Agency for Vehicular Brake, Steering, Axle, Wheel, and Track Components. Taking place in TN. Signed on 2006-03-29. Completion date: 2006-05-18.
M M C INC (1260 EDISON DR; small business)
$31,513 with Army for Miscellaneous Machine Tools. Signed on 2002-09-30. Completion date: 2002-11-15.
JERRY TOOLS INC (6200 VINE ST; small business) : $25,000 in 2 contractsin 2006
$38,200 with Air Force for Miscellaneous Maintenance and Repair Shop Specialized Equipment. Signed on 2006-03-14. Completion date: 2006-06-06.
-$13,200, same as above.Signed on 2006-05-09. Completion date: 2006-06-23.
FURNISH EQUIPMENT CO INC (435 W SEYMOUR AVE) : $18,915 in 5 contractsfrom 2004 to 2005
Contracts for Miscellaneous Household and Commercial Furnishings and Appliances, Material Handling Equipment, Nonself-Propelled, Food Products Machinery and Equipment, Miscellaneous Materials Handling Equipment by Army, Defense Logistics Agency, Navy Signed by year:2000: $0; 2001: $0; 2002: $0; 2003: $0; 2004: $8,840; 2005: $10,075; 2006: $0.
Biggest contracts:
$10,510 with Army for Miscellaneous Household and Commercial Furnishings and Appliances. Signed on 2005-09-29. Completion date: 2005-10-30.
$8,840 with Defense Logistics Agency for Material Handling Equipment, Nonself-Propelled. Signed on 2004-10-21. Completion date: 2004-11-19.
$5,775 with Navy for Food Products Machinery and Equipment. Signed on 2005-08-30. Completion date: 2005-09-16.
$4,300 with Navy for Miscellaneous Materials Handling Equipment. Signed on 2005-03-01. Completion date: 2005-03-11.
Top industries in this zip code by the number of employees in 2005:
Construction: Commercial and Institutional Building Construction (500-999 employees: 1 establishment, 10-19 employees: 1 establishment, 5-9 employees: 1 establishment)
Health Care and Social Assistance: Specialty (except Psychiatric and Substance Abuse) Hospitals (500-999: 1)
Management of Companies and Enterprises: Corporate, Subsidiary, and Regional Managing Offices (250-499: 1, 50-99: 1, 1-4: 2)
Administrative and Support and Waste Management and Remediation Services: Temporary Help Services (250-499: 1)
Health Care and Social Assistance: Nursing Care Facilities (100-249: 1)
People in group quarters in 2010:
50 people in nursing facilities/skilled-nursing facilities
26 people in group homes intended for adults
7 people in group homes for juveniles (non-correctional)
People in group quarters in 2000:
40 people in nursing homes
39 people in other nonhousehold living situations
24 people in homes for the mentally retarded
Fatal accident statistics in 2012:
Fatal accident count: 1
Vehicles involved in fatal accidents: 1
Fatal accidents caused by drunken drivers: 0
Fatalities: 1
Persons involved in fatal accidents: 1
Pedestrians involved in fatal accidents: 1
Fatal accident statistics in 2011:
Fatal accident count: 3
Vehicles involved in fatal accidents: 4
Fatal accidents caused by drunken drivers: 2
Fatalities: 3
Persons involved in fatal accidents: 5
Pedestrians involved in fatal accidents: 0
Home Mortgage Disclosure Act Aggregated Statistics For Year 2009 (Based on 4 full and 8 partial tracts)
A) FHA, FSA/RHS & VA Home Purchase Loans
B) Conventional Home Purchase Loans
C) Refinancings
D) Home Improvement Loans
E) Loans on Dwellings For 5+ Families
F) Non-occupant Loans on < 5 Family Dwellings (A B C & D)
G) Loans On Manufactured Home Dwelling (A B C & D)
Number
Average Value
Number
Average Value
Number
Average Value
Number
Average Value
Number
Average Value
Number
Average Value
Number
Average Value
LOANS ORIGINATED
77
$78,348
26
$76,297
130
$101,153
15
$51,734
2
$360,755
18
$68,653
0
$0
APPLICATIONS APPROVED, NOT ACCEPTED
5
$89,544
2
$60,910
12
$119,915
4
$13,535
0
$0
2
$60,910
0
$0
APPLICATIONS DENIED
21
$84,031
12
$110,130
134
$88,617
22
$25,151
0
$0
24
$86,975
2
$86,045
APPLICATIONS WITHDRAWN
7
$121,234
0
$0
46
$94,334
3
$18,197
0
$0
0
$0
0
$0
FILES CLOSED FOR INCOMPLETENESS
2
$65,920
0
$0
12
$92,740
0
$0
0
$0
0
$0
0
$0
Aggregated Statistics For Year 2008 (Based on 4 full and 8 partial tracts)
A) FHA, FSA/RHS & VA Home Purchase Loans
B) Conventional Home Purchase Loans
C) Refinancings
D) Home Improvement Loans
E) Loans on Dwellings For 5+ Families
F) Non-occupant Loans on < 5 Family Dwellings (A B C & D)
G) Loans On Manufactured Home Dwelling (A B C & D)
Number
Average Value
Number
Average Value
Number
Average Value
Number
Average Value
Number
Average Value
Number
Average Value
Number
Average Value
LOANS ORIGINATED
73
$91,157
58
$65,043
103
$86,078
28
$20,212
1
$567,740
48
$57,774
4
$114,565
APPLICATIONS APPROVED, NOT ACCEPTED
2
$74,525
3
$57,880
21
$89,444
6
$49,110
0
$0
2
$91,250
4
$110,212
APPLICATIONS DENIED
19
$70,202
27
$57,189
120
$101,135
32
$35,638
2
$548,820
33
$60,282
0
$0
APPLICATIONS WITHDRAWN
7
$63,590
15
$62,768
35
$110,766
2
$104,880
0
$0
12
$55,524
0
$0
FILES CLOSED FOR INCOMPLETENESS
2
$58,010
2
$85,765
5
$114,152
2
$85,755
0
$0
0
$0
0
$0
Aggregated Statistics For Year 2007 (Based on 4 full and 8 partial tracts)
A) FHA, FSA/RHS & VA Home Purchase Loans
B) Conventional Home Purchase Loans
C) Refinancings
D) Home Improvement Loans
E) Loans on Dwellings For 5+ Families
F) Non-occupant Loans on < 5 Family Dwellings (A B C & D)
G) Loans On Manufactured Home Dwelling (A B C & D)
Number
Average Value
Number
Average Value
Number
Average Value
Number
Average Value
Number
Average Value
Number
Average Value
Number
Average Value
LOANS ORIGINATED
21
$98,085
140
$81,685
152
$86,558
21
$22,740
0
$0
63
$65,791
0
$0
APPLICATIONS APPROVED, NOT ACCEPTED
3
$93,310
28
$100,398
50
$95,012
8
$51,269
0
$0
9
$98,172
5
$28,006
APPLICATIONS DENIED
13
$73,265
62
$78,718
185
$93,309
49
$31,942
2
$98,170
37
$73,906
0
$0
APPLICATIONS WITHDRAWN
7
$90,750
33
$83,473
49
$85,937
2
$64,675
0
$0
13
$63,075
2
$52,495
FILES CLOSED FOR INCOMPLETENESS
0
$0
2
$200,985
29
$96,582
0
$0
1
$750,760
3
$118,540
0
$0
Aggregated Statistics For Year 2006 (Based on 4 full and 8 partial tracts)
A) FHA, FSA/RHS & VA Home Purchase Loans
B) Conventional Home Purchase Loans
C) Refinancings
D) Home Improvement Loans
E) Loans on Dwellings For 5+ Families
F) Non-occupant Loans on < 5 Family Dwellings (A B C & D)
G) Loans On Manufactured Home Dwelling (A B C & D)
Number
Average Value
Number
Average Value
Number
Average Value
Number
Average Value
Number
Average Value
Number
Average Value
Number
Average Value
LOANS ORIGINATED
26
$118,209
244
$78,539
264
$82,798
49
$23,271
3
$1,036,320
99
$58,444
6
$130,195
APPLICATIONS APPROVED, NOT ACCEPTED
0
$0
43
$85,457
93
$92,020
6
$11,800
0
$0
15
$64,951
2
$16,435
APPLICATIONS DENIED
2
$99,580
109
$75,209
292
$85,481
65
$30,116
0
$0
67
$74,886
10
$34,415
APPLICATIONS WITHDRAWN
2
$105,370
35
$89,606
159
$86,711
8
$41,400
2
$65,740
28
$66,657
0
$0
FILES CLOSED FOR INCOMPLETENESS
0
$0
7
$116,750
29
$92,717
4
$41,572
0
$0
0
$0
0
$0
Aggregated Statistics For Year 2005 (Based on 4 full and 8 partial tracts)
A) FHA, FSA/RHS & VA Home Purchase Loans
B) Conventional Home Purchase Loans
C) Refinancings
D) Home Improvement Loans
E) Loans on Dwellings For 5+ Families
F) Non-occupant Loans on < 5 Family Dwellings (A B C & D)
G) Loans On Manufactured Home Dwelling (A B C & D)
Number
Average Value
Number
Average Value
Number
Average Value
Number
Average Value
Number
Average Value
Number
Average Value
Number
Average Value
LOANS ORIGINATED
46
$105,465
264
$77,828
342
$80,278
49
$29,758
1
$295,700
143
$62,732
6
$142,763
APPLICATIONS APPROVED, NOT ACCEPTED
2
$62,835
40
$74,546
94
$82,103
16
$41,187
0
$0
29
$62,843
0
$0
APPLICATIONS DENIED
7
$83,353
127
$66,801
310
$94,125
60
$33,300
0
$0
54
$101,713
4
$19,818
APPLICATIONS WITHDRAWN
6
$131,485
46
$75,674
164
$97,769
20
$82,862
0
$0
32
$61,102
4
$167,490
FILES CLOSED FOR INCOMPLETENESS
3
$77,760
19
$82,305
30
$93,500
0
$0
0
$0
3
$99,530
0
$0
Aggregated Statistics For Year 2004 (Based on 4 full and 8 partial tracts)
A) FHA, FSA/RHS & VA Home Purchase Loans
B) Conventional Home Purchase Loans
C) Refinancings
D) Home Improvement Loans
E) Loans on Dwellings For 5+ Families
F) Non-occupant Loans on < 5 Family Dwellings (A B C & D)
G) Loans On Manufactured Home Dwelling (A B C & D)
Number
Average Value
Number
Average Value
Number
Average Value
Number
Average Value
Number
Average Value
Number
Average Value
Number
Average Value
LOANS ORIGINATED
45
$105,048
252
$82,775
385
$76,059
38
$36,064
2
$204,960
123
$61,670
10
$112,145
APPLICATIONS APPROVED, NOT ACCEPTED
4
$88,570
63
$92,999
67
$88,090
12
$35,031
0
$0
33
$62,574
0
$0
APPLICATIONS DENIED
12
$102,244
89
$74,289
227
$77,429
82
$22,500
0
$0
53
$58,418
12
$76,859
APPLICATIONS WITHDRAWN
2
$71,395
49
$85,332
170
$80,940
15
$30,409
0
$0
46
$65,859
0
$0
FILES CLOSED FOR INCOMPLETENESS
0
$0
6
$74,475
34
$82,075
4
$35,775
0
$0
4
$69,298
0
$0
Aggregated Statistics For Year 2003 (Based on 4 full and 8 partial tracts)
A) FHA, FSA/RHS & VA Home Purchase Loans
B) Conventional Home Purchase Loans
C) Refinancings
D) Home Improvement Loans
E) Loans on Dwellings For 5+ Families
F) Non-occupant Loans on < 5 Family Dwellings (A B C & D)
Number
Average Value
Number
Average Value
Number
Average Value
Number
Average Value
Number
Average Value
Number
Average Value
LOANS ORIGINATED
56
$97,983
223
$86,333
636
$79,796
29
$25,797
4
$189,485
135
$61,729
APPLICATIONS APPROVED, NOT ACCEPTED
2
$110,475
32
$84,005
104
$80,541
9
$27,717
0
$0
12
$58,157
APPLICATIONS DENIED
6
$82,110
59
$75,552
280
$81,333
52
$19,985
5
$191,896
29
$72,114
APPLICATIONS WITHDRAWN
7
$92,387
49
$91,888
138
$79,440
5
$24,944
0
$0
6
$74,352
FILES CLOSED FOR INCOMPLETENESS
1
$69,060
8
$69,880
39
$86,448
2
$11,600
0
$0
7
$51,853
Aggregated Statistics For Year 2002 (Based on 4 full and 8 partial tracts)
A) FHA, FSA/RHS & VA Home Purchase Loans
B) Conventional Home Purchase Loans
C) Refinancings
D) Home Improvement Loans
E) Loans on Dwellings For 5+ Families
F) Non-occupant Loans on < 5 Family Dwellings (A B C & D)
Number
Average Value
Number
Average Value
Number
Average Value
Number
Average Value
Number
Average Value
Number
Average Value
LOANS ORIGINATED
36
$84,278
169
$81,405
430
$77,866
48
$25,172
2
$65,740
102
$62,469
APPLICATIONS APPROVED, NOT ACCEPTED
5
$56,938
33
$59,003
155
$83,173
17
$27,725
0
$0
7
$68,037
APPLICATIONS DENIED
7
$97,849
63
$64,467
293
$77,714
45
$18,618
0
$0
30
$72,204
APPLICATIONS WITHDRAWN
1
$78,680
39
$75,742
198
$81,544
3
$22,953
0
$0
16
$61,892
FILES CLOSED FOR INCOMPLETENESS
0
$0
21
$62,476
49
$92,883
2
$32,870
0
$0
8
$58,118
Aggregated Statistics For Year 2001 (Based on 4 full and 8 partial tracts)
A) FHA, FSA/RHS & VA Home Purchase Loans
B) Conventional Home Purchase Loans
C) Refinancings
D) Home Improvement Loans
E) Loans on Dwellings For 5+ Families
F) Non-occupant Loans on < 5 Family Dwellings (A B C & D)
Number
Average Value
Number
Average Value
Number
Average Value
Number
Average Value
Number
Average Value
Number
Average Value
LOANS ORIGINATED
56
$81,131
160
$75,060
435
$74,307
56
$15,074
6
$188,622
87
$65,677
APPLICATIONS APPROVED, NOT ACCEPTED
4
$85,648
28
$64,438
109
$78,239
11
$7,891
0
$0
6
$80,220
APPLICATIONS DENIED
11
$55,891
61
$63,923
305
$68,949
79
$10,179
1
$550,000
38
$53,944
APPLICATIONS WITHDRAWN
8
$63,341
16
$57,997
181
$69,749
12
$15,784
0
$0
13
$52,505
FILES CLOSED FOR INCOMPLETENESS
0
$0
2
$53,175
21
$91,640
5
$27,784
0
$0
4
$83,622
Aggregated Statistics For Year 2000 (Based on 4 full and 6 partial tracts)
A) FHA, FSA/RHS & VA Home Purchase Loans
B) Conventional Home Purchase Loans
C) Refinancings
D) Home Improvement Loans
E) Loans on Dwellings For 5+ Families
F) Non-occupant Loans on < 5 Family Dwellings (A B C & D)
Number
Average Value
Number
Average Value
Number
Average Value
Number
Average Value
Number
Average Value
Number
Average Value
LOANS ORIGINATED
66
$75,029
166
$59,297
255
$61,983
73
$12,006
0
$0
69
$53,741
APPLICATIONS APPROVED, NOT ACCEPTED
2
$72,970
27
$57,091
106
$63,539
30
$20,663
0
$0
5
$47,620
APPLICATIONS DENIED
8
$59,210
72
$49,012
223
$60,559
80
$16,662
2
$54,140
25
$63,498
APPLICATIONS WITHDRAWN
7
$98,389
28
$97,947
122
$57,887
5
$24,358
0
$0
10
$104,354
FILES CLOSED FOR INCOMPLETENESS
1
$126,610
6
$65,537
35
$72,796
0
$0
0
$0
2
$24,170
Aggregated Statistics For Year 1999 (Based on 2 full and 4 partial tracts)
A) FHA, FSA/RHS & VA Home Purchase Loans
B) Conventional Home Purchase Loans
C) Refinancings
D) Home Improvement Loans
E) Loans on Dwellings For 5+ Families
F) Non-occupant Loans on < 5 Family Dwellings (A B C & D)
2002 - 2018 National Fire Incident Reporting System (NFIRS) incidents
Based on the data from the years 2002 - 2018 the average number of fire incidents per year is 70. The highest number of reported fires - 106 took place in 2011, and the least - 25 in 2002. The data has a rising trend.
When looking into fire subcategories, the most reports belonged to: Structure Fires (51.9%), and Outside Fires (25.6%).
Fire incident types reported to NFIRS in Zip Code 45216

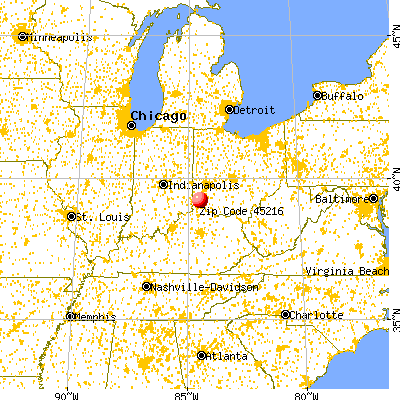


 Nearest zip codes: 45237, 45232, 45217, 45215, 45212, 45229.


 Based on the data from the years 2002 - 2018 the average number of fire incidents per year is 70. The highest number of reported fires - 106 took place in 2011, and the least - 25 in 2002. The data has a rising trend.
 When looking into fire subcategories, the most reports belonged to: Structure Fires (51.9%), and Outside Fires (25.6%).