Races in Chicago, Illinois (IL) Detailed Stats
Data:
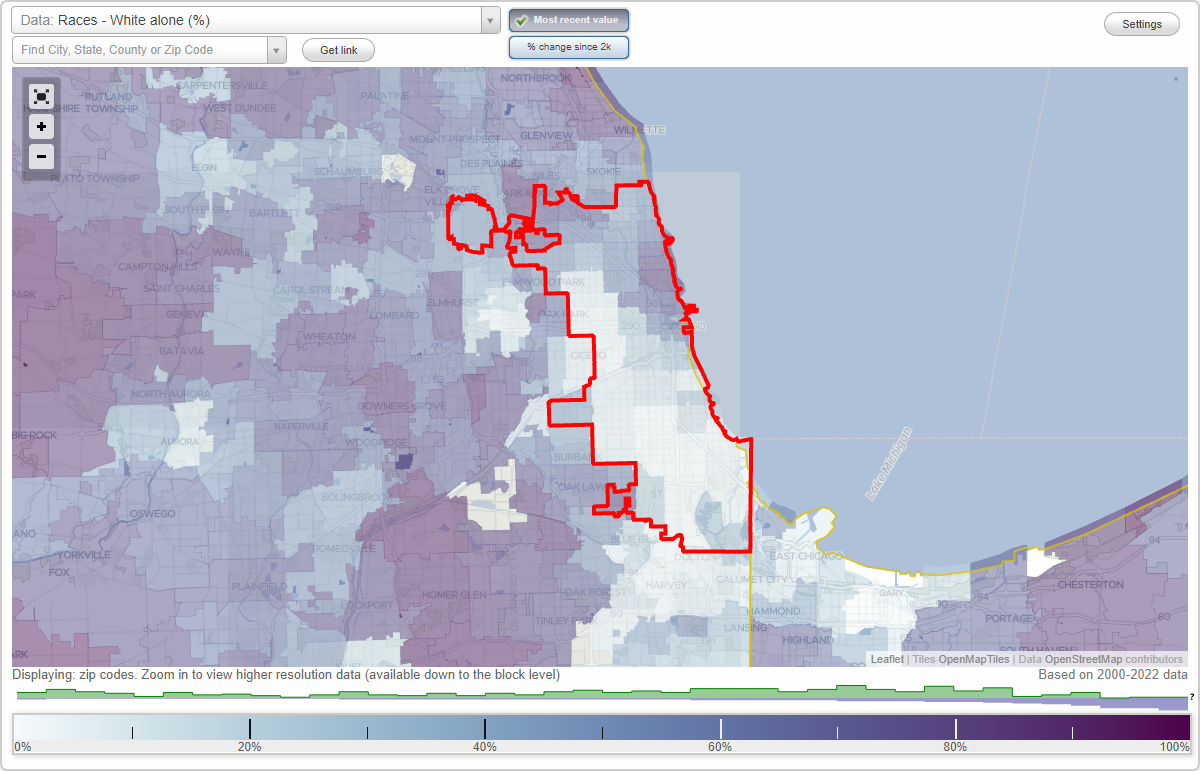
Races - White alone (%)
Races - White alone (% change since 2000)
Races - Black alone (%)
Races - Black alone (% change since 2000)
Races - American Indian alone (%)
Races - American Indian alone (% change since 2000)
Races - Asian alone (%)
Races - Asian alone (% change since 2000)
Races - Hispanic (%)
Races - Hispanic (% change since 2000)
Races - Native Hawaiian and Other Pacific Islander alone (%)
Races - Native Hawaiian and Other Pacific Islander alone (% change since 2000)
Races - Two or more races(%)
Races - Two or more races(% change since 2000)
Races - Other race alone (%)
Races - Other race alone (% change since 2000)
Racial diversity
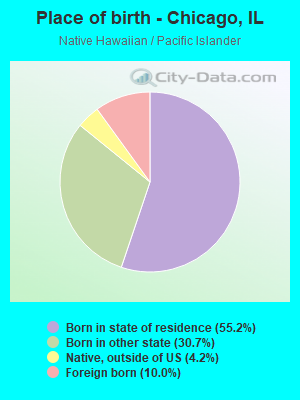
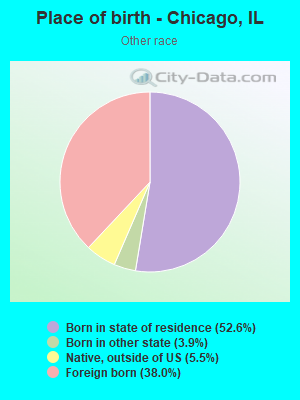
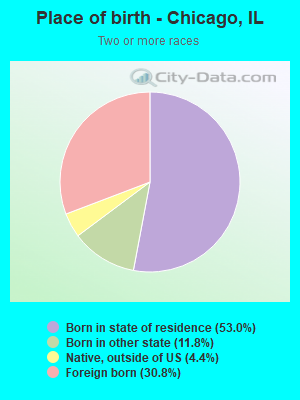
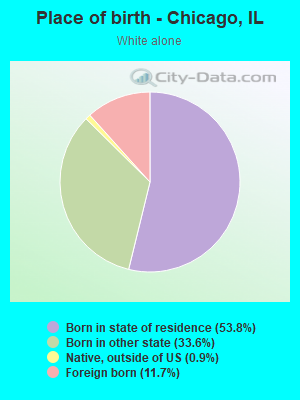
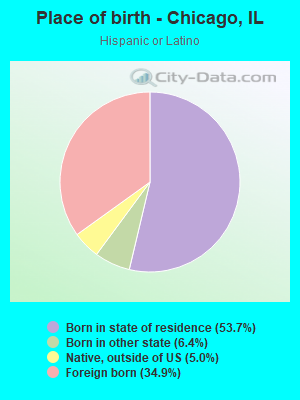
Place of birth - Born in state of residence (%)
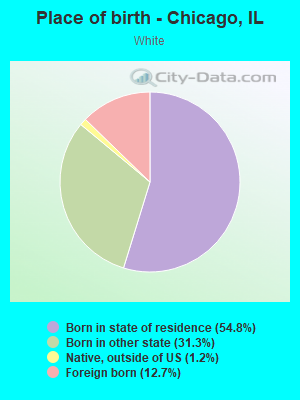
Place of birth - Born in state of residence (%) - White
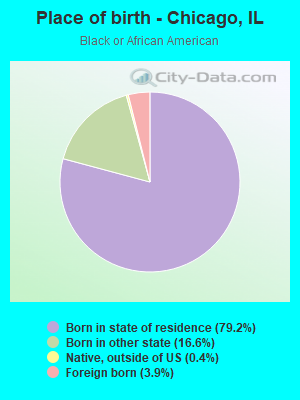
Place of birth - Born in state of residence (%) - Black or African American
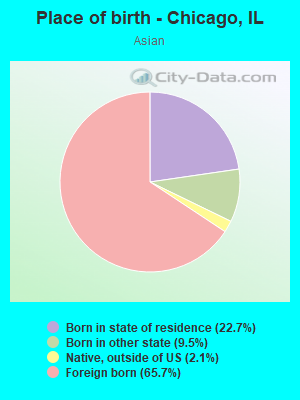
Place of birth - Born in state of residence (%) - Asian
Place of birth - Born in state of residence (%) - Hispanic or Latino
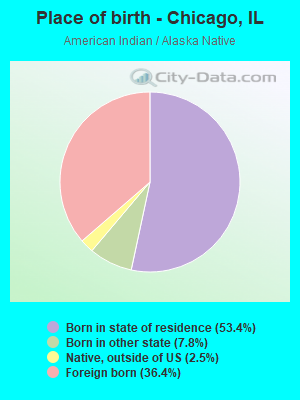
Place of birth - Born in state of residence (%) - American Indian and Alaska Native
Place of birth - Born in state of residence (%) - Multirace
Place of birth - Born in state of residence (%) - Other Race
Place of birth - Born in other state (%)
Place of birth - Born in other state (%) - White
Place of birth - Born in other state (%) - Black or African American
Place of birth - Born in other state (%) - Asian
Place of birth - Born in other state (%) - Hispanic or Latino
Place of birth - Born in other state (%) - American Indian and Alaska Native
Place of birth - Born in other state (%) - Multirace
Place of birth - Born in other state (%) - Other Race
Place of birth - Native, outside of US (%)
Place of birth - Native, outside of US (%) - White
Place of birth - Native, outside of US (%) - Black or African American
Place of birth - Native, outside of US (%) - Asian
Place of birth - Native, outside of US (%) - Hispanic or Latino
Place of birth - Native, outside of US (%) - American Indian and Alaska Native
Place of birth - Native, outside of US (%) - Multirace
Place of birth - Native, outside of US (%) - Other Race
Place of birth - Foreign born (%)
Place of birth - Foreign born (%) - White
Place of birth - Foreign born (%) - Black or African American
Place of birth - Foreign born (%) - Asian
Place of birth - Foreign born (%) - Hispanic or Latino
Place of birth - Foreign born (%) - American Indian and Alaska Native
Place of birth - Foreign born (%) - Multirace
Place of birth - Foreign born (%) - Other Race
Residents speaking English at home (%)
Residents speaking English at home - Born in the United States (%)
Residents speaking English at home - Native, born elsewhere (%)
Residents speaking English at home - Foreign born (%)
Residents speaking Spanish at home (%)
Residents speaking Spanish at home - Born in the United States (%)
Residents speaking Spanish at home - Native, born elsewhere (%)
Residents speaking Spanish at home - Foreign born (%)
Residents speaking other language at home (%)
Residents speaking other language at home - Born in the United States (%)
Residents speaking other language at home - Native, born elsewhere (%)
Residents speaking other language at home - Foreign born (%)
Marital status - Never married (%)
Marital status - Now married (%)
Marital status - Separated (%)
Marital status - Widowed (%)
Marital status - Divorced (%)
Ancestries Reported - Arab (%)
Ancestries Reported - Czech (%)
Ancestries Reported - Danish (%)
Ancestries Reported - Dutch (%)
Ancestries Reported - English (%)
Ancestries Reported - French (%)
Ancestries Reported - French Canadian (%)
Ancestries Reported - German (%)
Ancestries Reported - Greek (%)
Ancestries Reported - Hungarian (%)
Ancestries Reported - Irish (%)
Ancestries Reported - Italian (%)
Ancestries Reported - Lithuanian (%)
Ancestries Reported - Norwegian (%)
Ancestries Reported - Polish (%)
Ancestries Reported - Portuguese (%)
Ancestries Reported - Russian (%)
Ancestries Reported - Scotch-Irish (%)
Ancestries Reported - Scottish (%)
Ancestries Reported - Slovak (%)
Ancestries Reported - Subsaharan African (%)
Ancestries Reported - Swedish (%)
Ancestries Reported - Swiss (%)
Ancestries Reported - Ukrainian (%)
Ancestries Reported - United States (%)
Ancestries Reported - Welsh (%)
Ancestries Reported - West Indian (%)
Ancestries Reported - Other (%)
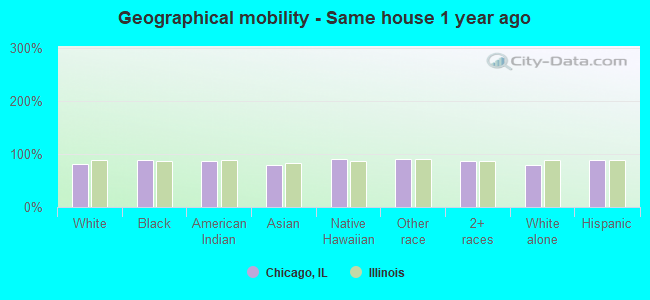
Geographical mobility - Same house 1 year ago (%)
Geographical mobility - Same house 1 year ago (%) - White
Geographical mobility - Same house 1 year ago (%) - Black or African American
Geographical mobility - Same house 1 year ago (%) - Asian
Geographical mobility - Same house 1 year ago (%) - Hispanic or Latino
Geographical mobility - Same house 1 year ago (%) - American Indian and Alaska Native
Geographical mobility - Same house 1 year ago (%) - Multirace
Geographical mobility - Same house 1 year ago (%) - Other Race
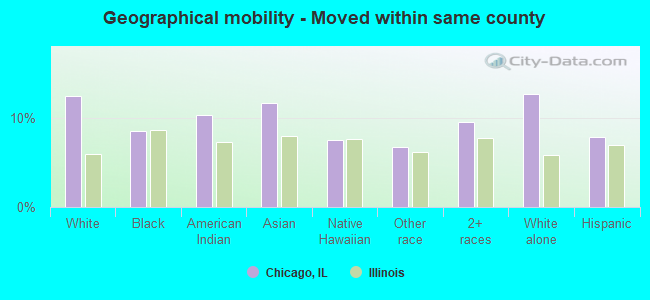
Geographical mobility - Moved within same county (%)
Geographical mobility - Moved within same county (%) - White
Geographical mobility - Moved within same county (%) - Black or African American
Geographical mobility - Moved within same county (%) - Asian
Geographical mobility - Moved within same county (%) - Hispanic or Latino
Geographical mobility - Moved within same county (%) - American Indian and Alaska Native
Geographical mobility - Moved within same county (%) - Multirace
Geographical mobility - Moved within same county (%) - Other Race
Geographical mobility - Moved from different county within same state (%)
Geographical mobility - Moved from different county within same state (%) - White
Geographical mobility - Moved from different county within same state (%) - Black or African American
Geographical mobility - Moved from different county within same state (%) - Asian
Geographical mobility - Moved from different county within same state (%) - Hispanic or Latino
Geographical mobility - Moved from different county within same state (%) - American Indian and Alaska Native
Geographical mobility - Moved from different county within same state (%) - Multirace
Geographical mobility - Moved from different county within same state (%) - Other Race
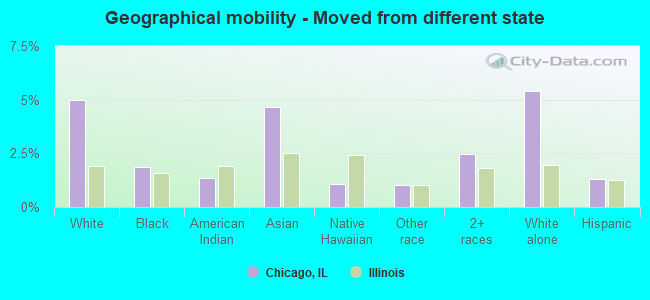
Geographical mobility - Moved from different state (%)
Geographical mobility - Moved from different state (%) - White
Geographical mobility - Moved from different state (%) - Black or African American
Geographical mobility - Moved from different state (%) - Asian
Geographical mobility - Moved from different state (%) - Hispanic or Latino
Geographical mobility - Moved from different state (%) - American Indian and Alaska Native
Geographical mobility - Moved from different state (%) - Multirace
Geographical mobility - Moved from different state (%) - Other Race
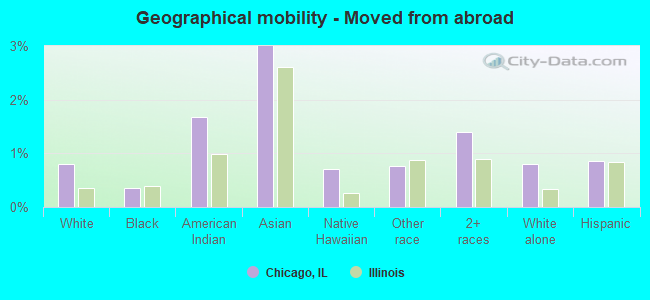
Geographical mobility - Moved from abroad (%)
Geographical mobility - Moved from abroad (%) - White
Geographical mobility - Moved from abroad (%) - Black or African American
Geographical mobility - Moved from abroad (%) - Asian
Geographical mobility - Moved from abroad (%) - Hispanic or Latino
Geographical mobility - Moved from abroad (%) - American Indian and Alaska Native
Geographical mobility - Moved from abroad (%) - Multirace
Geographical mobility - Moved from abroad (%) - Other Race
Place of birth for the foreign-born population - Ireland (%)
Place of birth for the foreign-born population - Denmark (%)
Place of birth for the foreign-born population - Norway (%)
Place of birth for the foreign-born population - Sweden (%)
Place of birth for the foreign-born population - United Kingdom (%)
Place of birth for the foreign-born population - England (%)
Place of birth for the foreign-born population - Scotland (%)
Place of birth for the foreign-born population - Other Northern Europe (%)
Place of birth for the foreign-born population - Austria (%)
Place of birth for the foreign-born population - Belgium (%)
Place of birth for the foreign-born population - France (%)
Place of birth for the foreign-born population - Germany (%)
Place of birth for the foreign-born population - Netherlands (%)
Place of birth for the foreign-born population - Switzerland (%)
Place of birth for the foreign-born population - Other Western Europe (%)
Place of birth for the foreign-born population - Greece (%)
Place of birth for the foreign-born population - Italy (%)
Place of birth for the foreign-born population - Portugal (%)
Place of birth for the foreign-born population - Spain (%)
Place of birth for the foreign-born population - Other Southern Europe (%)
Place of birth for the foreign-born population - Albania (%)
Place of birth for the foreign-born population - Belarus (%)
Place of birth for the foreign-born population - Bosnia and Herzegovina (%)
Place of birth for the foreign-born population - Bulgaria (%)
Place of birth for the foreign-born population - Croatia (%)
Place of birth for the foreign-born population - Czechoslovakia (%)
Place of birth for the foreign-born population - Hungary (%)
Place of birth for the foreign-born population - Latvia (%)
Place of birth for the foreign-born population - Lithuania (%)
Place of birth for the foreign-born population - North Macedonia (Macedonia) (%)
Place of birth for the foreign-born population - Moldova (%)
Place of birth for the foreign-born population - Poland (%)
Place of birth for the foreign-born population - Romania (%)
Place of birth for the foreign-born population - Russia (%)
Place of birth for the foreign-born population - Serbia (%)
Place of birth for the foreign-born population - Ukraine (%)
Place of birth for the foreign-born population - Other Eastern Europe (%)
Place of birth for the foreign-born population - China (%)
Place of birth for the foreign-born population - Hong Kong (%)
Place of birth for the foreign-born population - Taiwan (%)
Place of birth for the foreign-born population - Japan (%)
Place of birth for the foreign-born population - Korea (%)
Place of birth for the foreign-born population - Other Eastern Asia (%)
Place of birth for the foreign-born population - Afghanistan (%)
Place of birth for the foreign-born population - Bangladesh (%)
Place of birth for the foreign-born population - India (%)
Place of birth for the foreign-born population - Iran (%)
Place of birth for the foreign-born population - Kazakhstan (%)
Place of birth for the foreign-born population - Nepal (%)
Place of birth for the foreign-born population - Pakistan (%)
Place of birth for the foreign-born population - Sri Lanka (%)
Place of birth for the foreign-born population - Uzbekistan (%)
Place of birth for the foreign-born population - Other South Central Asia (%)
Place of birth for the foreign-born population - Burma (%)
Place of birth for the foreign-born population - Cambodia (%)
Place of birth for the foreign-born population - Indonesia (%)
Place of birth for the foreign-born population - Laos (%)
Place of birth for the foreign-born population - Malaysia (%)
Place of birth for the foreign-born population - Philippines (%)
Place of birth for the foreign-born population - Singapore (%)
Place of birth for the foreign-born population - Thailand (%)
Place of birth for the foreign-born population - Vietnam (%)
Place of birth for the foreign-born population - Other South Eastern Asia (%)
Place of birth for the foreign-born population - Armenia (%)
Place of birth for the foreign-born population - Iraq (%)
Place of birth for the foreign-born population - Israel (%)
Place of birth for the foreign-born population - Jordan (%)
Place of birth for the foreign-born population - Kuwait (%)
Place of birth for the foreign-born population - Lebanon (%)
Place of birth for the foreign-born population - Saudi Arabia (%)
Place of birth for the foreign-born population - Syria (%)
Place of birth for the foreign-born population - Turkey (%)
Place of birth for the foreign-born population - Yemen (%)
Place of birth for the foreign-born population - Other Western Asia (%)
Place of birth for the foreign-born population - Eritrea (%)
Place of birth for the foreign-born population - Ethiopia (%)
Place of birth for the foreign-born population - Kenya (%)
Place of birth for the foreign-born population - Somalia (%)
Place of birth for the foreign-born population - Uganda (%)
Place of birth for the foreign-born population - Zimbabwe (%)
Place of birth for the foreign-born population - Other Eastern Africa (%)
Place of birth for the foreign-born population - Cameroon (%)
Place of birth for the foreign-born population - Congo (%)
Place of birth for the foreign-born population - Democratic Republic of Congo (Zaire) (%)
Place of birth for the foreign-born population - Other Middle Africa (%)
Place of birth for the foreign-born population - Egypt (%)
Place of birth for the foreign-born population - Morocco (%)
Place of birth for the foreign-born population - Sudan (%)
Place of birth for the foreign-born population - Other Northern Africa (%)
Place of birth for the foreign-born population - South Africa (%)
Place of birth for the foreign-born population - Other Southern Africa (%)
Place of birth for the foreign-born population - Cabo Verde (%)
Place of birth for the foreign-born population - Ghana (%)
Place of birth for the foreign-born population - Liberia (%)
Place of birth for the foreign-born population - Nigeria (%)
Place of birth for the foreign-born population - Senegal (%)
Place of birth for the foreign-born population - Sierra Leone (%)
Place of birth for the foreign-born population - Other Western Africa (%)
Place of birth for the foreign-born population - Australia (%)
Place of birth for the foreign-born population - New Zealand (%)
Place of birth for the foreign-born population - Fiji (%)
Place of birth for the foreign-born population - Micronesia (%)
Place of birth for the foreign-born population - Bahamas (%)
Place of birth for the foreign-born population - Barbados (%)
Place of birth for the foreign-born population - Cuba (%)
Place of birth for the foreign-born population - Dominica (%)
Place of birth for the foreign-born population - Dominican Republic (%)
Place of birth for the foreign-born population - Grenada (%)
Place of birth for the foreign-born population - Haiti (%)
Place of birth for the foreign-born population - Jamaica (%)
Place of birth for the foreign-born population - St. Vincent and the Grenadines (%)
Place of birth for the foreign-born population - Trinidad and Tobago (%)
Place of birth for the foreign-born population - West Indies (%)
Place of birth for the foreign-born population - Other Caribbean (%)
Place of birth for the foreign-born population - Belize (%)
Place of birth for the foreign-born population - Costa Rica (%)
Place of birth for the foreign-born population - El Salvador (%)
Place of birth for the foreign-born population - Guatemala (%)
Place of birth for the foreign-born population - Honduras (%)
Place of birth for the foreign-born population - Mexico (%)
Place of birth for the foreign-born population - Nicaragua (%)
Place of birth for the foreign-born population - Panama (%)
Place of birth for the foreign-born population - Other Central America (%)
Place of birth for the foreign-born population - Argentina (%)
Place of birth for the foreign-born population - Bolivia (%)
Place of birth for the foreign-born population - Brazil (%)
Place of birth for the foreign-born population - Chile (%)
Place of birth for the foreign-born population - Colombia (%)
Place of birth for the foreign-born population - Ecuador (%)
Place of birth for the foreign-born population - Guyana (%)
Place of birth for the foreign-born population - Peru (%)
Place of birth for the foreign-born population - Uruguay (%)
Place of birth for the foreign-born population - Venezuela (%)
Place of birth for the foreign-born population - Other South America (%)
Place of birth for the foreign-born population - Canada (%)
Place of birth for the foreign-born population - Other Northern America (%)
Place of birth for the foreign-born population - Other (%)
Latest news about races in Chicago, IL collected exclusively by city-data.com from local newspapers, TV, and radio stations
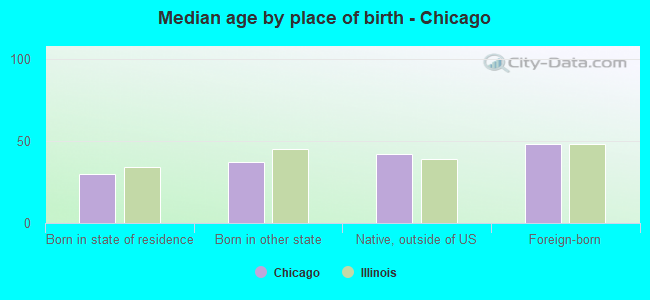
According to 2022 data, the most numerous races in Chicago, IL are White alone (846,127 residents), Hispanic (802,087 residents), and Black alone (726,170 residents). 64.1% of Chicago residents speak English at home. 20.6% of Chicago, IL residents are foreign-born (11.0% born in Latin America, 5.2% born in Asia, 3.2% born in Europe), which is 32.0% greater than the foreign-born rate of 14.0% across the entire state of Illinois.
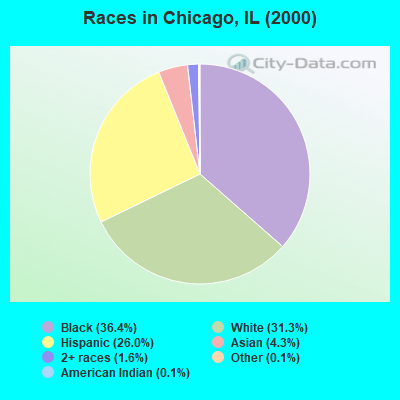
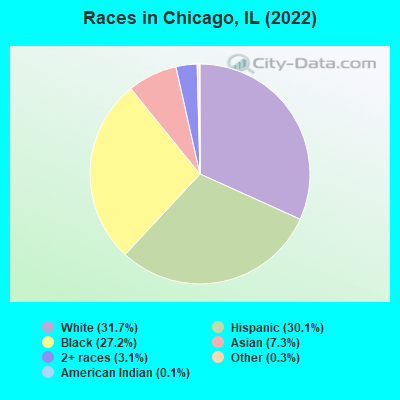
Race distribution in Chicago
2000 2022
1,053,739 36.4% Black alone 907,166 31.3% White alone 753,644 26.0% Hispanic 124,437 4.3% Asian alone 47,474 1.6% Two or more races 4,331 0.1% Other race alone 4,253 0.1% American Indian alone 972 0.03% Native Hawaiian and Other
846,127 31.7% White alone 802,087 30.1% Hispanic 726,170 27.2% Black alone 194,819 7.3% Asian alone 82,584 3.1% Two or more races 9,196 0.3% Other race alone 3,017 0.1% American Indian alone 1,064 0.04% Native Hawaiian and Other
2000 2022
8,424,140 67.8% White alone 1,856,152 14.9% Black alone 1,530,262 12.3% Hispanic 419,916 3.4% Asian alone 153,996 1.2% Two or more races 13,479 0.1% Other race alone 18,232 0.1% American Indian alone 3,116 0.03% Native Hawaiian and Other
7,356,301 58.5% White alone 2,299,726 18.3% Hispanic 1,660,423 13.2% Black alone 747,296 5.9% Asian alone 458,599 3.6% Two or more races 45,386 0.4% Other race alone 10,405 0.08% American Indian alone 3,896 0.03% Native Hawaiian and Other
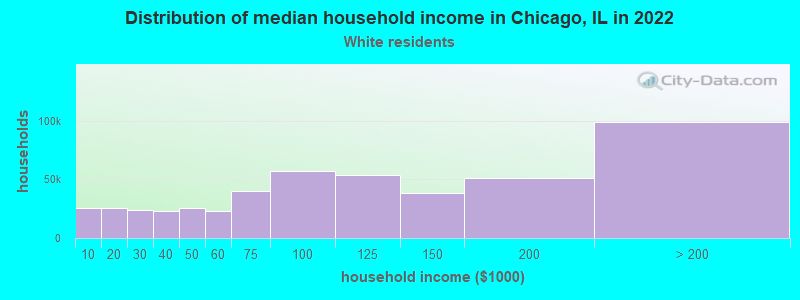
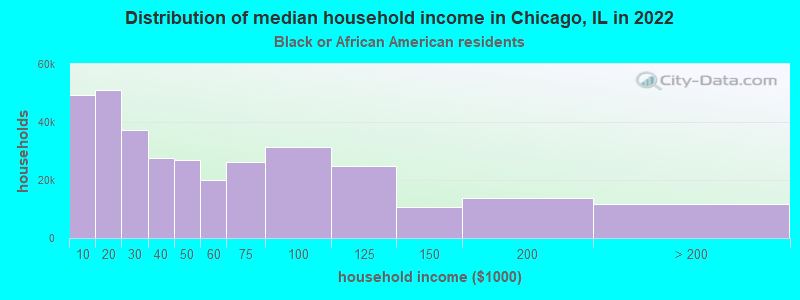
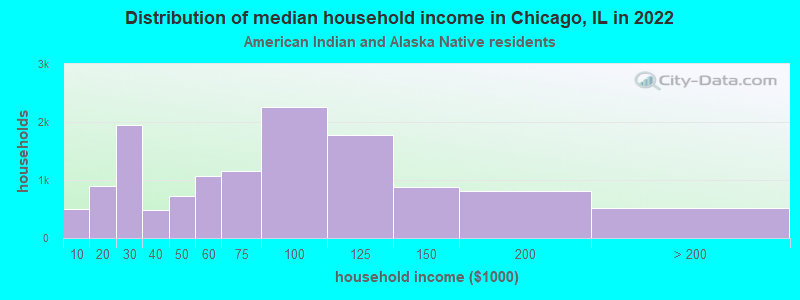
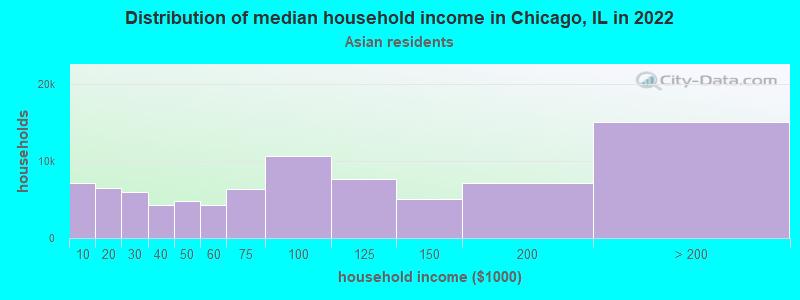
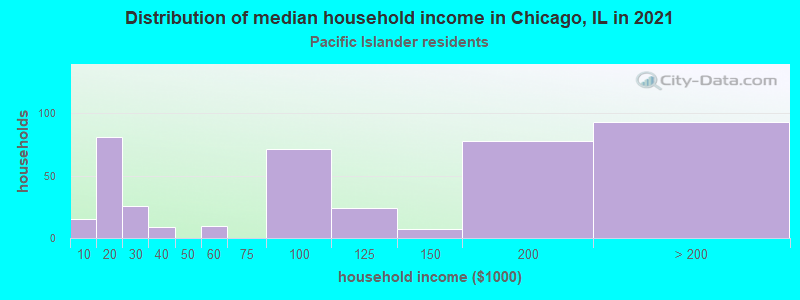
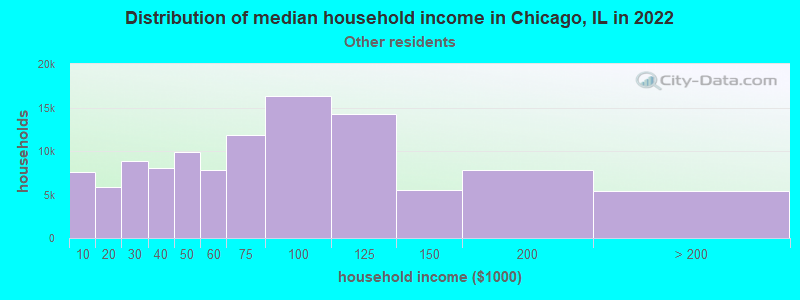
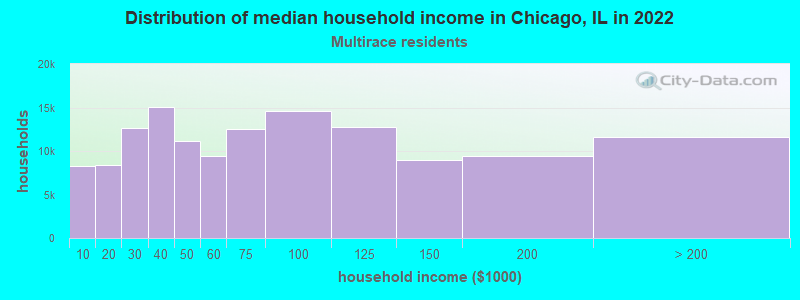
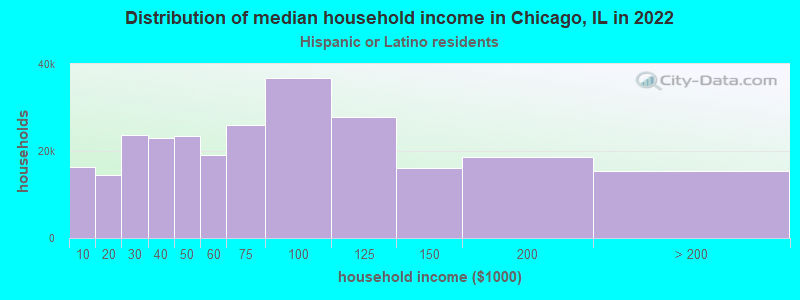
Income and house value in Chicago Median household income in 2022 $102,737 White non-Hispanic householders$40,184 Black householders$69,891 American Indian and Alaska Native householders$80,818 Asian householders$83,700 Native Hawaiian and other Pacific Islander householders$67,625 Some other race householders$63,358 Two or more races householders$65,497 Hispanic or Latino race householdersMedian 2022 house value $357,591 White Non-Hispanic householders$199,747 Black or African American householders$293,108 American Indian or Alaska Native householders $368,013 Asian householders$293,108 Native Hawaiian and other Pacific Islander householders$276,390 Some other race householders$302,661 Two or more races householders$281,818 Hispanic or Latino householders
Median age by race in Chicago
36.5 Median age for White residents37.0 35.9 37.9 Median age for Black or African American residents35.0 40.8 36.0 Median age for American Indian / Alaska Native residents37.1 33.9 35.9 Median age for Asian residents35.1 36.8 35.5 Median age for Native Hawaiian / Pacific Islander residents38.9 34.7 32.5 Median age for Other race residents32.4 32.6 32.7 Median age for Two or more races residents32.8 32.6 37.5 Median age for White alone residents37.9 37.0 32.4 Median age for Hispanic or Latino residents32.5 32.3
Owner/renter occupied households by race in Chicago
House owners and renters - White residents 248,518 51.2% Owner occupied237,232 48.8% Renter occupiedHouse owners and renters - Black or African American residents 114,302 34.6% Owner occupied216,356 65.4% Renter occupiedHouse owners and renters - American Indian / Alaska Native residents 7,089 54.4% Owner occupied5,942 45.6% Renter occupiedHouse owners and renters - Asian residents 42,430 49.9% Owner occupied42,625 50.1% Renter occupiedHouse owners and renters - Native Hawaiian / Pacific Islander residents 365 44.3% Owner occupied459 55.7% Renter occupiedHouse owners and renters - Other race residents 56,770 51.9% Owner occupied52,610 48.1% Renter occupiedHouse owners and renters - Two or more races residents 60,924 45.2% Owner occupied73,802 54.8% Renter occupiedHouse owners and renters - White alone residents 229,933 51.2% Owner occupied219,333 48.8% Renter occupiedHouse owners and renters - Hispanic or Latino residents 131,939 50.6% Owner occupied128,988 49.4% Renter occupied
Language usage in Chicago
English speakers - Total 64.1% of residents of Chicago speak English at home.
24.3% of residents speak Spanish at home 355,225 58.0% Speak English very well257,022 42.0% Speak English less than very well11.6% of residents speak other language at home 180,375 61.7% Speak English very well112,132 38.3% Speak English less than very well
English speakers - Born in the United States 89.9% of residents of Chicago speak English at home.
6.3% of residents speak Spanish at home 24,668 79.2% Speak English very well6,471 20.8% Speak English less than very well3.8% of residents speak other language at home 16,902 91.4% Speak English very well1,582 8.6% Speak English less than very well
English speakers - Native, born elsewhere 29.7% of residents of Chicago speak English at home.
60.1% of residents speak Spanish at home 18,748 59.1% Speak English very well12,948 40.9% Speak English less than very well10.2% of residents speak other language at home 3,997 74.3% Speak English very well1,385 25.7% Speak English less than very well
English speakers - Foreign-born 11.3% of residents of Chicago speak English at home.
49.0% of residents speak Spanish at home 75,654 28.3% Speak English very well191,357 71.7% Speak English less than very well39.8% of residents speak other language at home 113,199 52.2% Speak English very well103,580 47.8% Speak English less than very well
White (Caucasian) - Speak only English Native:
88.6% (693,376)Foreign-born:
16.1% (19,325)
White (Caucasian) - Speak another language Native:
11.4% (89,201)Foreign-born:
83.9% (101,069)
Black or African American - Speak only English Native:
97.6% (651,324)Foreign-born:
37.3% (10,651)
Black or African American - Speak another language Native:
2.4% (16,118)Foreign-born:
62.7% (17,882)
American Indian / Alaska Native - Speak only English Native:
28.7% (6,087)Foreign-born:
3.0% (385)
American Indian / Alaska Native - Speak another language Native:
71.3% (15,113)Foreign-born:
97.0% (12,322)
Asian - Speak only English Native:
56.3% (33,732)Foreign-born:
12.4% (16,046)
Asian - Speak another language Native:
43.7% (26,135)Foreign-born:
87.6% (113,150)
Native Hawaiian / Pacific Islander - Speak only English Native:
59.5% (742)Foreign-born:
21.6% (96)
Native Hawaiian / Pacific Islander - Speak another language Native:
34.1% (425)Foreign-born:
81.5% (361)
Other race - Speak only English Native:
24.8% (50,853)Foreign-born:
5.1% (6,994)
Other race - Speak another language Native:
75.2% (153,981)Foreign-born:
94.9% (130,952)
Two or more races - Speak only English Native:
49.3% (117,034)Foreign-born:
6.9% (8,001)
Two or more races - Speak another language Native:
50.7% (120,325)Foreign-born:
93.1% (108,281)
White alone - Speak only English Native:
93.0% (661,664)Foreign-born:
18.3% (18,032)
White alone - Speak another language Native:
7.0% (49,632)Foreign-born:
81.7% (80,626)
Hispanic or Latino - Speak only English Native:
30.9% (146,586)Foreign-born:
5.2% (14,375)
Hispanic or Latino - Speak another language Native:
69.1% (327,257)Foreign-born:
94.8% (264,551)
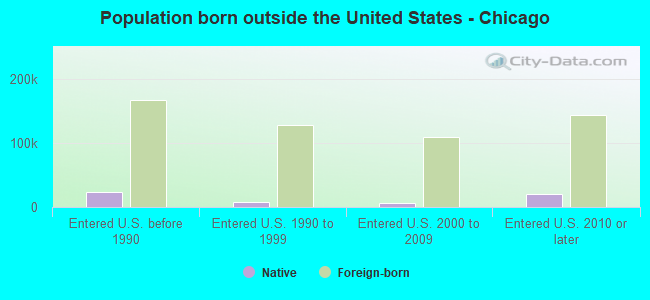
Foreign-born residents in Chicago 548,452 residents are foreign born (11.0% Latin America , 5.2% Asia , 3.2% Europe ).
This city:
20.6%Illinois:
14.4%
Marital status for residents in Chicago Marital status - White (Caucasian) population 15 years and over
Males 48.0% Never married42.8% Now married0.8% Separated1.9% Widowed6.5% DivorcedFemales 45.9% Never married37.9% Now married0.8% Separated7.3% Widowed8.0% DivorcedWomen who gave birth in the past 12 months Now married:
80.7% (8,225)Unmarried:
19.3% (1,963)
Women who did not give birth in the past 12 months Now married:
33.1% (86,217)Unmarried:
66.9% (174,512)
Marital status - Black or African American population 15 years and over
Males 59.8% Never married23.7% Now married3.0% Separated3.3% Widowed10.3% DivorcedFemales 55.3% Never married17.7% Now married3.9% Separated10.4% Widowed12.7% DivorcedWomen who gave birth in the past 12 months Now married:
32.2% (3,206)Unmarried:
67.8% (6,763)
Women who did not give birth in the past 12 months Now married:
17.4% (30,832)Unmarried:
82.6% (146,590)
Marital status - American Indian / Alaska Native population 15 years and over
Males 50.6% Never married40.5% Now married1.7% Separated0.3% Widowed7.0% DivorcedFemales 50.8% Never married41.3% Now married1.6% Separated2.2% Widowed4.2% DivorcedWomen who gave birth in the past 12 months Now married:
48.5% (199)Unmarried:
51.5% (211)
Women who did not give birth in the past 12 months Now married:
37.2% (3,489)Unmarried:
62.8% (5,884)
Marital status - Asian population 15 years and over
Males 43.9% Never married47.3% Now married1.2% Separated1.8% Widowed5.8% DivorcedFemales 36.2% Never married46.9% Now married3.5% Separated8.2% Widowed5.2% DivorcedWomen who gave birth in the past 12 months Now married:
98.1% (3,974)Unmarried:
1.9% (79)
Women who did not give birth in the past 12 months Now married:
43.4% (23,761)Unmarried:
56.6% (30,969)
Marital status - Native Hawaiian / Pacific Islander population 15 years and over
Males 44.5% Never married54.3% Now married0.0% Separated1.2% Widowed0.0% DivorcedFemales 51.0% Never married38.6% Now married6.1% Separated0.0% Widowed4.3% DivorcedWomen who gave birth in the past 12 months Now married:
47.6% (15)Unmarried:
52.4% (17)
Women who did not give birth in the past 12 months Now married:
38.4% (275)Unmarried:
61.6% (442)
Marital status - Other race population 15 years and over
Males 49.2% Never married42.0% Now married1.9% Separated1.4% Widowed5.5% DivorcedFemales 45.4% Never married39.4% Now married4.3% Separated4.7% Widowed6.1% DivorcedWomen who gave birth in the past 12 months Now married:
48.9% (1,425)Unmarried:
51.1% (1,487)
Women who did not give birth in the past 12 months Now married:
36.8% (34,805)Unmarried:
63.2% (59,715)
Marital status - Two or more races population 15 years and over
Males 48.4% Never married40.8% Now married2.2% Separated3.1% Widowed5.5% DivorcedFemales 46.8% Never married36.9% Now married2.6% Separated5.6% Widowed8.2% DivorcedWomen who gave birth in the past 12 months Now married:
59.3% (1,972)Unmarried:
40.7% (1,353)
Women who did not give birth in the past 12 months Now married:
32.1% (31,614)Unmarried:
67.9% (66,960)
Marital status - White alone, not Hispanic / Latino population 15 years and over
Males 47.4% Never married43.3% Now married0.6% Separated1.9% Widowed6.8% DivorcedFemales 45.0% Never married39.0% Now married0.6% Separated7.5% Widowed7.9% DivorcedWomen who gave birth in the past 12 months Now married:
85.0% (7,493)Unmarried:
15.0% (1,318)
Women who did not give birth in the past 12 months Now married:
34.0% (78,469)Unmarried:
66.0% (152,636)
Marital status - Hispanic or Latino population 15 years and over
Males 48.5% Never married42.0% Now married2.3% Separated2.2% Widowed5.0% DivorcedFemales 46.3% Never married37.8% Now married3.4% Separated5.0% Widowed7.4% DivorcedWomen who gave birth in the past 12 months Now married:
49.8% (3,592)Unmarried:
50.2% (3,627)
Women who did not give birth in the past 12 months Now married:
34.2% (72,588)Unmarried:
65.8% (139,866)
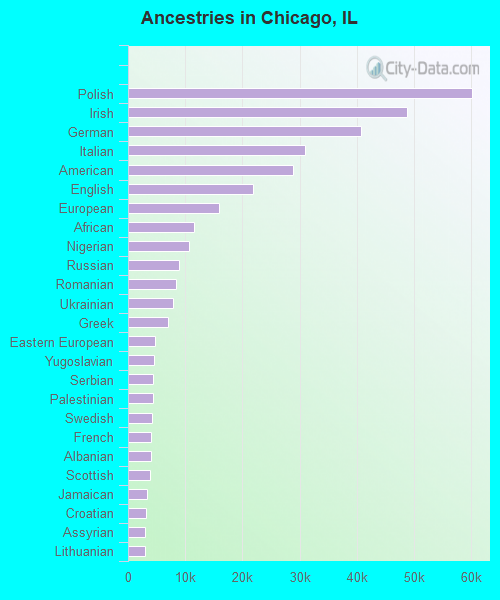
Ancestries in Chicago
60,114 3.7% Polish48,737 3.0% Irish40,661 2.5% German30,975 1.9% Italian28,791 1.8% American21,797 1.4% English15,902 1.0% European11,570 0.7% African10,686 0.7% Nigerian8,880 0.6% Russian8,423 0.5% Romanian7,825 0.5% Ukrainian7,036 0.4% Greek4,642 0.3% Eastern European4,496 0.3% Yugoslavian4,421 0.3% Serbian4,401 0.3% Palestinian4,180 0.3% Swedish4,064 0.3% French3,975 0.2% Albanian3,832 0.2% Scottish3,350 0.2% Jamaican3,187 0.2% Croatian2,968 0.2% Assyrian2,943 0.2% Lithuanian2,800 0.2% Dutch2,759 0.2% Brazilian2,593 0.2% Ethiopian2,584 0.2% Haitian2,381 0.1% Bulgarian2,233 0.1% Czech2,232 0.1% Iranian2,150 0.1% Norwegian2,101 0.1% Belizean1,815 0.1% British1,811 0.1% Turkish1,788 0.1% Ghanaian1,394 0.09% Afghan1,384 0.09% Syrian1,287 0.08% Northern European1,251 0.08% Egyptian1,242 0.08% Liberian1,054 0.07% Sudanese1,028 0.06% West Indian1,022 0.06% Austrian1,002 0.06% Macedonian944 0.06% Armenian938 0.06% Slovene891 0.06% Somali839 0.05% Hungarian785 0.05% Scotch-Irish778 0.05% Lebanese769 0.05% Danish765 0.05% Canadian736 0.05% Slovak682 0.04% French Canadian637 0.04% Jordanian578 0.04% Portuguese561 0.03% Kenyan531 0.03% Latvian503 0.03% Scandinavian498 0.03% Welsh493 0.03% Belgian434 0.03% Australian366 0.02% Senegalese346 0.02% Arab331 0.02% Finnish283 0.02% Luxembourger259 0.02% Swiss224 0.01% Moroccan192 0.01% Icelander192 0.01% Guyanese173 0.01% Barbadian171 0.01% Israeli169 0.01% Slavic163 0.01% Basque140 0.01% Ugandan137 0.01% Czechoslovakian135 0.01% Iraqi134 0.01% South African134 0.01% Bahamian90 0.01% Trinidadian and Tobagonian
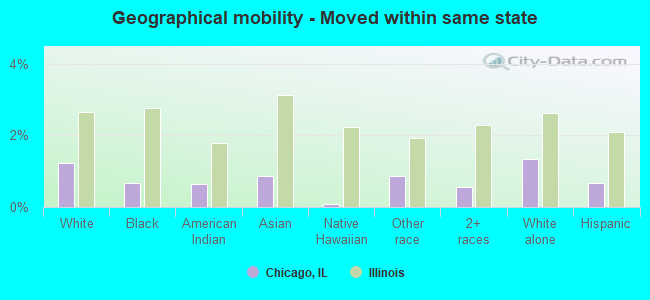
Geographical mobility in Chicago Same house 1 year ago 756,094 80.6% White (Caucasian)645,853 88.6% Black or African American28,152 86.6% American Indian / Alaska Native155,380 79.9% Asian1,362 90.9% Native Hawaiian / Pacific Islander327,103 90.6% Other race324,216 86.1% Two or more races669,157 79.8% White alone, not Hispanic / Latino709,296 89.4% Hispanic or LatinoMoved within same county 116,102 12.4% White / Caucasian61,765 8.5% Black or African American3,327 10.2% American Indian / Alaska Native22,557 11.6% Asian113 7.5% Native Hawaiian / Pacific Islander24,318 6.7% Other race35,597 9.5% Two or more races106,101 12.7% White alone, not Hispanic / Latino61,984 7.8% Hispanic or LatinoMoved within same state 11,598 1.2% White / Caucasian4,938 0.7% Black or African American210 0.6% American Indian / Alaska Native1,712 0.9% Asian1 0.1% Native Hawaiian / Pacific Islander3,175 0.9% Other race2,054 0.5% Two or more races11,262 1.3% White alone, not Hispanic / Latino5,213 0.7% Hispanic or LatinoMoved from different state 46,925 5.0% White / Caucasian13,588 1.9% Black or African American433 1.3% American Indian / Alaska Native9,020 4.6% Asian16 1.1% Native Hawaiian / Pacific Islander3,786 1.0% Other race9,346 2.5% Two or more races45,409 5.4% White alone, not Hispanic / Latino10,377 1.3% Hispanic or LatinoMoved from abroad 7,588 0.8% White2,586 0.4% Black or African American542 1.7% American Indian / Alaska Native5,853 3.0% Asian11 0.7% Native Hawaiian / Pacific Islander2,733 0.8% Other race5,273 1.4% Two or more races6,790 0.8% White alone, not Hispanic / Latino6,741 0.8% Hispanic or Latino
Children Nativity (place of birth) in Chicago
Children under 6 years - Living with two parents Both parents native 52,208 100.0% NativeBoth parents foreign-born 17,575 92.2% Native1,486 7.8% Foreign-bornOne native, one foreign-born parent 16,462 100.0% NativeChildren under 6 years - Living with one parent Native parent 64,280 99.6% Native252 0.4% Foreign-bornForeign-born parent 8,398 77.0% Native2,503 23.0% Foreign-bornChildren 6 to 17 years - Living with two parents Both parents native 74,827 99.9% Native51 0.1% Foreign-bornBoth parents foreign-born 44,288 86.4% Native6,956 13.6% Foreign-bornOne native, one foreign-born parent 31,567 98.7% Native400 1.3% Foreign-bornChildren 6 to 17 years - Living with one parent Native parent 130,352 100.0% NativeForeign-born parent 35,849 54.4% Native30,010 45.6% Foreign-born
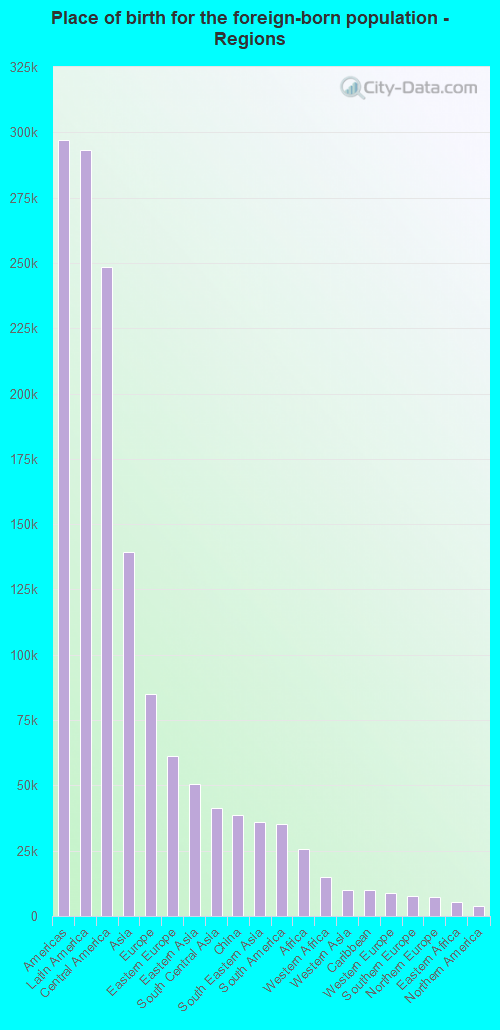
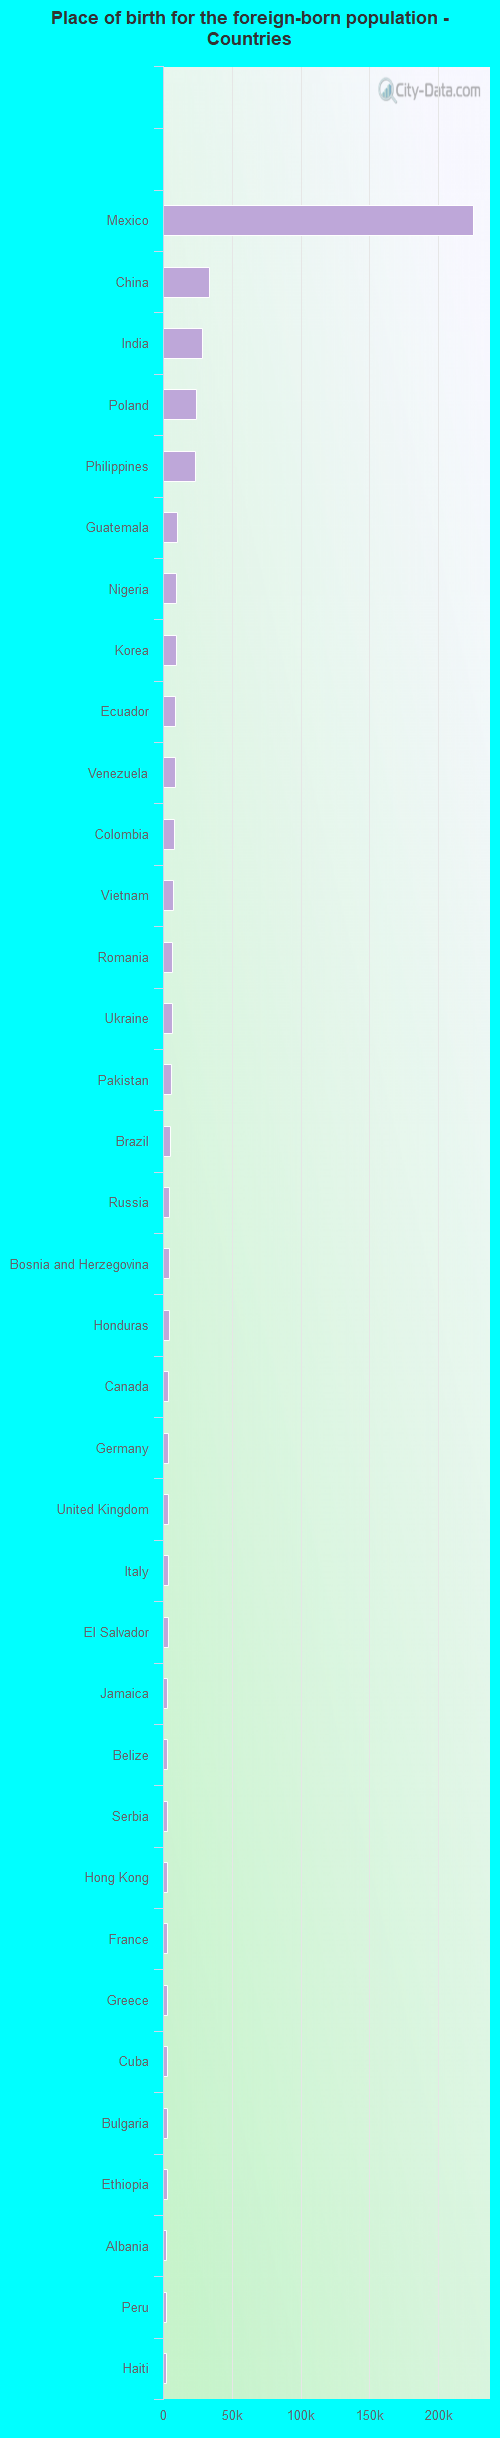
Place of birth for residents in Chicago 297,222 Americas293,290 Latin America248,392 Central America139,434 Asia85,135 Europe61,060 Eastern Europe50,465 Eastern Asia41,201 South Central Asia38,498 China36,058 South Eastern Asia35,037 South America25,472 Africa15,113 Western Africa9,949 Western Asia9,861 Caribbean8,877 Western Europe7,833 Southern Europe7,261 Northern Europe5,428 Eastern Africa3,932 Northern America2,108 Northern Africa1,349 Southern Africa1,189 Oceania973 Middle Africa937 Australia and New Zealand Subregion225,629 Mexico33,521 China28,095 India23,639 Poland23,020 Philippines9,878 Guatemala9,593 Nigeria9,414 Korea8,648 Ecuador8,436 Venezuela8,200 Colombia7,183 Vietnam6,763 Romania6,591 Ukraine5,469 Pakistan5,055 Brazil4,621 Russia4,411 Bosnia and Herzegovina4,098 Honduras3,932 Canada3,920 Germany3,717 United Kingdom3,504 Italy3,375 El Salvador3,270 Jamaica3,191 Belize3,116 Serbia3,089 Hong Kong2,997 France2,985 Greece2,852 Cuba2,729 Bulgaria2,656 Ethiopia2,422 Albania2,189 Peru2,136 Haiti2,013 Malaysia2,013 Japan1,937 Turkey1,923 Iraq1,888 Taiwan1,830 Ghana1,682 Iran1,581 Thailand1,562 Nicaragua1,459 Ireland1,455 Jordan1,454 Egypt1,434 Croatia1,411 Afghanistan1,350 Kenya1,349 South Africa1,318 England1,218 Bangladesh1,197 Israel1,124 Nepal1,103 Cambodia1,058 Spain1,014 Austria1,007 Chile949 Saudi Arabia933 Argentina905 Sri Lanka893 Syria855 Cameroon848 Dominican Republic773 Australia749 Somalia725 Lithuania680 Kazakhstan614 Lebanon509 Switzerland509 Costa Rica506 Trinidad and Tobago491 Liberia405 Morocco399 Indonesia361 Ivory Coast347 Senegal347 Kuwait344 Sierra Leone327 Uruguay324 Singapore305 Belarus293 Latvia286 Portugal263 Belgium251 Denmark248 Sweden240 Laos237 North Macedonia (Macedonia)235 Hungary230 Moldova212 Czechoslovakia197 Azerbaijan195 Burma (Myanmar)174 Netherlands164 New Zealand150 Panama141 Norway140 Uganda138 Algeria132 Armenia132 Bolivia128 United Arab Emirates118 Congo105 Yemen88 Eritrea88 Bahamas82 West Indies79 Barbados53 Zimbabwe53 Scotland49 Guyana
Grandparents responsible for own grandchildren in Chicago
Grandparents (30 to 59 years) White / Caucasian 415 28.4% Responsible for grandchildren1,048 71.6% Not responsible for grandchildrenBlack or African American 4,627 48.7% Responsible for grandchildren4,882 51.3% Not responsible for grandchildrenAmerican Indian / Alaska Native 14 6.8% Responsible for grandchildren193 93.2% Not responsible for grandchildrenAsian 201 23.6% Responsible for grandchildren649 76.4% Not responsible for grandchildrenNative Hawaiian / Pacific Islander 21 100.0% Responsible for grandchildrenOther race 2,600 29.7% Responsible for grandchildren6,160 70.3% Not responsible for grandchildrenTwo or more races 1,269 29.3% Responsible for grandchildren3,058 70.7% Not responsible for grandchildrenWhite alone, not Hispanic / Latino 552 52.6% Responsible for grandchildren497 47.4% Not responsible for grandchildrenHispanic or Latino 4,019 28.2% Responsible for grandchildren10,222 71.8% Not responsible for grandchildrenGrandparents (60 years and over) White / Caucasian 691 14.9% Responsible for grandchildren3,956 85.1% Not responsible for grandchildrenBlack or African American 3,020 30.4% Responsible for grandchildren6,928 69.6% Not responsible for grandchildrenAmerican Indian / Alaska Native 102 29.6% Responsible for grandchildren242 70.4% Not responsible for grandchildrenAsian 289 10.4% Responsible for grandchildren2,487 89.6% Not responsible for grandchildrenNative Hawaiian / Pacific Islander 6 100.0% Not responsible for grandchildrenOther race 1,170 22.7% Responsible for grandchildren3,978 77.3% Not responsible for grandchildrenTwo or more races 1,361 28.1% Responsible for grandchildren3,486 71.9% Not responsible for grandchildrenWhite alone, not Hispanic / Latino 1,009 21.3% Responsible for grandchildren3,718 78.7% Not responsible for grandchildrenHispanic or Latino 2,533 22.8% Responsible for grandchildren8,560 77.2% Not responsible for grandchildren
Zip codes: 60018 , 60068 , 60176 , 60601 , 60602 , 60603 , 60604 , 60605 , 60606 , 60607 , 60608 , 60609 , 60610 , 60611 , 60612 , 60613 , 60614 , 60615 , 60616 , 60617 , 60618 , 60619 , 60620 , 60621 , 60622 , 60623 , 60624 , 60625 , 60626 , 60628 , 60630 , 60631 , 60632 , 60634 , 60636 , 60637 , 60639 , 60640 , 60641 , 60642 , 60643 , 60644 , 60645 , 60646 , 60647 , 60649 , 60651 , 60652 , 60653 , 60654 , 60655 , 60656 , 60657 , 60659 , 60660 , 60661 , 60706 , 60707 , 60714 .