Races in Cedar City, Utah (UT) Detailed Stats
Data:
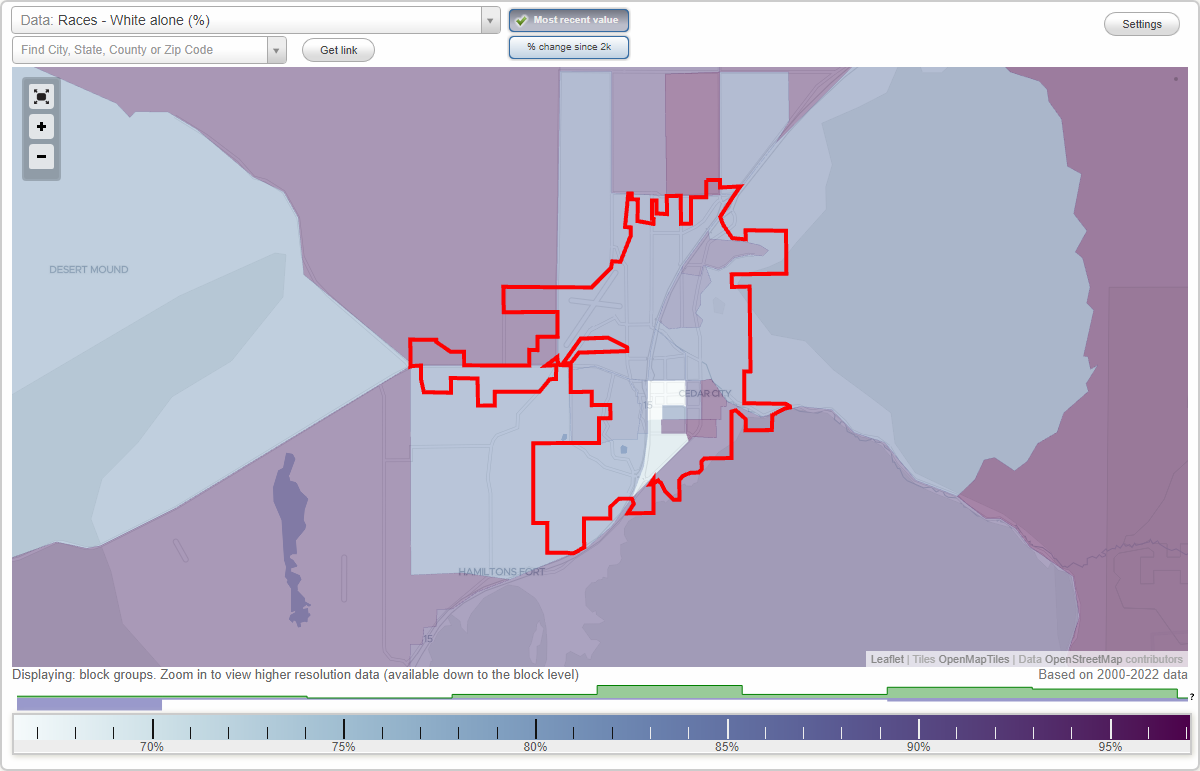
Races - White alone (%)
Races - White alone (% change since 2000)
Races - Black alone (%)
Races - Black alone (% change since 2000)
Races - American Indian alone (%)
Races - American Indian alone (% change since 2000)
Races - Asian alone (%)
Races - Asian alone (% change since 2000)
Races - Hispanic (%)
Races - Hispanic (% change since 2000)
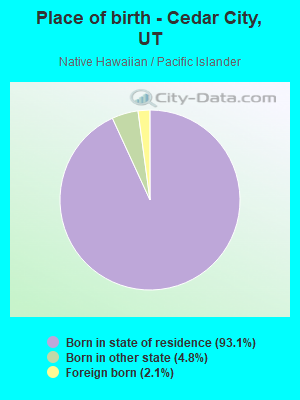
Races - Native Hawaiian and Other Pacific Islander alone (%)
Races - Native Hawaiian and Other Pacific Islander alone (% change since 2000)
Races - Two or more races(%)
Races - Two or more races(% change since 2000)
Races - Other race alone (%)
Races - Other race alone (% change since 2000)
Racial diversity
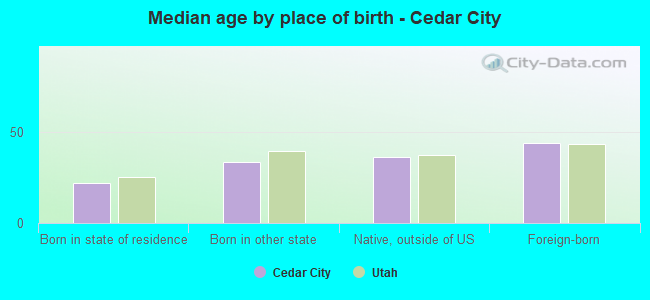
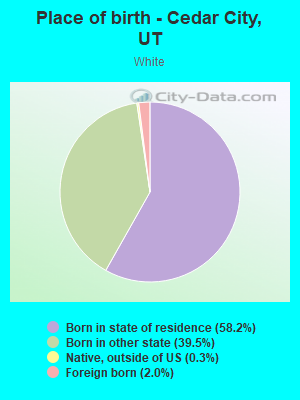
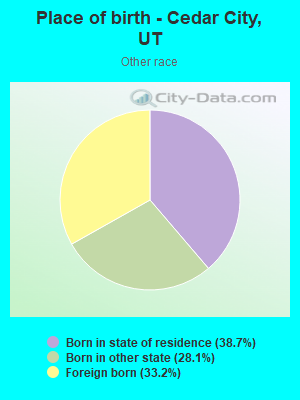
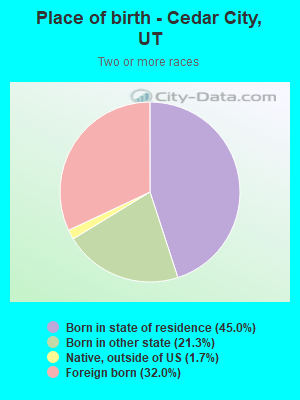
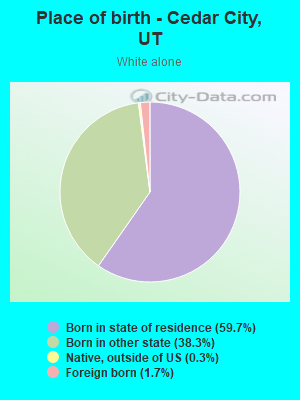
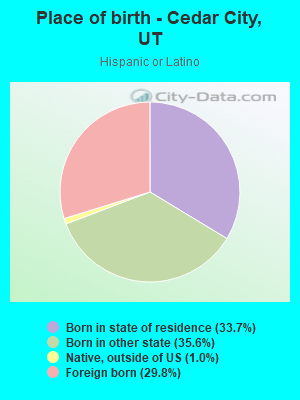
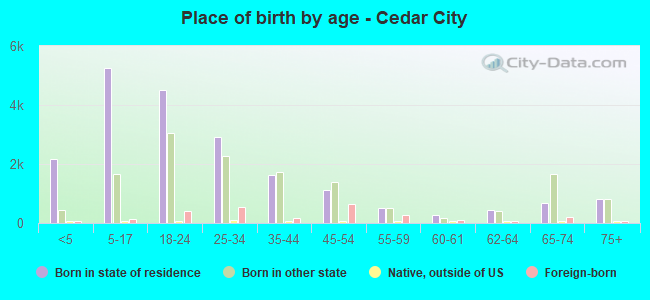
Place of birth - Born in state of residence (%)
Place of birth - Born in state of residence (%) - White
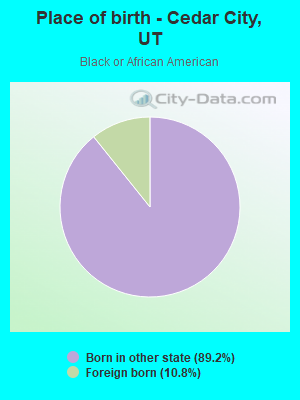
Place of birth - Born in state of residence (%) - Black or African American
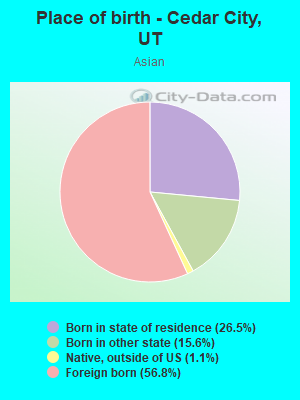
Place of birth - Born in state of residence (%) - Asian
Place of birth - Born in state of residence (%) - Hispanic or Latino
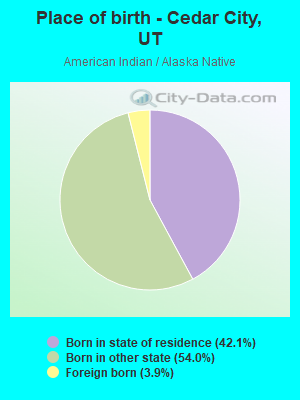
Place of birth - Born in state of residence (%) - American Indian and Alaska Native
Place of birth - Born in state of residence (%) - Multirace
Place of birth - Born in state of residence (%) - Other Race
Place of birth - Born in other state (%)
Place of birth - Born in other state (%) - White
Place of birth - Born in other state (%) - Black or African American
Place of birth - Born in other state (%) - Asian
Place of birth - Born in other state (%) - Hispanic or Latino
Place of birth - Born in other state (%) - American Indian and Alaska Native
Place of birth - Born in other state (%) - Multirace
Place of birth - Born in other state (%) - Other Race
Place of birth - Native, outside of US (%)
Place of birth - Native, outside of US (%) - White
Place of birth - Native, outside of US (%) - Black or African American
Place of birth - Native, outside of US (%) - Asian
Place of birth - Native, outside of US (%) - Hispanic or Latino
Place of birth - Native, outside of US (%) - American Indian and Alaska Native
Place of birth - Native, outside of US (%) - Multirace
Place of birth - Native, outside of US (%) - Other Race
Place of birth - Foreign born (%)
Place of birth - Foreign born (%) - White
Place of birth - Foreign born (%) - Black or African American
Place of birth - Foreign born (%) - Asian
Place of birth - Foreign born (%) - Hispanic or Latino
Place of birth - Foreign born (%) - American Indian and Alaska Native
Place of birth - Foreign born (%) - Multirace
Place of birth - Foreign born (%) - Other Race
Residents speaking English at home (%)
Residents speaking English at home - Born in the United States (%)
Residents speaking English at home - Native, born elsewhere (%)
Residents speaking English at home - Foreign born (%)
Residents speaking Spanish at home (%)
Residents speaking Spanish at home - Born in the United States (%)
Residents speaking Spanish at home - Native, born elsewhere (%)
Residents speaking Spanish at home - Foreign born (%)
Residents speaking other language at home (%)
Residents speaking other language at home - Born in the United States (%)
Residents speaking other language at home - Native, born elsewhere (%)
Residents speaking other language at home - Foreign born (%)
Marital status - Never married (%)
Marital status - Now married (%)
Marital status - Separated (%)
Marital status - Widowed (%)
Marital status - Divorced (%)
Ancestries Reported - Arab (%)
Ancestries Reported - Czech (%)
Ancestries Reported - Danish (%)
Ancestries Reported - Dutch (%)
Ancestries Reported - English (%)
Ancestries Reported - French (%)
Ancestries Reported - French Canadian (%)
Ancestries Reported - German (%)
Ancestries Reported - Greek (%)
Ancestries Reported - Hungarian (%)
Ancestries Reported - Irish (%)
Ancestries Reported - Italian (%)
Ancestries Reported - Lithuanian (%)
Ancestries Reported - Norwegian (%)
Ancestries Reported - Polish (%)
Ancestries Reported - Portuguese (%)
Ancestries Reported - Russian (%)
Ancestries Reported - Scotch-Irish (%)
Ancestries Reported - Scottish (%)
Ancestries Reported - Slovak (%)
Ancestries Reported - Subsaharan African (%)
Ancestries Reported - Swedish (%)
Ancestries Reported - Swiss (%)
Ancestries Reported - Ukrainian (%)
Ancestries Reported - United States (%)
Ancestries Reported - Welsh (%)
Ancestries Reported - West Indian (%)
Ancestries Reported - Other (%)
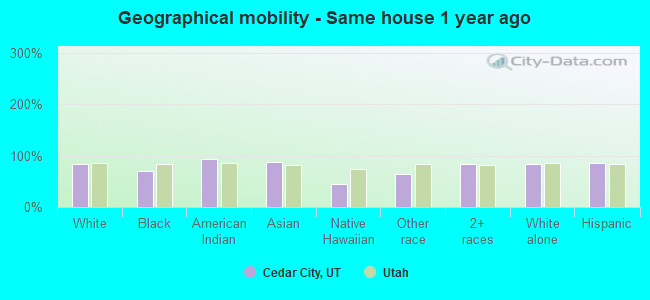
Geographical mobility - Same house 1 year ago (%)
Geographical mobility - Same house 1 year ago (%) - White
Geographical mobility - Same house 1 year ago (%) - Black or African American
Geographical mobility - Same house 1 year ago (%) - Asian
Geographical mobility - Same house 1 year ago (%) - Hispanic or Latino
Geographical mobility - Same house 1 year ago (%) - American Indian and Alaska Native
Geographical mobility - Same house 1 year ago (%) - Multirace
Geographical mobility - Same house 1 year ago (%) - Other Race
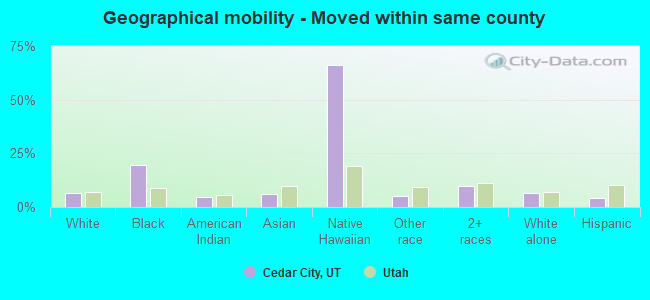
Geographical mobility - Moved within same county (%)
Geographical mobility - Moved within same county (%) - White
Geographical mobility - Moved within same county (%) - Black or African American
Geographical mobility - Moved within same county (%) - Asian
Geographical mobility - Moved within same county (%) - Hispanic or Latino
Geographical mobility - Moved within same county (%) - American Indian and Alaska Native
Geographical mobility - Moved within same county (%) - Multirace
Geographical mobility - Moved within same county (%) - Other Race
Geographical mobility - Moved from different county within same state (%)
Geographical mobility - Moved from different county within same state (%) - White
Geographical mobility - Moved from different county within same state (%) - Black or African American
Geographical mobility - Moved from different county within same state (%) - Asian
Geographical mobility - Moved from different county within same state (%) - Hispanic or Latino
Geographical mobility - Moved from different county within same state (%) - American Indian and Alaska Native
Geographical mobility - Moved from different county within same state (%) - Multirace
Geographical mobility - Moved from different county within same state (%) - Other Race
Geographical mobility - Moved from different state (%)
Geographical mobility - Moved from different state (%) - White
Geographical mobility - Moved from different state (%) - Black or African American
Geographical mobility - Moved from different state (%) - Asian
Geographical mobility - Moved from different state (%) - Hispanic or Latino
Geographical mobility - Moved from different state (%) - American Indian and Alaska Native
Geographical mobility - Moved from different state (%) - Multirace
Geographical mobility - Moved from different state (%) - Other Race
Geographical mobility - Moved from abroad (%)
Geographical mobility - Moved from abroad (%) - White
Geographical mobility - Moved from abroad (%) - Black or African American
Geographical mobility - Moved from abroad (%) - Asian
Geographical mobility - Moved from abroad (%) - Hispanic or Latino
Geographical mobility - Moved from abroad (%) - American Indian and Alaska Native
Geographical mobility - Moved from abroad (%) - Multirace
Geographical mobility - Moved from abroad (%) - Other Race
Place of birth for the foreign-born population - Ireland (%)
Place of birth for the foreign-born population - Denmark (%)
Place of birth for the foreign-born population - Norway (%)
Place of birth for the foreign-born population - Sweden (%)
Place of birth for the foreign-born population - United Kingdom (%)
Place of birth for the foreign-born population - England (%)
Place of birth for the foreign-born population - Scotland (%)
Place of birth for the foreign-born population - Other Northern Europe (%)
Place of birth for the foreign-born population - Austria (%)
Place of birth for the foreign-born population - Belgium (%)
Place of birth for the foreign-born population - France (%)
Place of birth for the foreign-born population - Germany (%)
Place of birth for the foreign-born population - Netherlands (%)
Place of birth for the foreign-born population - Switzerland (%)
Place of birth for the foreign-born population - Other Western Europe (%)
Place of birth for the foreign-born population - Greece (%)
Place of birth for the foreign-born population - Italy (%)
Place of birth for the foreign-born population - Portugal (%)
Place of birth for the foreign-born population - Spain (%)
Place of birth for the foreign-born population - Other Southern Europe (%)
Place of birth for the foreign-born population - Albania (%)
Place of birth for the foreign-born population - Belarus (%)
Place of birth for the foreign-born population - Bosnia and Herzegovina (%)
Place of birth for the foreign-born population - Bulgaria (%)
Place of birth for the foreign-born population - Croatia (%)
Place of birth for the foreign-born population - Czechoslovakia (%)
Place of birth for the foreign-born population - Hungary (%)
Place of birth for the foreign-born population - Latvia (%)
Place of birth for the foreign-born population - Lithuania (%)
Place of birth for the foreign-born population - North Macedonia (Macedonia) (%)
Place of birth for the foreign-born population - Moldova (%)
Place of birth for the foreign-born population - Poland (%)
Place of birth for the foreign-born population - Romania (%)
Place of birth for the foreign-born population - Russia (%)
Place of birth for the foreign-born population - Serbia (%)
Place of birth for the foreign-born population - Ukraine (%)
Place of birth for the foreign-born population - Other Eastern Europe (%)
Place of birth for the foreign-born population - China (%)
Place of birth for the foreign-born population - Hong Kong (%)
Place of birth for the foreign-born population - Taiwan (%)
Place of birth for the foreign-born population - Japan (%)
Place of birth for the foreign-born population - Korea (%)
Place of birth for the foreign-born population - Other Eastern Asia (%)
Place of birth for the foreign-born population - Afghanistan (%)
Place of birth for the foreign-born population - Bangladesh (%)
Place of birth for the foreign-born population - India (%)
Place of birth for the foreign-born population - Iran (%)
Place of birth for the foreign-born population - Kazakhstan (%)
Place of birth for the foreign-born population - Nepal (%)
Place of birth for the foreign-born population - Pakistan (%)
Place of birth for the foreign-born population - Sri Lanka (%)
Place of birth for the foreign-born population - Uzbekistan (%)
Place of birth for the foreign-born population - Other South Central Asia (%)
Place of birth for the foreign-born population - Burma (%)
Place of birth for the foreign-born population - Cambodia (%)
Place of birth for the foreign-born population - Indonesia (%)
Place of birth for the foreign-born population - Laos (%)
Place of birth for the foreign-born population - Malaysia (%)
Place of birth for the foreign-born population - Philippines (%)
Place of birth for the foreign-born population - Singapore (%)
Place of birth for the foreign-born population - Thailand (%)
Place of birth for the foreign-born population - Vietnam (%)
Place of birth for the foreign-born population - Other South Eastern Asia (%)
Place of birth for the foreign-born population - Armenia (%)
Place of birth for the foreign-born population - Iraq (%)
Place of birth for the foreign-born population - Israel (%)
Place of birth for the foreign-born population - Jordan (%)
Place of birth for the foreign-born population - Kuwait (%)
Place of birth for the foreign-born population - Lebanon (%)
Place of birth for the foreign-born population - Saudi Arabia (%)
Place of birth for the foreign-born population - Syria (%)
Place of birth for the foreign-born population - Turkey (%)
Place of birth for the foreign-born population - Yemen (%)
Place of birth for the foreign-born population - Other Western Asia (%)
Place of birth for the foreign-born population - Eritrea (%)
Place of birth for the foreign-born population - Ethiopia (%)
Place of birth for the foreign-born population - Kenya (%)
Place of birth for the foreign-born population - Somalia (%)
Place of birth for the foreign-born population - Uganda (%)
Place of birth for the foreign-born population - Zimbabwe (%)
Place of birth for the foreign-born population - Other Eastern Africa (%)
Place of birth for the foreign-born population - Cameroon (%)
Place of birth for the foreign-born population - Congo (%)
Place of birth for the foreign-born population - Democratic Republic of Congo (Zaire) (%)
Place of birth for the foreign-born population - Other Middle Africa (%)
Place of birth for the foreign-born population - Egypt (%)
Place of birth for the foreign-born population - Morocco (%)
Place of birth for the foreign-born population - Sudan (%)
Place of birth for the foreign-born population - Other Northern Africa (%)
Place of birth for the foreign-born population - South Africa (%)
Place of birth for the foreign-born population - Other Southern Africa (%)
Place of birth for the foreign-born population - Cabo Verde (%)
Place of birth for the foreign-born population - Ghana (%)
Place of birth for the foreign-born population - Liberia (%)
Place of birth for the foreign-born population - Nigeria (%)
Place of birth for the foreign-born population - Senegal (%)
Place of birth for the foreign-born population - Sierra Leone (%)
Place of birth for the foreign-born population - Other Western Africa (%)
Place of birth for the foreign-born population - Australia (%)
Place of birth for the foreign-born population - New Zealand (%)
Place of birth for the foreign-born population - Fiji (%)
Place of birth for the foreign-born population - Micronesia (%)
Place of birth for the foreign-born population - Bahamas (%)
Place of birth for the foreign-born population - Barbados (%)
Place of birth for the foreign-born population - Cuba (%)
Place of birth for the foreign-born population - Dominica (%)
Place of birth for the foreign-born population - Dominican Republic (%)
Place of birth for the foreign-born population - Grenada (%)
Place of birth for the foreign-born population - Haiti (%)
Place of birth for the foreign-born population - Jamaica (%)
Place of birth for the foreign-born population - St. Vincent and the Grenadines (%)
Place of birth for the foreign-born population - Trinidad and Tobago (%)
Place of birth for the foreign-born population - West Indies (%)
Place of birth for the foreign-born population - Other Caribbean (%)
Place of birth for the foreign-born population - Belize (%)
Place of birth for the foreign-born population - Costa Rica (%)
Place of birth for the foreign-born population - El Salvador (%)
Place of birth for the foreign-born population - Guatemala (%)
Place of birth for the foreign-born population - Honduras (%)
Place of birth for the foreign-born population - Mexico (%)
Place of birth for the foreign-born population - Nicaragua (%)
Place of birth for the foreign-born population - Panama (%)
Place of birth for the foreign-born population - Other Central America (%)
Place of birth for the foreign-born population - Argentina (%)
Place of birth for the foreign-born population - Bolivia (%)
Place of birth for the foreign-born population - Brazil (%)
Place of birth for the foreign-born population - Chile (%)
Place of birth for the foreign-born population - Colombia (%)
Place of birth for the foreign-born population - Ecuador (%)
Place of birth for the foreign-born population - Guyana (%)
Place of birth for the foreign-born population - Peru (%)
Place of birth for the foreign-born population - Uruguay (%)
Place of birth for the foreign-born population - Venezuela (%)
Place of birth for the foreign-born population - Other South America (%)
Place of birth for the foreign-born population - Canada (%)
Place of birth for the foreign-born population - Other Northern America (%)
Place of birth for the foreign-born population - Other (%)
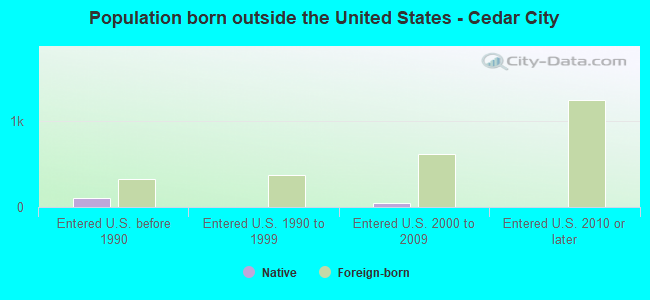
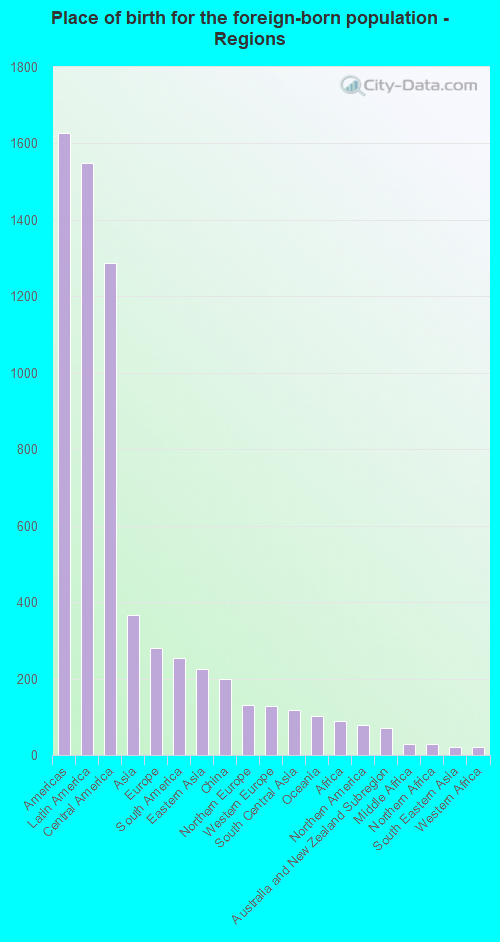
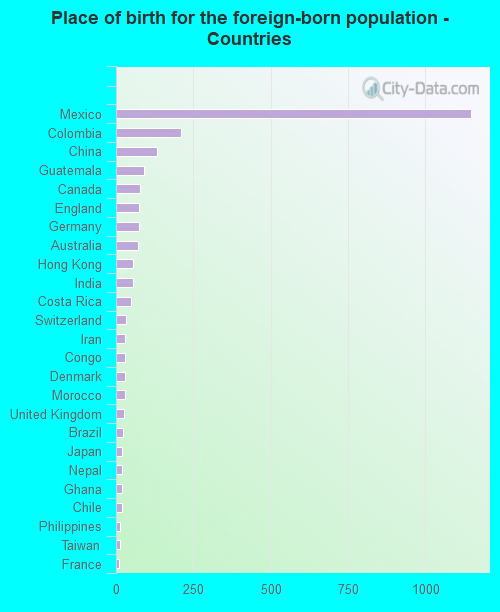
According to 2022 data, the most numerous races in Cedar City, UT are White alone (28,669 residents), Hispanic (5,178 residents), and Two or more races (1,031 residents). 88.2% of Cedar City residents speak English at home. 6.7% of Cedar City, UT residents are foreign-born (4.1% born in Latin America, 1.0% born in Asia, 0.7% born in Europe), which is 19.7% less than the foreign-born rate of 8.0% across the entire state of Utah.
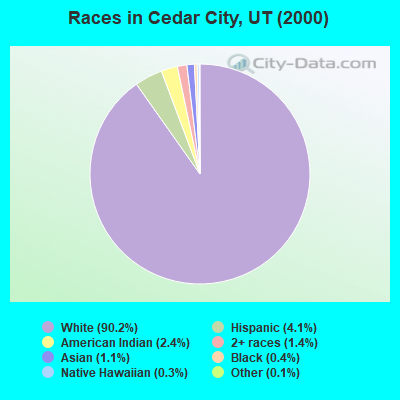
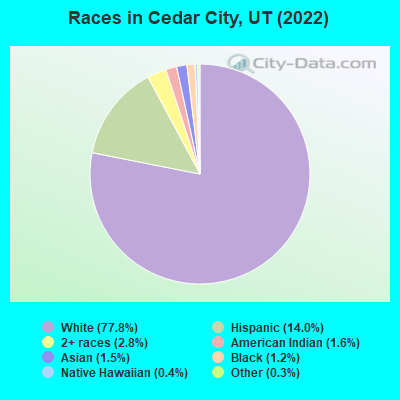
Race distribution in Cedar City
2000 2022
1,904,265 85.3% White alone 201,559 9.0% Hispanic 36,483 1.6% Asian alone 31,308 1.4% Two or more races 26,663 1.2% American Indian alone 14,806 0.7% Native Hawaiian and Other 16,137 0.7% Black alone 1,948 0.09% Other race alone
2,557,466 75.6% White alone 512,086 15.1% Hispanic 119,308 3.5% Two or more races 82,388 2.4% Asian alone 36,978 1.1% Native Hawaiian and Other 34,873 1.0% Black alone 22,803 0.7% American Indian alone 14,898 0.4% Other race alone
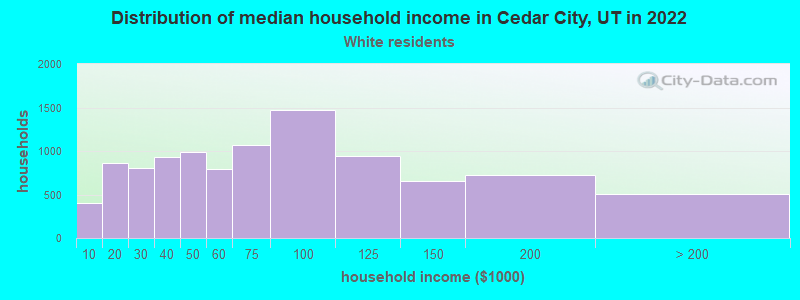
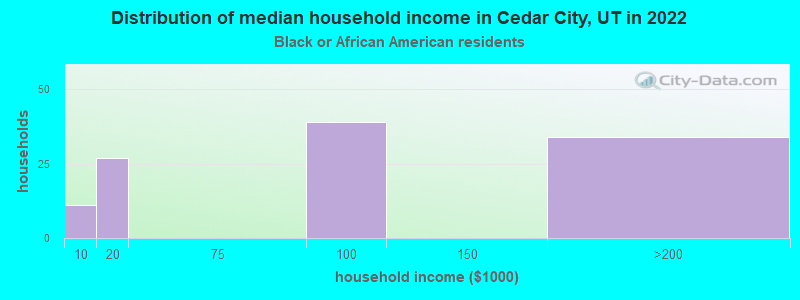
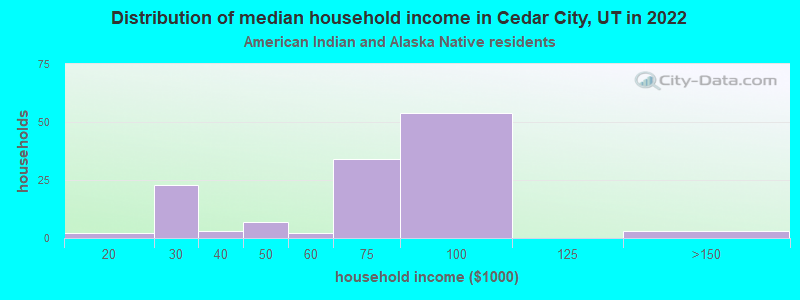
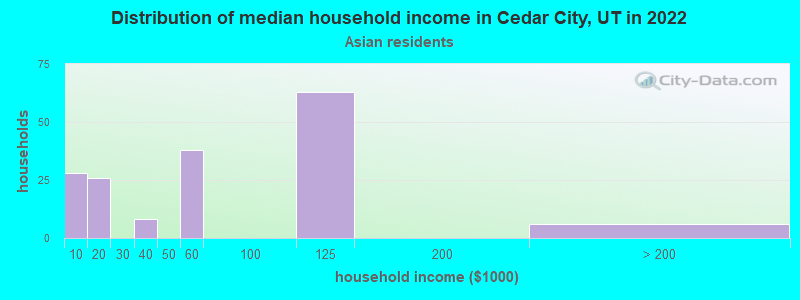
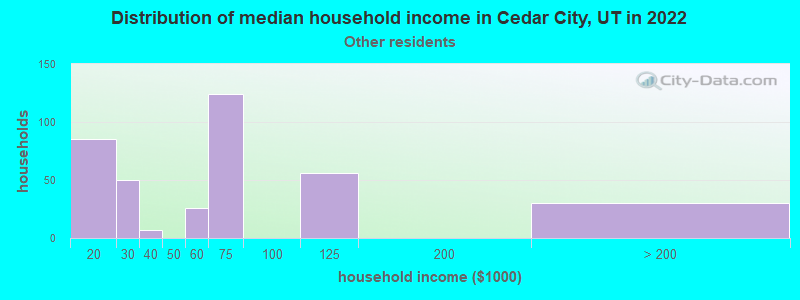
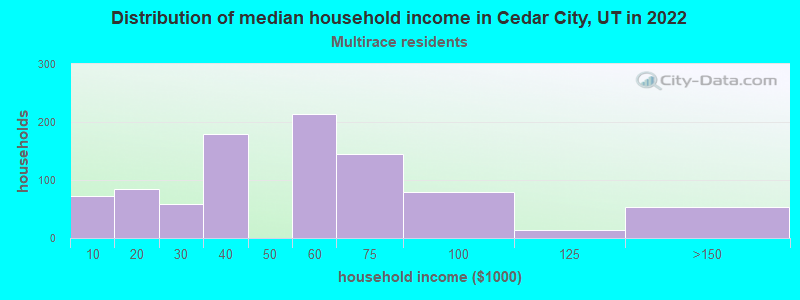
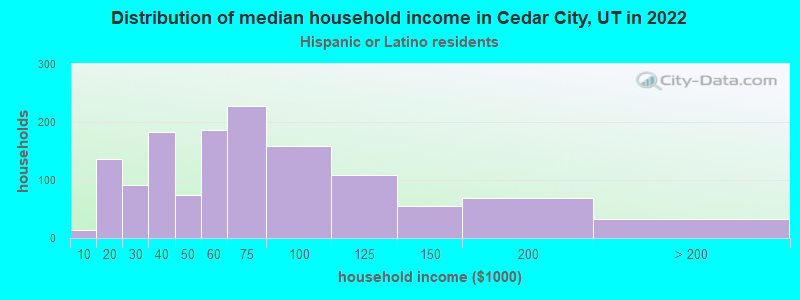
Income and house value in Cedar City Median household income in 2022 $63,452 White non-Hispanic householders$86,035 American Indian and Alaska Native householders$63,819 Some other race householders$38,882 Two or more races householders$58,229 Hispanic or Latino race householdersMedian 2022 house value $383,839 White Non-Hispanic householders$268,972 American Indian or Alaska Native householders $435,102 Asian householders$514,212 Native Hawaiian and other Pacific Islander householders$415,483 Some other race householders$581,930 Two or more races householders$380,358 Hispanic or Latino householders
Median age by race in Cedar City
27.1 Median age for White residents26.9 27.4 21.0 Median age for Black or African American residents21.7 21.2 28.5 Median age for American Indian / Alaska Native residents40.9 23.5 23.1 Median age for Asian residents27.4 21.0 23.1 Median age for Native Hawaiian / Pacific Islander residents23.0 22.0 30.1 Median age for Other race residents29.3 30.9 24.7 Median age for Two or more races residents22.0 28.1 27.9 Median age for White alone residents27.3 28.5 22.2 Median age for Hispanic or Latino residents21.2 22.9
Owner/renter occupied households by race in Cedar City
House owners and renters - White residents 5,912 57.7% Owner occupied4,326 42.3% Renter occupiedHouse owners and renters - Black or African American residents 113 100.0% Renter occupiedHouse owners and renters - American Indian / Alaska Native residents 75 52.0% Owner occupied70 48.0% Renter occupiedHouse owners and renters - Asian residents 134 78.9% Owner occupied36 21.1% Renter occupiedHouse owners and renters - Other race residents 230 56.6% Owner occupied177 43.4% Renter occupiedHouse owners and renters - Two or more races residents 612 66.6% Owner occupied307 33.4% Renter occupiedHouse owners and renters - White alone residents 5,911 59.2% Owner occupied4,074 40.8% Renter occupiedHouse owners and renters - Hispanic or Latino residents 684 49.8% Owner occupied690 50.2% Renter occupied
Language usage in Cedar City
English speakers - Total 88.2% of residents of Cedar City speak English at home.
8.6% of residents speak Spanish at home 1,636 55.2% Speak English very well1,329 44.8% Speak English less than very well3.1% of residents speak other language at home 873 82.3% Speak English very well188 17.7% Speak English less than very well
English speakers - Born in the United States 94.1% of residents of Cedar City speak English at home.
4.7% of residents speak Spanish at home 555 88.0% Speak English very well76 12.0% Speak English less than very well1.3% of residents speak other language at home 137 80.1% Speak English very well34 19.9% Speak English less than very well
English speakers - Native, born elsewhere 69.1% of residents of Cedar City speak English at home.
25.9% of residents speak Spanish at home 23 54.8% Speak English very well19 45.2% Speak English less than very well
English speakers - Foreign-born 27.1% of residents of Cedar City speak English at home.
55.6% of residents speak Spanish at home 277 20.2% Speak English very well1,091 79.8% Speak English less than very well19.3% of residents speak other language at home 321 67.4% Speak English very well155 32.6% Speak English less than very well
White (Caucasian) - Speak only English Native:
97.3% (26,493)Foreign-born:
50.6% (306)
White (Caucasian) - Speak another language Native:
3.0% (813)Foreign-born:
54.2% (327)
Black or African American - Speak only English Native:
91.5% (290)Foreign-born:
44.5% (20)
American Indian / Alaska Native - Speak another language Native:
41.4% (270)Foreign-born:
96.1% (26)
Asian - Speak only English Native:
90.5% (233)Foreign-born:
21.8% (74)
Native Hawaiian / Pacific Islander - Speak only English Native:
47.2% (70)Foreign-born:
74.0% (3)
Other race - Speak only English Native:
52.6% (427)Foreign-born:
33.9% (157)
Other race - Speak another language Native:
44.8% (364)Foreign-born:
74.2% (344)
Two or more races - Speak only English Native:
69.3% (1,625)Foreign-born:
12.0% (132)
Two or more races - Speak another language Native:
31.6% (741)Foreign-born:
86.7% (956)
White alone - Speak only English Native:
97.4% (25,647)Foreign-born:
68.2% (337)
White alone - Speak another language Native:
2.6% (677)Foreign-born:
33.3% (164)
Hispanic or Latino - Speak only English Native:
62.3% (1,914)Foreign-born:
14.3% (217)
Hispanic or Latino - Speak another language Native:
37.9% (1,165)Foreign-born:
86.3% (1,316)
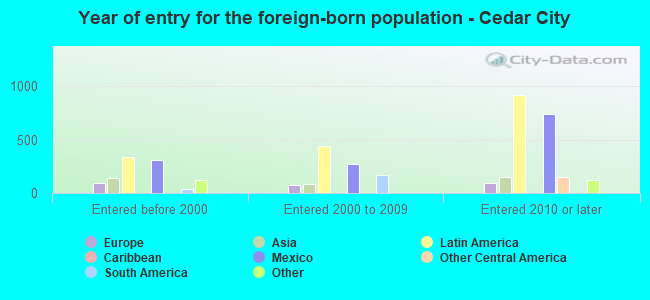
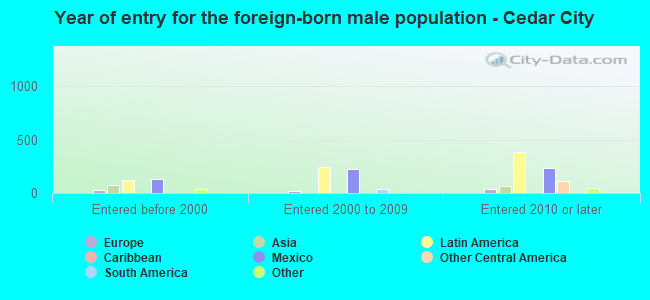
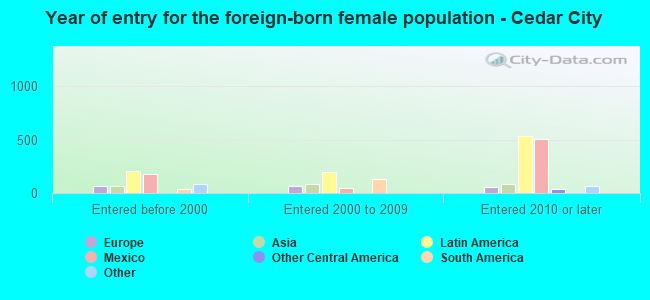
Foreign-born residents in Cedar City 2,465 residents are foreign born (4.1% Latin America , 1.0% Asia , 0.7% Europe ).
Marital status for residents in Cedar City Marital status - White (Caucasian) population 15 years and over
Males 36.2% Never married53.0% Now married1.5% Separated1.7% Widowed7.6% DivorcedFemales 36.1% Never married50.4% Now married0.8% Separated5.2% Widowed7.5% DivorcedWomen who gave birth in the past 12 months Now married:
91.7% (433)Unmarried:
8.3% (39)
Women who did not give birth in the past 12 months Now married:
42.4% (3,338)Unmarried:
57.6% (4,542)
Marital status - Black or African American population 15 years and over
Males 96.1% Never married3.9% Now married0.0% Separated0.0% Widowed0.0% DivorcedFemales 82.1% Never married0.0% Now married0.0% Separated0.0% Widowed17.9% DivorcedWomen who did not give birth in the past 12 months Now married:
0.0% (0)Unmarried:
100.0% (198)
Marital status - American Indian / Alaska Native population 15 years and over
Males 45.6% Never married24.9% Now married1.8% Separated9.5% Widowed18.3% DivorcedFemales 74.5% Never married23.7% Now married0.0% Separated1.9% Widowed0.0% DivorcedWomen who did not give birth in the past 12 months Now married:
5.8% (19)Unmarried:
94.2% (313)
Marital status - Asian population 15 years and over
Males 51.4% Never married39.5% Now married0.0% Separated0.0% Widowed9.0% DivorcedFemales 70.5% Never married22.6% Now married0.0% Separated0.0% Widowed6.8% DivorcedWomen who did not give birth in the past 12 months Now married:
20.8% (60)Unmarried:
79.2% (229)
Marital status - Native Hawaiian / Pacific Islander population 15 years and over
Males 100.0% Never married0.0% Now married0.0% Separated0.0% Widowed0.0% DivorcedFemales 33.3% Never married66.7% Now married0.0% Separated0.0% Widowed0.0% DivorcedWomen who did not give birth in the past 12 months Now married:
66.7% (17)Unmarried:
33.3% (9)
Marital status - Other race population 15 years and over
Males 41.7% Never married27.6% Now married0.0% Separated0.0% Widowed30.7% DivorcedFemales 41.9% Never married32.8% Now married1.3% Separated5.2% Widowed18.8% DivorcedWomen who gave birth in the past 12 months Now married:
100.0% (8)Unmarried:
0.0% (0)
Women who did not give birth in the past 12 months Now married:
30.8% (111)Unmarried:
69.2% (250)
Marital status - Two or more races population 15 years and over
Males 49.9% Never married40.2% Now married0.5% Separated0.0% Widowed9.3% DivorcedFemales 36.0% Never married39.8% Now married0.0% Separated0.0% Widowed24.2% DivorcedWomen who gave birth in the past 12 months Now married:
100.0% (32)Unmarried:
0.0% (0)
Women who did not give birth in the past 12 months Now married:
22.7% (183)Unmarried:
77.3% (625)
Marital status - White alone, not Hispanic / Latino population 15 years and over
Males 36.4% Never married53.1% Now married1.2% Separated1.8% Widowed7.5% DivorcedFemales 35.5% Never married50.7% Now married0.8% Separated5.4% Widowed7.6% DivorcedWomen who gave birth in the past 12 months Now married:
91.7% (443)Unmarried:
8.3% (40)
Women who did not give birth in the past 12 months Now married:
42.4% (3,236)Unmarried:
57.6% (4,397)
Marital status - Hispanic or Latino population 15 years and over
Males 42.4% Never married37.1% Now married3.0% Separated0.9% Widowed16.6% DivorcedFemales 38.8% Never married41.3% Now married0.3% Separated1.3% Widowed18.3% DivorcedWomen who gave birth in the past 12 months Now married:
100.0% (7)Unmarried:
0.0% (0)
Women who did not give birth in the past 12 months Now married:
32.5% (406)Unmarried:
67.5% (844)
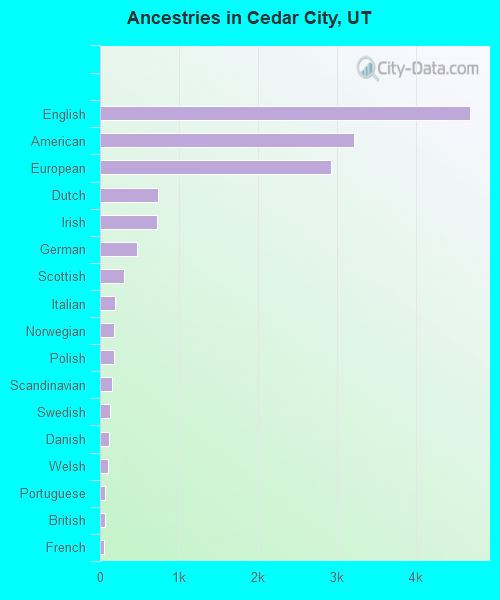
Ancestries in Cedar City
4,693 22.8% English3,220 15.7% American2,928 14.2% European735 3.6% Dutch718 3.5% Irish469 2.3% German307 1.5% Scottish185 0.9% Italian182 0.9% Norwegian173 0.8% Polish151 0.7% Scandinavian133 0.6% Swedish114 0.6% Danish101 0.5% Welsh68 0.3% Portuguese59 0.3% British53 0.3% French39 0.2% Hungarian36 0.2% Iranian35 0.2% Northern European27 0.1% Swiss25 0.1% Scotch-Irish25 0.1% African23 0.1% Lebanese21 0.1% French Canadian18 0.09% Russian16 0.08% Brazilian14 0.07% Romanian14 0.07% Ghanaian12 0.06% Greek6 0.03% Belgian5 0.02% Lithuanian
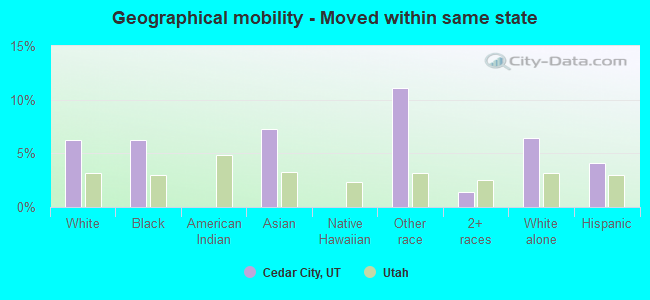
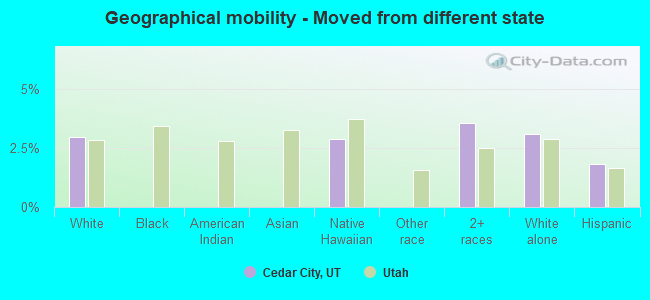
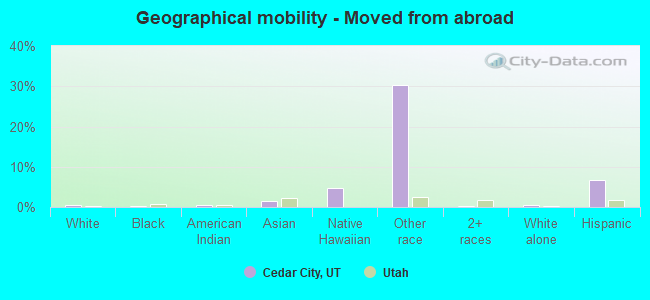
Geographical mobility in Cedar City Same house 1 year ago 24,865 84.2% White (Caucasian)300 69.4% Black or African American656 93.6% American Indian / Alaska Native517 86.8% Asian67 45.5% Native Hawaiian / Pacific Islander903 64.2% Other race2,848 84.2% Two or more races23,522 83.3% White alone, not Hispanic / Latino4,359 85.0% Hispanic or LatinoMoved within same county 1,892 6.4% White / Caucasian85 19.6% Black or African American32 4.6% American Indian / Alaska Native36 6.1% Asian97 66.3% Native Hawaiian / Pacific Islander71 5.1% Other race338 10.0% Two or more races1,907 6.8% White alone, not Hispanic / Latino207 4.0% Hispanic or LatinoMoved within same state 1,839 6.2% White / Caucasian27 6.2% Black or African American43 7.3% Asian156 11.1% Other race48 1.4% Two or more races1,810 6.4% White alone, not Hispanic / Latino209 4.1% Hispanic or LatinoMoved from different state 876 3.0% White / Caucasian4 2.9% Native Hawaiian / Pacific Islander120 3.5% Two or more races873 3.1% White alone, not Hispanic / Latino94 1.8% Hispanic or LatinoMoved from abroad 130 0.4% White1 0.3% Black or African American3 0.4% American Indian / Alaska Native9 1.4% Asian7 4.8% Native Hawaiian / Pacific Islander426 30.3% Other race4 0.1% Two or more races134 0.5% White alone, not Hispanic / Latino349 6.8% Hispanic or Latino
Children Nativity (place of birth) in Cedar City
Children under 6 years - Living with two parents Both parents native 2,274 100.0% NativeBoth parents foreign-born 123 100.0% NativeOne native, one foreign-born parent 76 100.0% NativeChildren under 6 years - Living with one parent Native parent 597 100.0% NativeChildren 6 to 17 years - Living with two parents Both parents native 3,881 99.8% Native8 0.2% Foreign-bornBoth parents foreign-born 137 51.5% Native130 48.5% Foreign-bornOne native, one foreign-born parent 805 100.0% NativeChildren 6 to 17 years - Living with one parent Native parent 1,037 100.0% NativeForeign-born parent 238 50.7% Native231 49.3% Foreign-born
Grandparents responsible for own grandchildren in Cedar City
Grandparents (30 to 59 years) White / Caucasian 111 64.9% Responsible for grandchildren60 35.1% Not responsible for grandchildrenTwo or more races 23 100.0% Responsible for grandchildrenWhite alone, not Hispanic / Latino 123 66.1% Responsible for grandchildren63 33.9% Not responsible for grandchildrenHispanic or Latino 8 100.0% Responsible for grandchildren
Grandparents (60 years and over) White / Caucasian 5 2.1% Responsible for grandchildren243 97.9% Not responsible for grandchildrenWhite alone, not Hispanic / Latino 5 2.2% Responsible for grandchildren233 97.8% Not responsible for grandchildrenHispanic or Latino 22 100.0% Not responsible for grandchildren