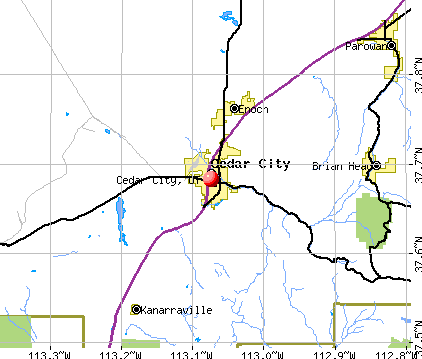
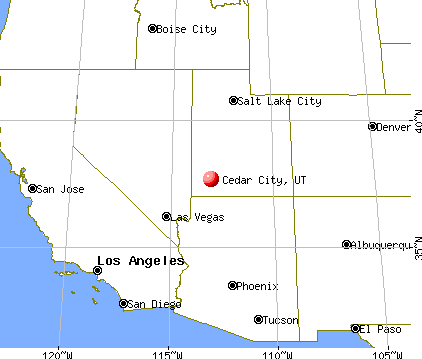
Cedar City, Utah
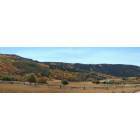
Cedar City: Cedar Highlands 1 Oct 2005
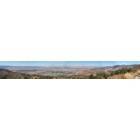
Cedar City: Photo was taken of the view from Cedar City's BIG C mountain.
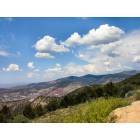
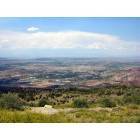
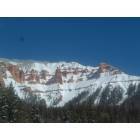
Cedar City: Photo was taken from Cedar City's "BIG C" mountain. Photo is of the view of the mountains to the right of the C.
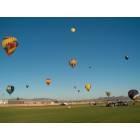
Cedar City: Picture of hot air balloons at SkyFest in September 2008
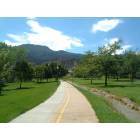
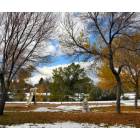
Cedar City: walk through the park
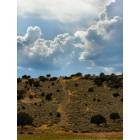
Cedar City: Photo was taken near Home Depot in Cedar City, Utah. I call it the road to heaven.
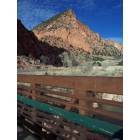
Cedar City: winter drive
Cedar City: Coal Creek Parkway Trail in Mouth of Cedar Canyon
Cedar City: Cedar City 1 Oct 2005
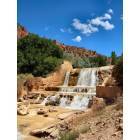
Cedar City: A view of a man made waterfall off of the Coal Creek Parkway Trail found in Cedar Canyon. You can start this trail in many places one can be found at Canyon Park.
Cedar City: Canyon Park in Cedar City, Utah.
- see
20
more - add
your
Submit your own pictures of this city and show them to the world
- OSM Map
- General Map
- Google Map
- MSN Map
Population change since 2000: +88.5%
| Males: 19,478 | |
| Females: 19,214 |
| Median resident age: | 26.6 years |
| Utah median age: | 32.1 years |
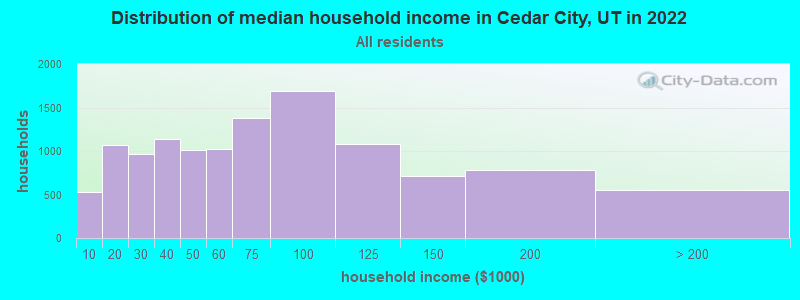
| Cedar City: | $62,412 |
| UT: | $89,168 |
Estimated per capita income in 2022: $26,569 (it was $14,057 in 2000)
Cedar City city income, earnings, and wages data
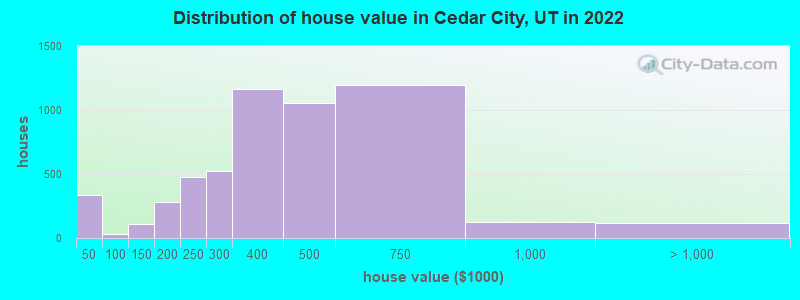
Estimated median house or condo value in 2022: $376,245 (it was $118,900 in 2000)
| Cedar City: | $376,245 |
| UT: | $499,500 |
Median gross rent in 2022: $984.
(17.4% for White Non-Hispanic residents, 40.5% for Black residents, 15.7% for Hispanic or Latino residents, 14.8% for American Indian residents, 26.4% for other race residents, 15.5% for two or more races residents)
Detailed information about poverty and poor residents in Cedar City, UT


- 28,66977.8%White alone
- 5,17814.0%Hispanic
- 1,0312.8%Two or more races
- 5971.6%American Indian alone
- 5591.5%Asian alone
- 4361.2%Black alone
- 1410.4%Native Hawaiian and Other
Pacific Islander alone - 1160.3%Other race alone
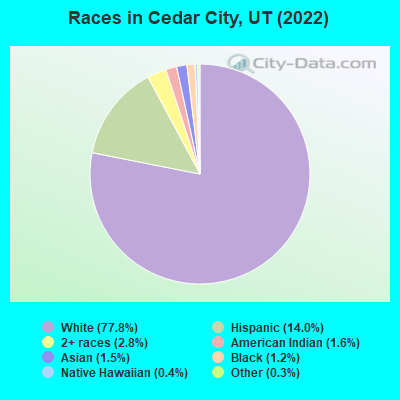
Races in Cedar City detailed stats: ancestries, foreign born residents, place of birth
According to our research of Utah and other state lists, there were 113 registered sex offenders living in Cedar City, Utah as of April 27, 2024.
The ratio of all residents to sex offenders in Cedar City is 273 to 1.
Type |
2009 |
2010 |
2011 |
2012 |
2013 |
2014 |
2015 |
2016 |
2017 |
2018 |
2019 |
2020 |
2021 |
2022 |
|---|---|---|---|---|---|---|---|---|---|---|---|---|---|---|
| Murders (per 100,000) | 2 (6.8) | 2 (6.9) | 0 (0.0) | 1 (3.4) | 3 (10.3) | 1 (3.4) | 0 (0.0) | 1 (3.3) | 0 (0.0) | 1 (3.1) | 0 (0.0) | 3 (8.5) | 2 (5.4) | 0 (0.0) |
| Rapes (per 100,000) | 18 (60.9) | 15 (52.0) | 12 (40.8) | 17 (57.4) | 21 (72.0) | 12 (41.1) | 14 (47.3) | 13 (42.7) | 9 (28.5) | 8 (24.8) | 22 (65.4) | 22 (62.0) | 20 (54.2) | 14 (35.7) |
| Robberies (per 100,000) | 7 (23.7) | 5 (17.3) | 4 (13.6) | 3 (10.1) | 3 (10.3) | 6 (20.5) | 4 (13.5) | 3 (9.9) | 5 (15.8) | 2 (6.2) | 2 (5.9) | 2 (5.6) | 3 (8.1) | 2 (5.1) |
| Assaults (per 100,000) | 15 (50.7) | 24 (83.2) | 36 (122.4) | 55 (185.8) | 51 (174.8) | 59 (201.9) | 63 (212.7) | 50 (164.3) | 56 (177.1) | 59 (183.0) | 69 (205.3) | 36 (101.4) | 23 (62.3) | 15 (38.2) |
| Burglaries (per 100,000) | 105 (355.1) | 161 (557.9) | 175 (595.0) | 117 (395.2) | 120 (411.2) | 124 (424.4) | 81 (273.4) | 116 (381.1) | 110 (347.8) | 119 (369.1) | 78 (232.0) | 77 (217.0) | 49 (132.8) | 54 (137.5) |
| Thefts (per 100,000) | 610 (2,063) | 622 (2,155) | 693 (2,356) | 600 (2,026) | 529 (1,813) | 609 (2,084) | 517 (1,745) | 484 (1,590) | 492 (1,556) | 571 (1,771) | 510 (1,517) | 415 (1,169) | 331 (896.9) | 420 (1,070) |
| Auto thefts (per 100,000) | 31 (104.8) | 33 (114.4) | 31 (105.4) | 28 (94.6) | 28 (96.0) | 34 (116.4) | 39 (131.7) | 35 (115.0) | 37 (117.0) | 61 (189.2) | 44 (130.9) | 47 (132.4) | 25 (67.7) | 43 (109.5) |
| Arson (per 100,000) | 2 (6.8) | 3 (10.4) | 5 (17.0) | 1 (3.4) | 0 (0.0) | 0 (0.0) | 6 (20.3) | 0 (0.0) | 12 (37.9) | 4 (12.4) | 0 (0.0) | 0 (0.0) | 2 (5.4) | 3 (7.6) |
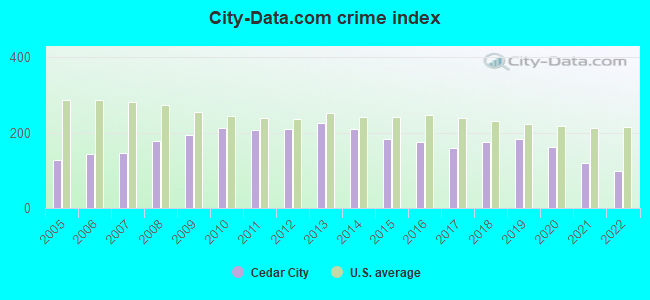
| City-Data.com crime index | 195.2 | 211.7 | 205.5 | 209.2 | 225.2 | 208.6 | 183.9 | 176.0 | 158.9 | 176.3 | 182.6 | 161.0 | 119.7 | 98.9 |
The City-Data.com crime index weighs serious crimes and violent crimes more heavily. Higher means more crime, U.S. average is 246.1. It adjusts for the number of visitors and daily workers commuting into cities.
Crime rate in Cedar City detailed stats: murders, rapes, robberies, assaults, burglaries, thefts, arson
Full-time law enforcement employees in 2021, including police officers: 46 (39 officers - 38 male; 1 female).
| Officers per 1,000 residents here: | 1.06 |
| Utah average: | 1.67 |
 Recent articles from our blog. Our writers, many of them Ph.D. graduates or candidates, create easy-to-read articles on a wide variety of topics.

 | Cedar City - A Utah town is running dry. Its solution stoked an age-old water war (12 replies) |
| Possible move to Cedar City, UT (61 replies) |
| New friends in Cedar City? (1 reply) |
| Semi retirement in Cedar City area (1 reply) |
| blm land surrounding cedar city (9 replies) |
| Average electricity, water bills in Cedar City (condo)? (7 replies) |
Latest news from Cedar City, UT collected exclusively by city-data.com from local newspapers, TV, and radio stations
Ancestries: English (19.5%), European (17.9%), American (17.0%), Dutch (3.6%), Irish (3.5%), German (2.3%).
Current Local Time: MST time zone
Elevation: 5834 feet
Land area: 20.1 square miles.
Population density: 1,926 people per square mile (low).
2,465 residents are foreign born (4.1% Latin America, 1.0% Asia, 0.7% Europe).
| This city: | 6.7% |
| Utah: | 8.4% |
Median real estate property taxes paid for housing units with mortgages in 2022: $1,518 (0.4%)
Median real estate property taxes paid for housing units with no mortgage in 2022: $1,536 (0.4%)
Nearest city with pop. 50,000+: Sunrise Manor, NV  (151.4 miles , pop. 156,120).
Nearest city with pop. 200,000+: Las Vegas, NV (157.1 miles , pop. 478,434).
Nearest city with pop. 1,000,000+: Phoenix, AZ (292.8 miles , pop. 1,321,045).
Nearest cities:
), ), )Latitude: 37.68 N, Longitude: 113.07 W
Daytime population change due to commuting: +3,553 (+9.6%)
Workers who live and work in this city: 17,216 (94.4%)
Area code: 435

Cedar City, Utah accommodation & food services, waste management - Economy and Business Data
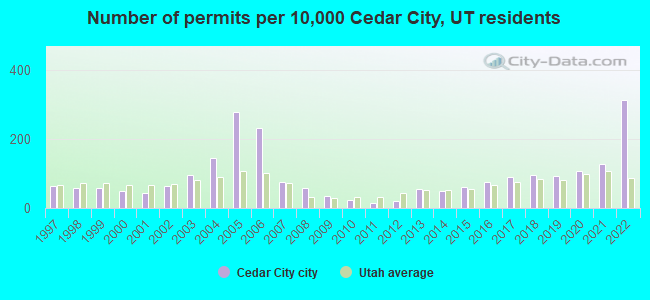
Single-family new house construction building permits:
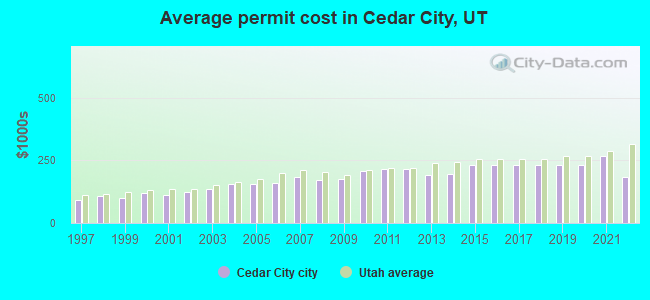
- 2022: 646 buildings, average cost: $183,400
- 2021: 263 buildings, average cost: $266,900
- 2020: 224 buildings, average cost: $232,900
- 2019: 191 buildings, average cost: $232,900
- 2018: 194 buildings, average cost: $232,900
- 2017: 183 buildings, average cost: $232,900
- 2016: 157 buildings, average cost: $232,900
- 2015: 128 buildings, average cost: $232,900
- 2014: 102 buildings, average cost: $194,200
- 2013: 110 buildings, average cost: $191,900
- 2012: 39 buildings, average cost: $215,500
- 2011: 29 buildings, average cost: $215,700
- 2010: 48 buildings, average cost: $206,900
- 2009: 73 buildings, average cost: $174,800
- 2008: 116 buildings, average cost: $169,800
- 2007: 157 buildings, average cost: $181,900
- 2006: 476 buildings, average cost: $160,500
- 2005: 573 buildings, average cost: $154,300
- 2004: 295 buildings, average cost: $157,000
- 2003: 196 buildings, average cost: $134,500
- 2002: 133 buildings, average cost: $125,200
- 2001: 91 buildings, average cost: $110,100
- 2000: 100 buildings, average cost: $117,800
- 1999: 118 buildings, average cost: $99,100
- 1998: 118 buildings, average cost: $106,900
- 1997: 132 buildings, average cost: $90,100
| Here: | 2.4% |
| Utah: | 2.5% |
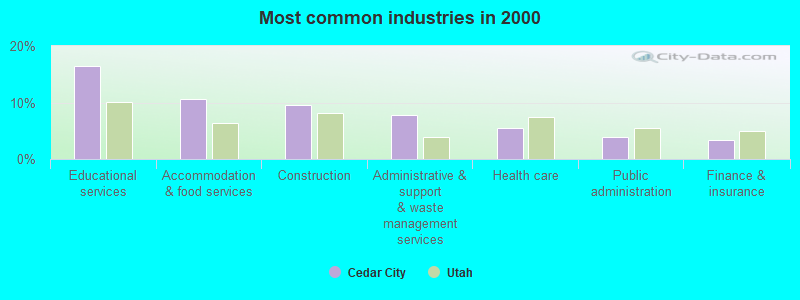
- Educational services (16.4%)
- Accommodation & food services (10.7%)
- Construction (9.5%)
- Administrative & support & waste management services (7.7%)
- Health care (5.5%)
- Public administration (3.9%)
- Finance & insurance (3.5%)
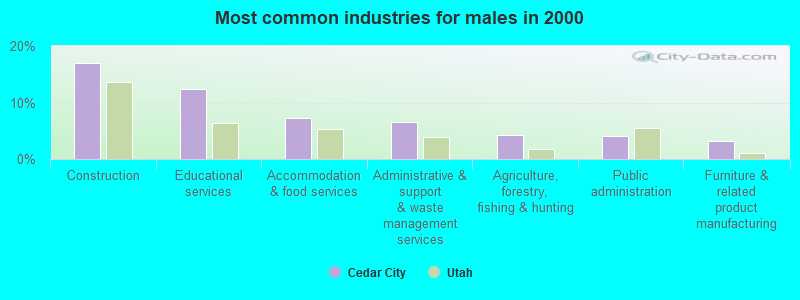
- Construction (17.0%)
- Educational services (12.3%)
- Accommodation & food services (7.2%)
- Administrative & support & waste management services (6.6%)
- Agriculture, forestry, fishing & hunting (4.2%)
- Public administration (4.1%)
- Furniture & related product manufacturing (3.3%)
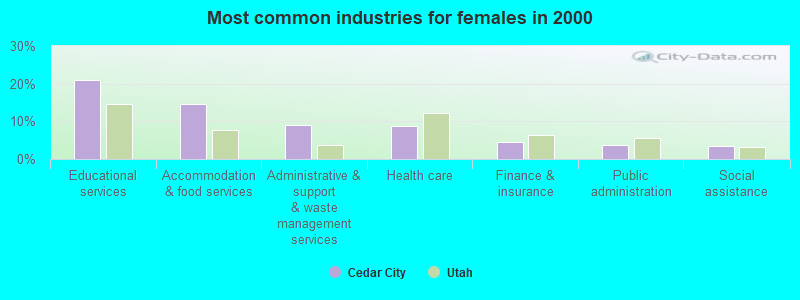
- Educational services (21.1%)
- Accommodation & food services (14.6%)
- Administrative & support & waste management services (9.0%)
- Health care (8.9%)
- Finance & insurance (4.6%)
- Public administration (3.8%)
- Social assistance (3.5%)
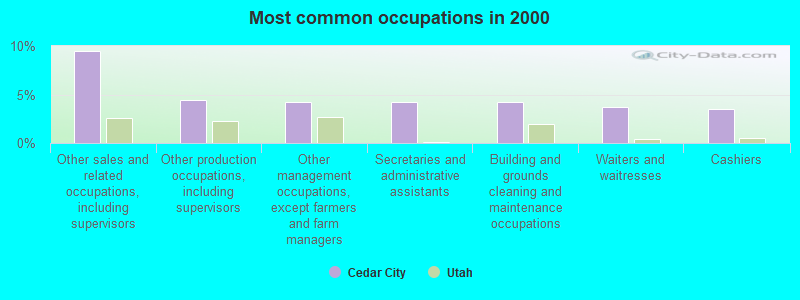
- Other sales and related occupations, including supervisors (9.4%)
- Other production occupations, including supervisors (4.4%)
- Other management occupations, except farmers and farm managers (4.2%)
- Secretaries and administrative assistants (4.2%)
- Building and grounds cleaning and maintenance occupations (4.2%)
- Waiters and waitresses (3.7%)
- Cashiers (3.5%)
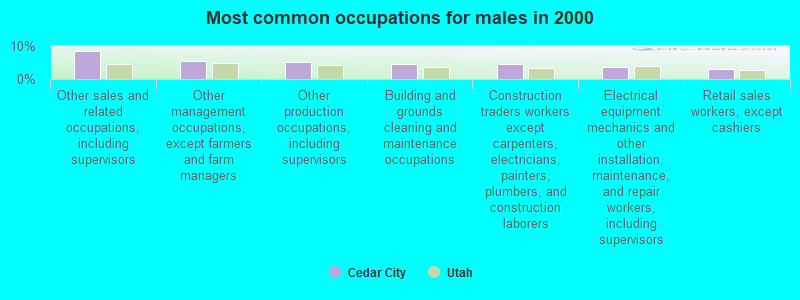
- Other sales and related occupations, including supervisors (8.5%)
- Other management occupations, except farmers and farm managers (5.5%)
- Other production occupations, including supervisors (5.0%)
- Building and grounds cleaning and maintenance occupations (4.7%)
- Construction traders workers except carpenters, electricians, painters, plumbers, and construction laborers (4.5%)
- Electrical equipment mechanics and other installation, maintenance, and repair workers, including supervisors (3.8%)
- Retail sales workers, except cashiers (2.9%)
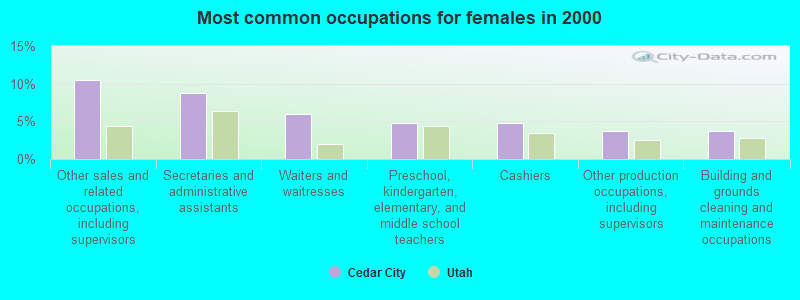
- Other sales and related occupations, including supervisors (10.5%)
- Secretaries and administrative assistants (8.7%)
- Waiters and waitresses (6.0%)
- Preschool, kindergarten, elementary, and middle school teachers (4.8%)
- Cashiers (4.8%)
- Other production occupations, including supervisors (3.8%)
- Building and grounds cleaning and maintenance occupations (3.7%)
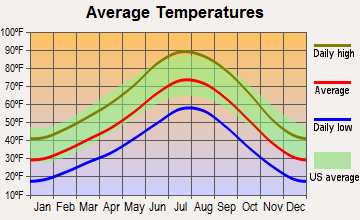
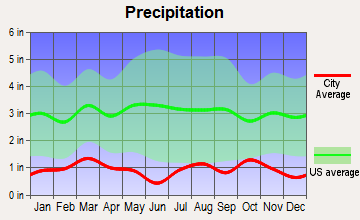
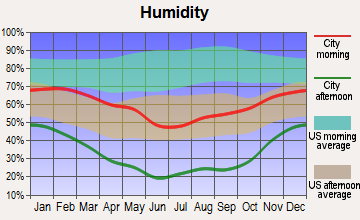
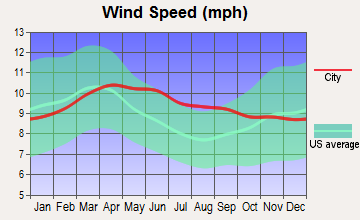
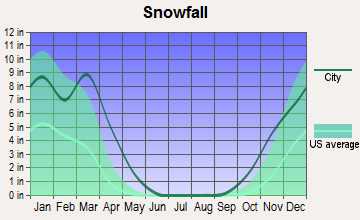
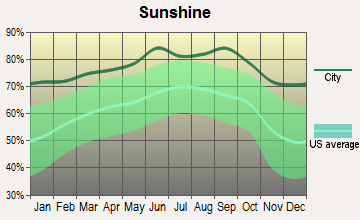
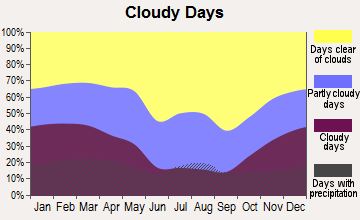
Average climate in Cedar City, Utah
Based on data reported by over 4,000 weather stations
|
|

(lower is better)
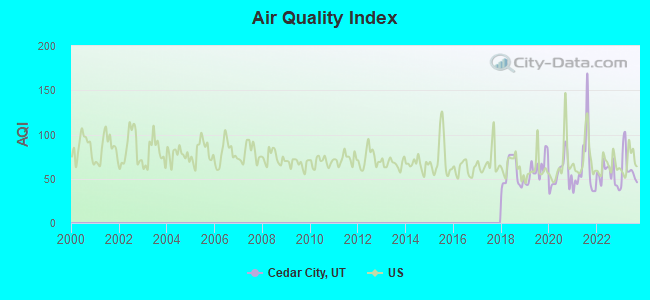
Air Quality Index (AQI) level in 2023 was 62.5. This is about average.
| City: | 62.5 |
| U.S.: | 72.6 |
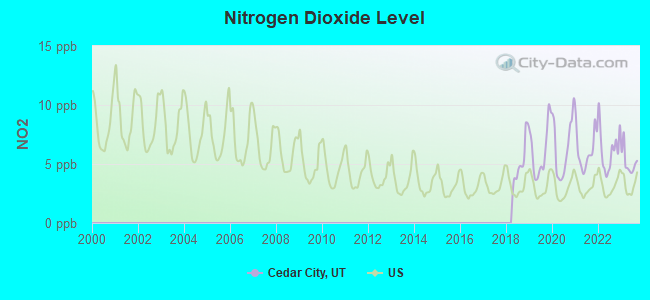
Nitrogen Dioxide (NO2) [ppb] level in 2023 was 5.16. This is about average. Closest monitor was 4.6 miles away from the city center.
| City: | 5.16 |
| U.S.: | 5.11 |
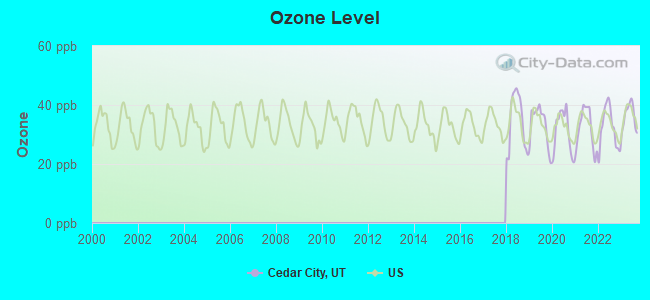
Ozone [ppb] level in 2023 was 36.2. This is about average. Closest monitor was 4.6 miles away from the city center.
| City: | 36.2 |
| U.S.: | 33.3 |
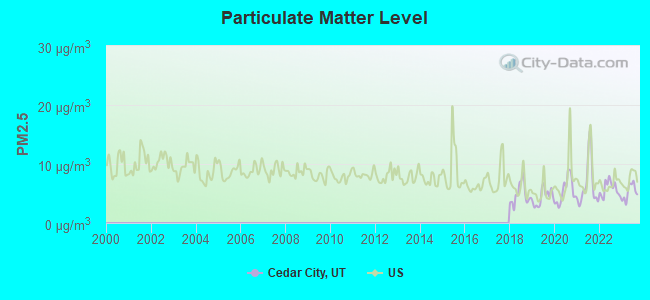
Particulate Matter (PM2.5) [µg/m3] level in 2023 was 5.24. This is significantly better than average. Closest monitor was 4.6 miles away from the city center.
| City: | 5.24 |
| U.S.: | 8.11 |
Earthquake activity:
Cedar City-area historical earthquake activity is significantly above Utah state average. It is 3724% greater than the overall U.S. average.On 10/3/1915 at 06:52:48, a magnitude 7.6 (7.6 UK, Class: Major, Intensity: VIII - XII) earthquake occurred 307.2 miles away from the city center
On 6/28/1992 at 11:57:34, a magnitude 7.6 (6.2 MB, 7.6 MS, 7.3 MW, Depth: 0.7 mi) earthquake occurred 309.9 miles away from the city center, causing 3 deaths (1 shaking deaths, 2 other deaths) and 400 injuries, causing $100,000,000 total damage and $40,000,000 insured losses
On 10/16/1999 at 09:46:44, a magnitude 7.4 (6.3 MB, 7.4 MS, 7.2 MW, 7.3 ML) earthquake occurred 288.5 miles away from Cedar City center
On 7/21/1952 at 11:52:14, a magnitude 7.7 (7.7 UK) earthquake occurred 378.6 miles away from the city center, causing $50,000,000 total damage
On 12/21/1932 at 06:10:09, a magnitude 7.2 (7.2 UK) earthquake occurred 278.6 miles away from Cedar City center
On 12/16/1954 at 11:07:12, a magnitude 7.0 (7.0 UK) earthquake occurred 286.7 miles away from Cedar City center
Magnitude types: body-wave magnitude (MB), local magnitude (ML), surface-wave magnitude (MS), moment magnitude (MW)
Natural disasters:
The number of natural disasters in Iron County (4) is a lot smaller than the US average (15).Major Disasters (Presidential) Declared: 1
Emergencies Declared: 2
Causes of natural disasters: Drought: 1, Flood: 1, Hurricane: 1, Landslide: 1, Other: 1 (Note: some incidents may be assigned to more than one category).

Hospitals and medical centers in Cedar City:
- VALLEY VIEW MEDICAL CENTER (Voluntary non-profit - Private, 1303 NORTH MAIN STREET)
- CEDAR CARE CENTER (679 SOUTH SUNSET DRIVE)
- KOLOB REGIONAL CARE AND REHABILITATION (411 WEST 1325 NORTH)
- IRON MISSION DIALYSIS CENTER (1277 N NORTHFIELD RD STE A100)
- IHC HOME CARE SERVICES AT VALLEY VIEW (595 SOUTH 75 EAST)
- IRON COUNTY HOME HEALTH AGENCY (965 SOUTH MAIN STREET, SUITE 4)
Airports and heliports located in Cedar City:
- Cedar City Regional Airport (CDC) (Runways: 2, Commercial Ops: 30, Air Taxi Ops: 3,941, Itinerant Ops: 5,525, Local Ops: 47,450, Military Ops: 250)
- Hamilton Fort Ranch Airport (UT80) (Runways: 1)
- Gilbert Development Shop Heliport (UT12)
- Wecco Heliport (UT36)
Colleges/Universities in Cedar City:
- Southern Utah University (Full-time enrollment: 6,522; Location: 351 West University Blvd; Public; Website: www.suu.edu/; Offers Master's degree)
- Southwest Applied Technology Center (Full-time enrollment: 150; Location: 510 West 800 South; Public; Website: www.swatc.edu)
- Evans Hairstyling College-Cedar City (Full-time enrollment: 80; Location: 169 N 100 W; Private, for-profit; Website: evanscollege.com)
- Beautiful You School of Nail Technology (Full-time enrollment: 8; Location: 2092 West Cross Hollow Road; Private, for-profit; Website: www.beautifulyouschoolofnailtechnology.com)
Other colleges/universities with over 2000 students near Cedar City:
- Dixie State University (about 49 miles; Saint George, UT; Full-time enrollment: 6,485)
- Snow College (about 142 miles; Ephraim, UT; FT enrollment: 3,224)
- Nevada State College (about 157 miles; Henderson, NV; FT enrollment: 2,346)
- University of Nevada-Las Vegas (about 158 miles; Las Vegas, NV; FT enrollment: 21,153)
- College of Southern Nevada (about 160 miles; Las Vegas, NV; FT enrollment: 18,996)
- Mohave Community College (about 176 miles; Kingman, AZ; FT enrollment: 3,309)
- Northern Arizona University (about 191 miles; Flagstaff, AZ; FT enrollment: 22,494)
Public high schools in Cedar City:
- CEDAR CITY HIGH (Students: 1,063, Location: 703 W 600 S, Grades: 9-12)
- CANYON VIEW HIGH (Students: 1,025, Location: 166 W 1925 N, Grades: 9-12)
- SOUTHWEST EDUCATIONAL ACADEMY (Students: 114, Location: 510 W 800 S, Grades: KG-12)
- SUCCESS SUU (Location: 351 W UNIVERSITY BLVD, Grades: 9-12, Charter school)
Private high schools in Cedar City:
Public elementary/middle schools in Cedar City:
- CEDAR MIDDLE (Students: 929, Location: 2215 WEST ROYAL HUNTE DR, Grades: 6-8)
- CANYON VIEW MIDDLE (Students: 842, Location: 1865 N MAIN, Grades: 6-8)
- CEDAR EAST SCHOOL (Students: 595, Location: 255 E COLLEGE AVE, Grades: KG-5)
- IRON SPRINGS SCHOOL (Students: 568, Location: 235 N 4050 W, Grades: KG-5)
- CEDAR SOUTH SCHOOL (Students: 537, Location: 499 W 400 S, Grades: KG-5)
- THREE PEAKS SCHOOL (Students: 525, Location: 1685 W MIDVALLEY ROAD, Grades: KG-5)
- FIDDLERS CANYON SCHOOL (Students: 501, Location: 475 E 1935 N, Grades: KG-5)
- CEDAR NORTH SCHOOL (Students: 331, Location: 550 W 200 N, Grades: KG-5)
User-submitted facts and corrections:
- Colleges/Universities in Cedar City: George Wythe College enrollment 60-100, www.gwc.edu
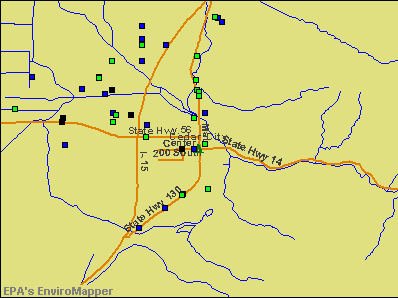
Points of interest:
Notable locations in Cedar City: Cedar City KOA (A), South Main Square (B), The Plaza (C), Cedar City Fire Department Station 2 (D), Cedar City Fire Department Station 1 (E). Display/hide their locations on the map
Churches in Cedar City include: The Church of Jesus Christ of Latter Day Saints (A), Assembly of God Church (B), Bethel Ministry (C), Christ the King Catholic Church (D), Church of Christ (E), Community Presbyterian Church (F), First Baptist Church (G), Saint Judes Episcopal Church (H), Trinity Lutheran Church (I). Display/hide their locations on the map
Cemetery: Cedar City Cemetery (1). Display/hide its location on the map
Creek: Squaw Creek (A). Display/hide its location on the map
Park in Cedar City: Iron Mission State Park (1). Display/hide its location on the map
Tourist attractions: Iron Mission State Historical Monument (Museums; 585 North Main Street) (1), The Church of Jesus Christ of Latter-Day Saints - Canyon View (Cultural Attractions- Events- & Facilities; 1985 North Main Street) (2), Shakespearean Festival - Box Office (351 West Center Street) (3), Southern Utah Scenic Tours (Tours & Charters; 2024 West 90 South) (4). Display/hide their approximate locations on the map
Hotels: Crystal Inn (1575 West 200 North) (1), Days Inn (1204 South Main Street) (2), Iron Gate Inn (100 North 200 West) (3), Value Inn (344 South Main Street) (4), Best Western El Rey Inn-Suites (80 South Main Street) (5), Abbey Inn (940 West 200 North) (6), Travel Lodge (2555 North Main Street) (7), Hampton Inn (730 South Cove Drive) (8), Econo Lodge Cedar City (333 North 1100 West) (9). Display/hide their approximate locations on the map
Courts: Workforce Services (176 East 200 North) (1), Utah State Government - Courts- Cedar City- Fifth District Court (40 North 100 East) (2), Cedar City Housing Authority (364 South 100 West) (3), Utah State Government - Courts- Cedar City- Fifth District Juvenile C (40 North 100 East) (4), Utah State - Justice Court (40 North 100 East) (5). Display/hide their approximate locations on the map
Birthplace of: Michael O. Leavitt, Patricia P. Pinegar - President of the Primary, Ryan Singer - Artist, Mitch Talbot - Baseball player, Stacy Lee - Singer, Nate Janes - College basketball player (Southern Utah Thunderbirds), Rand Janes - College basketball player (Southern Utah Thunderbirds), Richie David - College football player (Southern Utah Thunderbirds), Riley Griffiths - Film actor, Roy Allen Smith - Animator.
Drinking water stations with addresses in Cedar City and their reported violations in the past:
CEDAR CITY WATERWORKS (Population served: 28,950, Groundwater):Past health violations:MID VALLEY ESTATES (Population served: 700, Groundwater):Past monitoring violations:
- MCL, Monthly (TCR) - In DEC-2013, Contaminant: Coliform. Follow-up actions: St Formal NOV issued (FEB-02-2014), St Public Notif requested (FEB-02-2014)
- MCL, Monthly (TCR) - In MAY-2011, Contaminant: Coliform. Follow-up actions: St Formal NOV issued (JUL-02-2011), St Public Notif requested (JUL-02-2011)
- MCL, Monthly (TCR) - In MAR-2009, Contaminant: Coliform. Follow-up actions: St Violation/Reminder Notice (APR-15-2009), St Public Notif requested (APR-15-2009), St Compliance achieved (JUL-01-2010)
- MCL, Monthly (TCR) - In JUL-2006, Contaminant: Coliform. Follow-up actions: St Compliance achieved (JAN-01-2008)
- MCL, Monthly (TCR) - In JUN-2005, Contaminant: Coliform. Follow-up actions: St Compliance achieved (JAN-01-2008)
- Monitoring and Reporting (DBP) - Between JUL-2009 and SEP-2009, Contaminant: Total Haloacetic Acids (HAA5). Follow-up actions: St Public Notif requested (NOV-19-2009), St Compliance achieved (NOV-19-2009), St Formal NOV issued (NOV-19-2009)
- Monitoring and Reporting (DBP) - Between JUL-2008 and SEP-2008, Contaminant: TTHM. Follow-up actions: St Public Notif requested (DEC-13-2008), St Compliance achieved (DEC-13-2008), St Formal NOV issued (DEC-13-2008)
- Monitoring and Reporting (DBP) - Between JUL-2008 and SEP-2008, Contaminant: Total Haloacetic Acids (HAA5). Follow-up actions: St Public Notif requested (DEC-13-2008), St Compliance achieved (DEC-13-2008), St Formal NOV issued (DEC-13-2008)
- 50 regular monitoring violations
Past health violations:NAVAJO LAKE CAMPGROUNDS (Population served: 680, Groundwater):Past monitoring violations:
- MCL, Monthly (TCR) - In DEC-2011, Contaminant: Coliform. Follow-up actions: St Formal NOV issued (FEB-04-2012), St Public Notif requested (FEB-04-2012)
- MCL, Monthly (TCR) - In OCT-2007, Contaminant: Coliform. Follow-up actions: St Violation/Reminder Notice (NOV-26-2007), St Public Notif requested (NOV-26-2007), St Compliance achieved (JAN-01-2008)
- MCL, Monthly (TCR) - In JUL-2005, Contaminant: Coliform. Follow-up actions: St Violation/Reminder Notice (2 times from NOV-10-2005 to NOV-10-2005), St Compliance achieved (JAN-01-2008)
- Monitoring, Source Water (GWR) - In MAR-01-2014, Contaminant: E. COLI. Follow-up actions: St Public Notif requested (JUN-28-2014), St Compliance achieved (JUN-28-2014), St Formal NOV issued (JUN-28-2014)
- Monitoring, Repeat Major (TCR) - In FEB-2014, Contaminant: Coliform (TCR). Follow-up actions: St Formal NOV issued (APR-19-2014), St Public Notif requested (APR-19-2014)
- Follow-up Or Routine LCR Tap M/R - In SEP-04-2013, Contaminant: Lead and Copper Rule. Follow-up actions: St Formal NOV issued (JAN-17-2014), St Public Notif requested (JAN-17-2014)
- Monitoring, Source Water (GWR) - In JAN-01-2012, Contaminant: E. COLI. Follow-up actions: St Public Notif requested (FEB-10-2012), St Compliance achieved (FEB-10-2012), St Formal NOV issued (FEB-10-2012)
- Monitoring, Source Water (GWR) - In DEC-01-2011, Contaminant: E. COLI. Follow-up actions: St Public Notif requested (FEB-10-2012), St Compliance achieved (FEB-10-2012), St Formal NOV issued (FEB-10-2012)
- One routine major monitoring violation
- 3 minor monitoring violations
- 3 regular monitoring violations
- 3 other older monitoring violations
Past monitoring violations:PANGUITCH LAKE CAMPGROUND (Population served: 505, Groundwater):
- One routine major monitoring violation
- 9 regular monitoring violations
Past monitoring violations:DUCK CREEK CAMPGROUND (Population served: 400, Groundwater):
- One routine major monitoring violation
- 3 regular monitoring violations
Past monitoring violations:PINE VALLEY REC AREA - JUNIPER (Population served: 380, Groundwater):
- 3 regular monitoring violations
Past health violations:CROSS HOLLOW HILLS SUBDIVISION (Population served: 350, Groundwater):Past monitoring violations:
- MCL, Monthly (TCR) - Between JUL-2006 and SEP-2006, Contaminant: Coliform. Follow-up actions: St Public Notif requested (SEP-29-2006), St Violation/Reminder Notice (SEP-29-2006), St Compliance achieved (JAN-01-2008)
- 2 regular monitoring violations
Past monitoring violations:BUENA VISTA COMMUNITY (Population served: 300, Groundwater):
- Follow-up Or Routine LCR Tap M/R - In JAN-01-2002, Contaminant: Lead and Copper Rule. Follow-up actions: St Compliance achieved (SEP-01-2008)
- 2 minor monitoring violations
Past health violations:Past monitoring violations:
- MCL, Monthly (TCR) - In JUL-2008, Contaminant: Coliform. Follow-up actions: St Public Notif requested (AUG-25-2008), St Violation/Reminder Notice (AUG-25-2008), St Compliance achieved (JUL-01-2010)
- Follow-up Or Routine LCR Tap M/R - In JAN-01-2008, Contaminant: Lead and Copper Rule. Follow-up actions: St Public Notif requested (FEB-13-2011), St Compliance achieved (FEB-13-2011), St Formal NOV issued (FEB-13-2011)
- One minor monitoring violation
- 45 regular monitoring violations
| This city: | 2.9 people |
| Utah: | 3.1 people |
| This city: | 70.0% |
| Whole state: | 75.2% |
| This city: | 4.5% |
| Whole state: | 4.6% |
Likely homosexual households (counted as self-reported same-sex unmarried-partner households)
- Lesbian couples: 0.3% of all households
- Gay men: 0.1% of all households
People in group quarters in Cedar City in 2010:
- 678 people in college/university student housing
- 136 people in local jails and other municipal confinement facilities
- 83 people in nursing facilities/skilled-nursing facilities
- 40 people in correctional facilities intended for juveniles
- 19 people in emergency and transitional shelters (with sleeping facilities) for people experiencing homelessness
- 12 people in residential treatment centers for adults
- 10 people in workers' group living quarters and job corps centers
- 8 people in other noninstitutional facilities
People in group quarters in Cedar City in 2000:
- 361 people in college dormitories (includes college quarters off campus)
- 62 people in state prisons
- 62 people in nursing homes
- 56 people in other noninstitutional group quarters
- 41 people in local jails and other confinement facilities (including police lockups)
- 14 people in hospitals or wards for drug/alcohol abuse
- 10 people in other group homes
- 7 people in homes or halfway houses for drug/alcohol abuse
- 3 people in wards in general hospitals for patients who have no usual home elsewhere
Banks with branches in Cedar City (2011 data):
- State Bank of Southern Utah: Cedar City Walmart, State Bank Of Southern Utah, Cedar City Branch. Info updated 2006/11/03: Bank assets: $674.3 mil, Deposits: $573.2 mil, local headquarters, positive income, Commercial Lending Specialization, 13 total offices, Holding Company: Southern Utah Bancorporation
- Zions First National Bank: Cedar City Branch at 3 South Main Street, branch established on 1980/04/07; Cedar City/Providence Office Branch at 1313 South Providence Center Drive, branch established on 2006/02/27. Info updated 2006/11/03: Bank assets: $17,531.3 mil, Deposits: $14,905.3 mil, headquarters in Salt Lake City, UT, positive income, Commercial Lending Specialization, 151 total offices, Holding Company: Zions Bancorporation
- Wells Fargo Bank, National Association: Cedar City Branch at 57 North Main Street, branch established on 1956/01/03; South Cedar Citybranch at 797 South Main Street, branch established on 1995/05/15. Info updated 2011/04/05: Bank assets: $1,161,490.0 mil, Deposits: $905,653.0 mil, headquarters in Sioux Falls, SD, positive income, 6395 total offices, Holding Company: Wells Fargo & Company
- U.S. Bank National Association: Cedar City Smiths Branch at 600 South Main Street, branch established on 2004/03/29. Info updated 2012/01/30: Bank assets: $330,470.8 mil, Deposits: $236,091.5 mil, headquarters in Cincinnati, OH, positive income, 3121 total offices, Holding Company: U.S. Bancorp
For population 15 years and over in Cedar City:
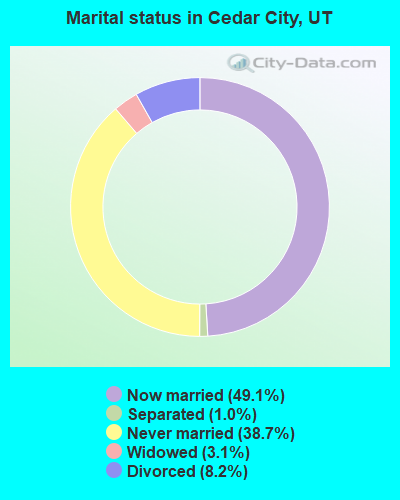
- Never married: 38.7%
- Now married: 49.1%
- Separated: 1.0%
- Widowed: 3.1%
- Divorced: 8.2%
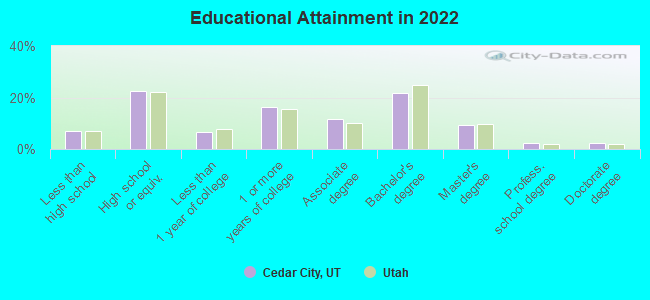
For population 25 years and over in Cedar City:
- High school or higher: 93.1%
- Bachelor's degree or higher: 34.0%
- Graduate or professional degree: 13.0%
- Unemployed: 5.5%
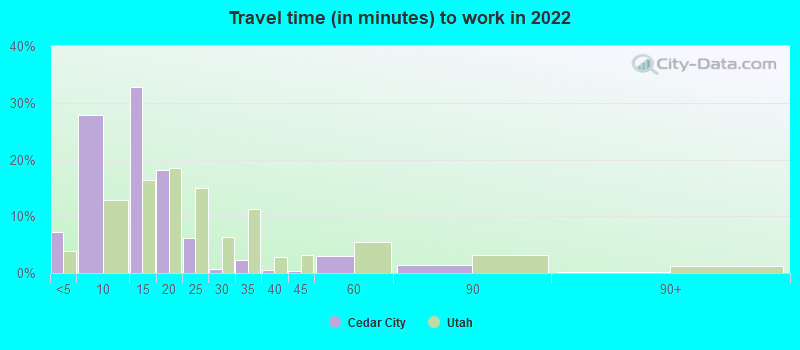
- Mean travel time to work (commute): 11.4 minutes
| Here: | 10.6 |
| Utah average: | 10.9 |
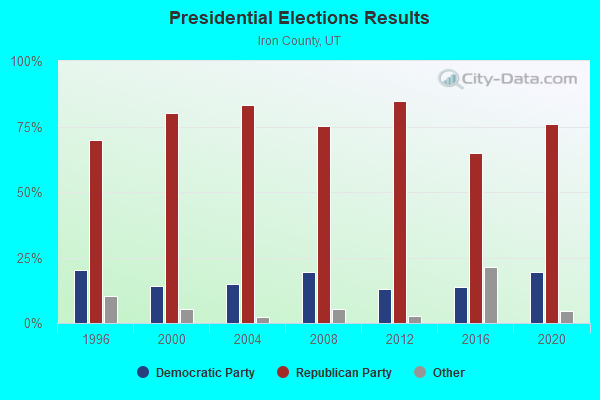
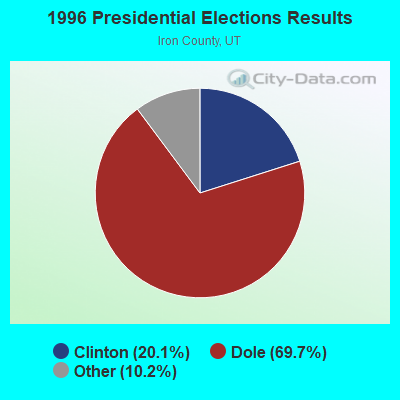
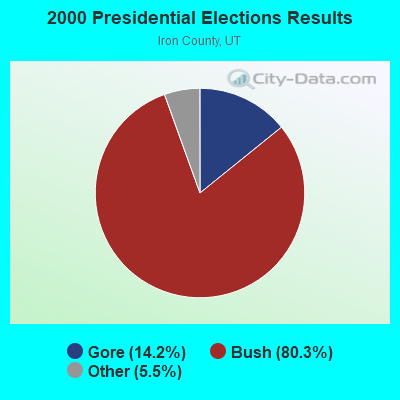
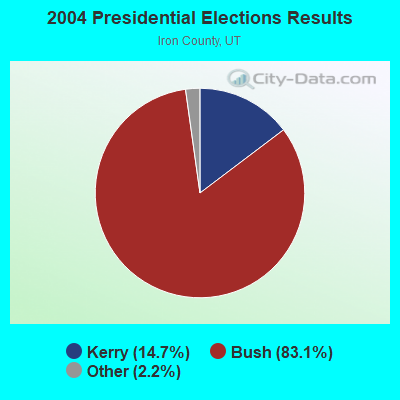
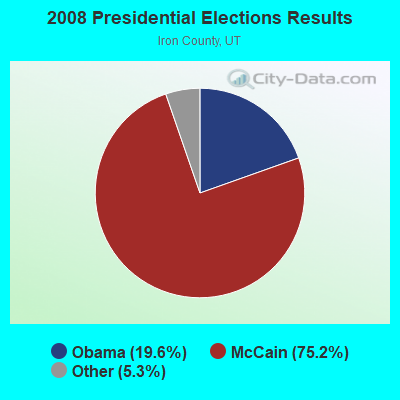
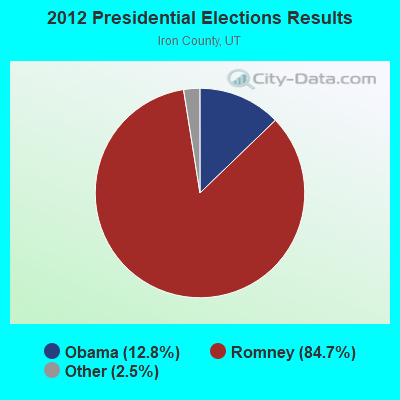
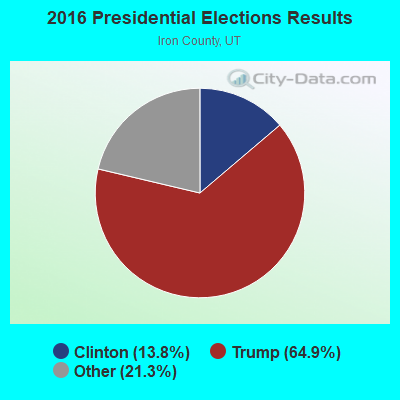
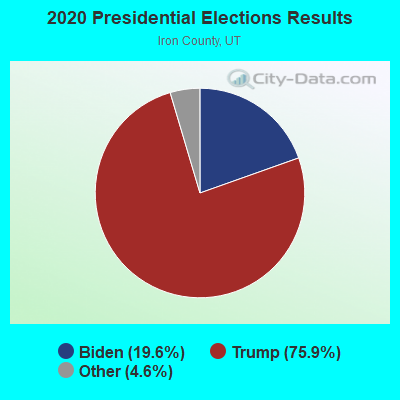
Graphs represent county-level data. Detailed 2008 Election Results
Religion statistics for Cedar City, UT (based on Iron County data)
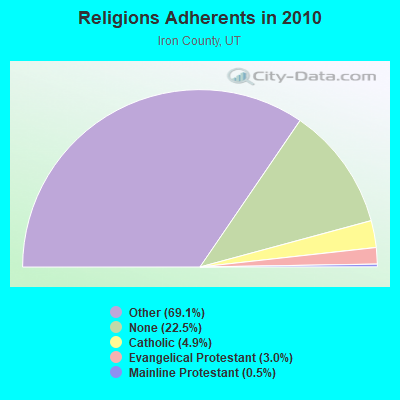
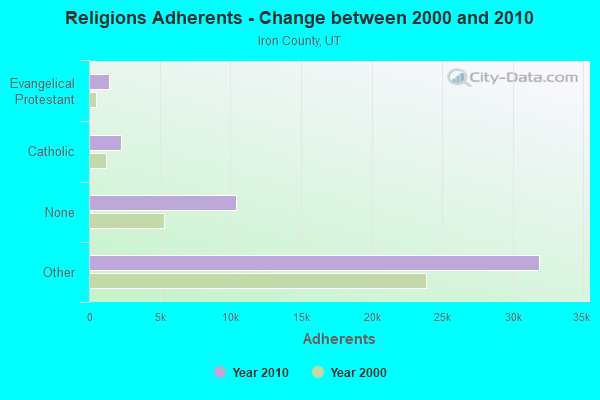
| Religion | Adherents | Congregations |
|---|---|---|
| Other | 31,886 | 98 |
| Catholic | 2,248 | 2 |
| Evangelical Protestant | 1,384 | 12 |
| Mainline Protestant | 252 | 2 |
| None | 10,393 | - |
Food Environment Statistics:
| This county: | 0.92 / 10,000 pop. |
| State: | 1.37 / 10,000 pop. |
| This county: | 0.23 / 10,000 pop. |
| State: | 0.18 / 10,000 pop. |
| Here: | 0.46 / 10,000 pop. |
| State: | 0.41 / 10,000 pop. |
| Iron County: | 4.83 / 10,000 pop. |
| Utah: | 2.82 / 10,000 pop. |
| This county: | 6.44 / 10,000 pop. |
| State: | 5.09 / 10,000 pop. |
| Here: | 5.5% |
| Utah: | 6.3% |
| Iron County: | 21.1% |
| Utah: | 23.6% |
Health and Nutrition:
| This city: | 48.9% |
| Utah: | 48.9% |
| Cedar City: | 48.0% |
| Utah: | 47.0% |
| Cedar City: | 28.1 |
| Utah: | 28.4 |
| Cedar City: | 21.1% |
| Utah: | 21.0% |
| Cedar City: | 10.4% |
| Utah: | 10.3% |
| Cedar City: | 6.8 |
| Utah: | 6.8 |
| Cedar City: | 30.5% |
| Utah: | 31.9% |
| Cedar City: | 58.6% |
| Utah: | 57.4% |
| Cedar City: | 81.0% |
| State: | 80.1% |
More about Health and Nutrition of Cedar City, UT Residents
| Local government employment and payroll (March 2022) | |||||
| Function | Full-time employees | Monthly full-time payroll | Average yearly full-time wage | Part-time employees | Monthly part-time payroll |
|---|---|---|---|---|---|
| Police Protection - Officers | 40 | $240,150 | $72,045 | 0 | $0 |
| Parks and Recreation | 22 | $106,255 | $57,957 | 98 | $58,125 |
| Streets and Highways | 19 | $103,910 | $65,627 | 1 | $2,004 |
| Other and Unallocable | 17 | $94,873 | $66,969 | 14 | $11,603 |
| Sewerage | 14 | $72,440 | $62,091 | 0 | $0 |
| Firefighters | 13 | $81,366 | $75,107 | 10 | $8,990 |
| Water Supply | 12 | $62,159 | $62,159 | 0 | $0 |
| Other Government Administration | 10 | $39,647 | $47,576 | 0 | $0 |
| Financial Administration | 6 | $31,124 | $62,248 | 0 | $0 |
| Police - Other | 5 | $20,662 | $49,589 | 6 | $4,982 |
| Local Libraries | 4 | $21,525 | $64,575 | 8 | $11,725 |
| Solid Waste Management | 4 | $16,691 | $50,073 | 0 | $0 |
| Judicial and Legal | 3 | $23,463 | $93,852 | 0 | $0 |
| Natural Resources | 2 | $8,835 | $53,010 | 0 | $0 |
| Airports | 2 | $11,975 | $71,850 | 2 | $4,949 |
| Health | 1 | $3,521 | $42,252 | 4 | $5,434 |
| Transit | 0 | $0 | 8 | $11,501 | |
| Welfare | 0 | $0 | 2 | $4,544 | |
| Totals for Government | 174 | $938,596 | $64,731 | 153 | $123,856 |
Cedar City government finances - Expenditure in 2021 (per resident):
- Construction - Air Transportation: $6,388,000 ($165.10)
Sewerage: $2,878,000 ($74.38)
Water Utilities: $836,000 ($21.61)
Parks and Recreation: $424,000 ($10.96)
Housing and Community Development: $393,000 ($10.16)
Regular Highways: $95,000 ($2.46)
Transit Utilities: $20,000 ($0.52)
Local Fire Protection: $9,000 ($0.23)
- Current Operations - Police Protection: $4,558,000 ($117.80)
Parks and Recreation: $4,422,000 ($114.29)
General - Other: $3,829,000 ($98.96)
Regular Highways: $2,874,000 ($74.28)
Water Utilities: $2,867,000 ($74.10)
Sewerage: $2,309,000 ($59.68)
Local Fire Protection: $1,603,000 ($41.43)
Financial Administration: $1,594,000 ($41.20)
Housing and Community Development: $968,000 ($25.02)
Libraries: $654,000 ($16.90)
Air Transportation: $448,000 ($11.58)
Solid Waste Management: $432,000 ($11.17)
Judicial and Legal Services: $387,000 ($10.00)
Protective Inspection and Regulation - Other: $374,000 ($9.67)
Transit Utilities: $169,000 ($4.37)
General Public Buildings: $135,000 ($3.49)
Health - Other: $131,000 ($3.39)
Public Welfare - Other: $23,000 ($0.59)
Parking Facilities: $18,000 ($0.47)
Central Staff Services: $3,000 ($0.08)
- General - Interest on Debt: $142,000 ($3.67)
- Intergovernmental to State - Air Transportation: $586,000 ($15.15)
- Other Capital Outlay - Police Protection: $715,000 ($18.48)
Sewerage: $449,000 ($11.60)
Parks and Recreation: $382,000 ($9.87)
Solid Waste Management: $282,000 ($7.29)
Regular Highways: $246,000 ($6.36)
Local Fire Protection: $162,000 ($4.19)
Libraries: $69,000 ($1.78)
Water Utilities: $67,000 ($1.73)
Air Transportation: $31,000 ($0.80)
General - Other: $31,000 ($0.80)
Transit Utilities: $9,000 ($0.23)
- Total Salaries and Wages: $9,831,000 ($254.08)
- Water Utilities - Interest on Debt: $92,000 ($2.38)
Cedar City government finances - Revenue in 2021 (per resident):
- Charges - Sewerage: $5,987,000 ($154.73)
Parks and Recreation: $2,434,000 ($62.91)
Other: $1,042,000 ($26.93)
Solid Waste Management: $835,000 ($21.58)
Air Transportation: $250,000 ($6.46)
Miscellaneous Commercial Activities: $154,000 ($3.98)
Parking Facilities: $16,000 ($0.41)
- Federal Intergovernmental - Air Transportation: $12,198,000 ($315.26)
General Local Government Support: $13,000 ($0.34)
- Local Intergovernmental - Other: $1,487,000 ($38.43)
Sewerage: $325,000 ($8.40)
General Local Government Support: $6,000 ($0.16)
- Miscellaneous - General Revenue - Other: $773,000 ($19.98)
Rents: $518,000 ($13.39)
Sale of Property: $438,000 ($11.32)
Fines and Forfeits: $249,000 ($6.44)
Interest Earnings: $245,000 ($6.33)
Donations From Private Sources: $12,000 ($0.31)
- Revenue - Water Utilities: $7,655,000 ($197.84)
Transit Utilities: $32,000 ($0.83)
- State Intergovernmental - Other: $3,911,000 ($101.08)
Transit Utilities: $592,000 ($15.30)
General Local Government Support: $524,000 ($13.54)
- Tax - General Sales and Gross Receipts: $8,822,000 ($228.01)
Property: $6,869,000 ($177.53)
Public Utilities Sales: $2,730,000 ($70.56)
Other License: $1,709,000 ($44.17)
Other Selective Sales: $1,117,000 ($28.87)
Occupation and Business License - Other: $213,000 ($5.51)
Alcoholic Beverage License: $9,000 ($0.23)
Cedar City government finances - Debt in 2021 (per resident):
- Long Term Debt - Beginning Outstanding - Unspecified Public Purpose: $3,272,000 ($84.57)
Outstanding Unspecified Public Purpose: $2,061,000 ($53.27)
Retired Unspecified Public Purpose: $1,211,000 ($31.30)
Cedar City government finances - Cash and Securities in 2021 (per resident):
- Bond Funds - Cash and Securities: $7,826,000 ($202.26)
- Other Funds - Cash and Securities: $70,817,000 ($1830.27)
- Sinking Funds - Cash and Securities: $184,000 ($4.76)
| Businesses in Cedar City, UT | ||||
| Name | Count | Name | Count | |
|---|---|---|---|---|
| Ace Hardware | 1 | Marriott | 1 | |
| Applebee's | 1 | MasterBrand Cabinets | 4 | |
| Arby's | 1 | Maurices | 1 | |
| AutoZone | 1 | McDonald's | 2 | |
| Best Western | 2 | Motel 6 | 1 | |
| Big O Tires | 1 | New Balance | 1 | |
| Burger King | 1 | Nike | 2 | |
| Carl\s Jr. | 1 | Panda Express | 1 | |
| Chevrolet | 1 | Payless | 1 | |
| Comfort Inn | 1 | Quality | 1 | |
| Curves | 1 | RadioShack | 1 | |
| Dairy Queen | 1 | Sears | 1 | |
| Days Inn | 1 | Sprint Nextel | 1 | |
| Decora Cabinetry | 2 | Staples | 1 | |
| Dennys | 1 | Starbucks | 1 | |
| FedEx | 4 | Subway | 5 | |
| Ford | 1 | Super 8 | 1 | |
| GNC | 1 | T-Mobile | 2 | |
| GameStop | 1 | Taco Bell | 1 | |
| H&R Block | 2 | Travelodge | 1 | |
| Hilton | 1 | True Value | 1 | |
| Holiday Inn | 1 | U-Haul | 5 | |
| Home Depot | 1 | UPS | 9 | |
| IHOP | 1 | Vans | 1 | |
| Knights Inn | 1 | Walgreens | 1 | |
| Kroger | 1 | Walmart | 1 | |
| Lane Furniture | 2 | Wendy's | 1 | |
| Little Caesars Pizza | 1 | |||
Strongest AM radio stations in Cedar City:
- KNNZ (940 AM; 10 kW; CEDAR CITY, UT; Owner: MB MEDIA GROUP, INC.)
- KSUB (590 AM; 5 kW; CEDAR CITY, UT; Owner: MB MEDIA GROUP, INC.)
- KDXU (890 AM; 10 kW; ST. GEORGE, UT; Owner: WESTERN BROADCASTING, LS, LLC)
- KUNF (1210 AM; 10 kW; WASHINGTON, UT; Owner: MARATHON MEDIA GROUP, L.L.C.)
- KXNT (840 AM; 50 kW; NORTH LAS VEGAS, NV; Owner: INFINITY RADIO OPERATIONS INC.)
- KDWN (720 AM; 50 kW; LAS VEGAS, NV; Owner: RADIO NEVADA CORP.)
- KZNU (1450 AM; 10 kW; ST. GEORGE, UT; Owner: AM RADIO 1450, INC.)
- KALL (700 AM; 50 kW; NORTH SALT LAKE CITY, UT; Owner: CITICASTERS LICENSES, L.P.)
- KTNN (660 AM; 50 kW; WINDOW ROCK, AZ; Owner: THE NAVAJO NATION)
- KMIA (710 AM; 50 kW; BLACK CANYON CITY, AZ; Owner: ENTRAVISION HOLDINGS, LLC)
- KIQN (1010 AM; 50 kW; TOOELE, UT)
- KSL (1160 AM; 50 kW; SALT LAKE CITY, UT; Owner: BONNEVILLE HOLDING COMPANY)
- KMTI (650 AM; 10 kW; MANTI, UT; Owner: SANPETE COUNTY BROADCASTING COMPANY)
Strongest FM radio stations in Cedar City:
- K202AW (88.3 FM; CEDAR CITY, UT; Owner: UNIVERSITY OF UTAH)
- KREC (98.1 FM; BRIAN HEAD, UT; Owner: MARATHON MEDIA GROUP, L.L.C.)
- KXFF (92.5 FM; CEDAR CITY, UT; Owner: MB MEDIA GROUP, INC.)
- K269DG (101.7 FM; CEDAR CITY, UT; Owner: JEFFERY M. JENNINGS)
- K208CA (89.5 FM; PAROWAN, UT; Owner: UTAH STATE UNIV. OF AGRI & APP. SCI)
- K211BU (90.1 FM; PAROWAN, UT; Owner: UNIVERSITY OF UTAH)
- K243AG (96.5 FM; PAROWAN, UT; Owner: IRON COUNTY)
- K203CA (88.5 FM; MILFORD, UT; Owner: UNIVERSITY OF UTAH)
- K300AC (107.9 FM; WASHINGTON, ETC., UT; Owner: UNIVERSITY OF UTAH)
- KZHK (95.9 FM; ST. GEORGE, UT; Owner: MARVIN KENT FRANDSEN)
- KSUU (91.1 FM; CEDAR CITY, UT; Owner: SOUTH STATE UNIVERSITY)
- K282AC (104.3 FM; RURAL GARFIELD COUNT, UT; Owner: GARFIELD COUNTY)
- KONY (99.9 FM; ST. GEORGE, UT; Owner: FM RADIO 99.9, INC.)
- KMXM (107.1 FM; COLORADO CITY, AZ; Owner: MB MEDIA GROUP, INC.)
- K211BJ (90.1 FM; TOQUERVILLE, UT; Owner: UNIVERSITY OF UTAH)
- K247AG (97.3 FM; CEDAR CITY, UT; Owner: UTAH STATE UNIVERSITY)
- KXBN (94.9 FM; CEDAR CITY, UT; Owner: MB MEDIA GROUP, INC.)
TV broadcast stations around Cedar City:
- K22EK (Channel 22; CEDAR CITY, UT; Owner: IRON COUNTY)
- K24DC (Channel 24; CEDAR CITY, UT; Owner: UNIVERSITY OF UTAH)
- KCSG (Channel 4; CEDAR CITY, UT; Owner: DANIEL MATHESON & STEPHEN WADE d/b as BROADCAST WEST)
- K02NU (Channel 2; CEDAR CITY, ETC., UT; Owner: IRON COUNTY)
- K07GQ (Channel 7; CEDAR CITY, UT; Owner: IRON COUNTY)
- K09CJ (Channel 9; CEDAR CITY, UT; Owner: IRON COUNTY)
- K05HB (Channel 5; CEDAR CITY, UT; Owner: IRON COUNTY)
- K11CQ (Channel 11; CEDAR CITY, UT; Owner: IRON COUNTY)
- K13CP (Channel 13; CEDAR CITY, UT; Owner: IRON COUNTY)
- National Bridge Inventory (NBI) Statistics
- 53Number of bridges
- 394ft / 120mTotal length
- 751,133Total average daily traffic
- 231,615Total average daily truck traffic
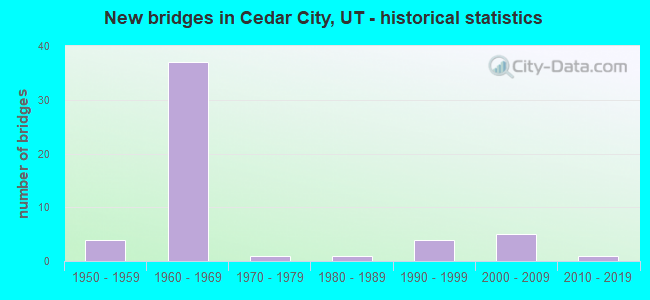
- New bridges - historical statistics
- 41950-1959
- 371960-1969
- 11970-1979
- 11980-1989
- 41990-1999
- 52000-2009
- 12010-2019
2002 - 2018 National Fire Incident Reporting System (NFIRS) incidents
- Fire incident types reported to NFIRS in Cedar City, UT
- 44541.5%Outside Fires
- 40738.0%Structure Fires
- 19918.6%Mobile Property/Vehicle Fires
- 201.9%Other
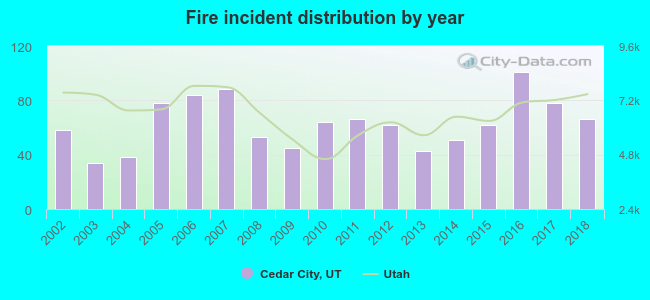 According to the data from the years 2002 - 2018 the average number of fires per year is 63. The highest number of reported fire incidents - 101 took place in 2016, and the least - 34 in 2003. The data has a growing trend.
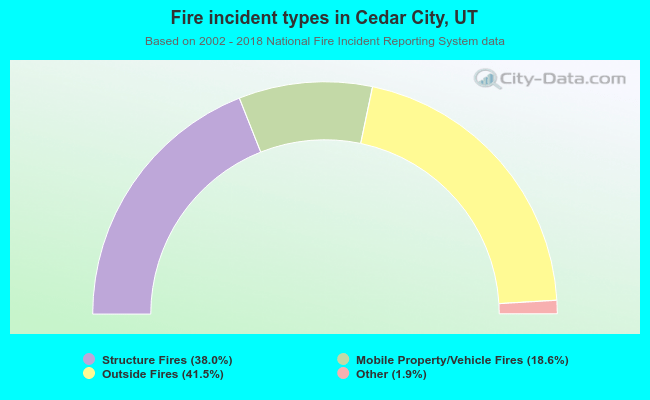 When looking into fire subcategories, the most reports belonged to: Outside Fires (41.5%), and Structure Fires (38.0%).
Fire-safe hotels and motels in Cedar City, Utah:
- Crystal Inn, 1575 W 200 N, Cedar City, Utah 84720 , Phone: (435) 586-8888, Fax: (435) 586-1010
- Quality Inn, 250 N 1100 W, Cedar City, Utah 84720 , Phone: (435) 586-2082, Fax: (435) 586-3193
- Days Inn, 1204 S Main St, Cedar City, Utah 84720 , Phone: (435) 867-8877
- Americas Best Value Inn, 333 N 1100 W, Cedar City, Utah 84721 , Phone: (435) 867-4700
- Knights Inn Cedar City, 281 S Main St, Cedar City, Utah 84720 , Phone: (435) 586-9916, Fax: (435) 586-4795
- Hampton Inn, 1145 S Bentley Blvd, Cedar City, Utah 84720 , Phone: (435) 586-5000, Fax: (435) 586-5007
- Holiday Inn Express Hotel And Suites, 1555 S Old Hwy 91, Cedar City, Utah 84720 , Phone: (435) 865-7799, Fax: (435) 865-7795
- Springhill Suites By Marriott Cedar City, 1477 S Old Hwy 91, Cedar City, Utah 84720 , Phone: (435) 586-1685, Fax: (435) 586-1686
- 7 other hotels and motels
| Most common first names in Cedar City, UT among deceased individuals | ||
| Name | Count | Lived (average) |
|---|---|---|
| John | 60 | 75.0 years |
| William | 60 | 73.7 years |
| Mary | 58 | 77.4 years |
| Robert | 49 | 69.8 years |
| James | 45 | 73.3 years |
| Richard | 28 | 67.9 years |
| George | 28 | 72.5 years |
| Charles | 25 | 75.5 years |
| Joseph | 23 | 79.6 years |
| Helen | 21 | 79.9 years |
| Most common last names in Cedar City, UT among deceased individuals | ||
| Last name | Count | Lived (average) |
|---|---|---|
| Smith | 46 | 78.2 years |
| Jones | 42 | 80.3 years |
| Nelson | 38 | 75.3 years |
| Adams | 36 | 72.2 years |
| Williams | 33 | 77.3 years |
| Anderson | 26 | 69.5 years |
| Hunter | 24 | 73.5 years |
| Davis | 23 | 75.6 years |
| Bulloch | 22 | 76.6 years |
| Leigh | 21 | 79.3 years |
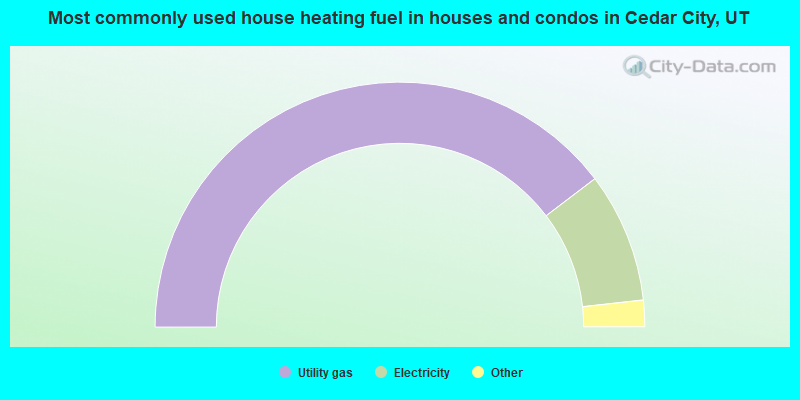
- 79.3%Utility gas
- 17.2%Electricity
- 1.3%Fuel oil, kerosene, etc.
- 1.1%Bottled, tank, or LP gas
- 0.8%Wood
- 0.4%Solar energy
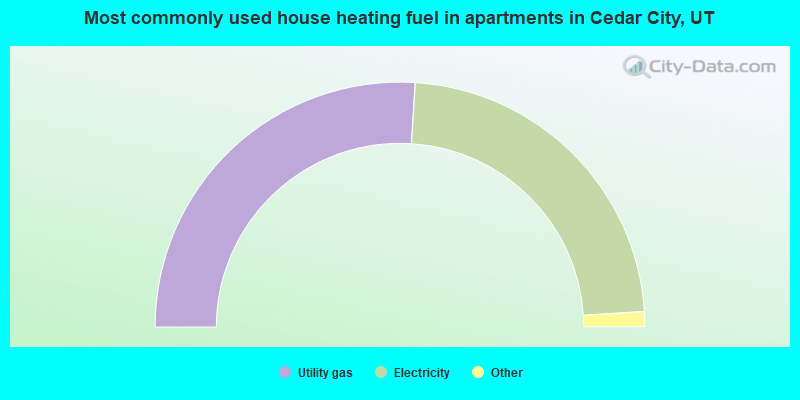
- 52.0%Utility gas
- 46.0%Electricity
- 1.0%Bottled, tank, or LP gas
- 1.0%No fuel used
Cedar City compared to Utah state average:
- Unemployed percentage below state average.
- Black race population percentage above state average.
- Median age below state average.
- Renting percentage above state average.
- House age below state average.
- Number of college students above state average.
Cedar City on our top lists:
- #49 on the list of "Top 101 cities with the most residents born in Australia (population 500+)"
- #80 on the list of "Top 100 highest located cities (pop. 5,000+)"
- #83 on the list of "Top 101 cities with the most residents born in Australia and New Zealand Subregion (population 500+)"
- #49 (84720) on the list of "Top 101 zip codes with the largest percentage of English first ancestries (pop 5,000+)"
- #71 (84720) on the list of "Top 101 zip codes with the largest charity contributions deductions as a percentage of AGI in 2012 (pop 5,000+)"
- #99 (84720) on the list of "Top 101 zip codes with the largest percentage of Scottish first ancestries (pop 5,000+)"
- #58 on the list of "Top 101 counties with the most Other congregations"
- #85 on the list of "Top 101 counties with highest percentage of residents voting for Romney (Republican) in the 2012 Presidential Election"
- #86 on the list of "Top 101 counties with the most Other adherents"

|
|
Total of 78 patent applications in 2008-2024.