Races in Bowie, Maryland (MD) Detailed Stats
Data:
Races - White alone (%)
Races - White alone (% change since 2000)
Races - Black alone (%)
Races - Black alone (% change since 2000)
Races - American Indian alone (%)
Races - American Indian alone (% change since 2000)
Races - Asian alone (%)
Races - Asian alone (% change since 2000)
Races - Hispanic (%)
Races - Hispanic (% change since 2000)
Races - Native Hawaiian and Other Pacific Islander alone (%)
Races - Native Hawaiian and Other Pacific Islander alone (% change since 2000)
Races - Two or more races(%)
Races - Two or more races(% change since 2000)
Races - Other race alone (%)
Races - Other race alone (% change since 2000)
Racial diversity
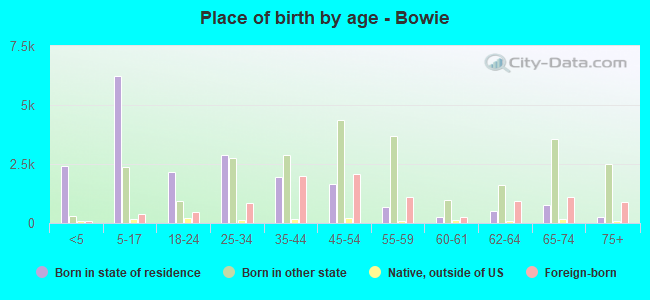
Place of birth - Born in state of residence (%)
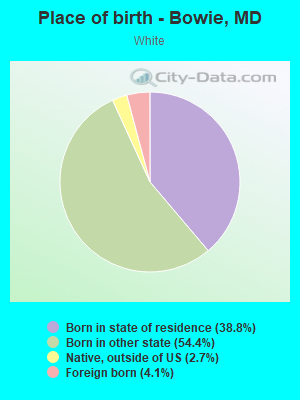
Place of birth - Born in state of residence (%) - White
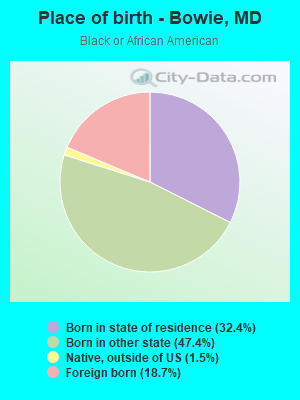
Place of birth - Born in state of residence (%) - Black or African American
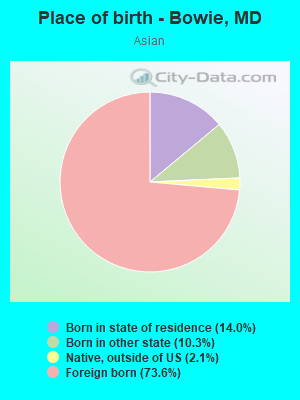
Place of birth - Born in state of residence (%) - Asian
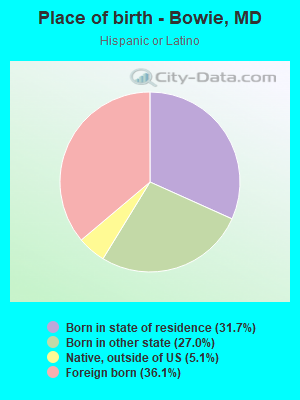
Place of birth - Born in state of residence (%) - Hispanic or Latino
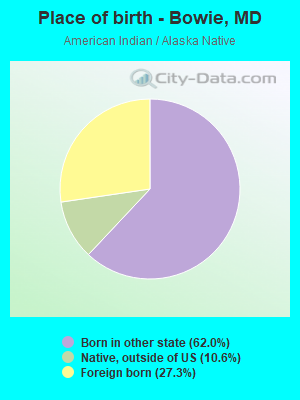
Place of birth - Born in state of residence (%) - American Indian and Alaska Native
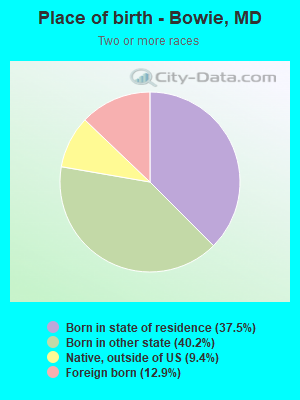
Place of birth - Born in state of residence (%) - Multirace
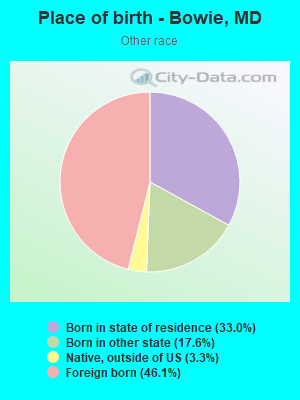
Place of birth - Born in state of residence (%) - Other Race
Place of birth - Born in other state (%)
Place of birth - Born in other state (%) - White
Place of birth - Born in other state (%) - Black or African American
Place of birth - Born in other state (%) - Asian
Place of birth - Born in other state (%) - Hispanic or Latino
Place of birth - Born in other state (%) - American Indian and Alaska Native
Place of birth - Born in other state (%) - Multirace
Place of birth - Born in other state (%) - Other Race
Place of birth - Native, outside of US (%)
Place of birth - Native, outside of US (%) - White
Place of birth - Native, outside of US (%) - Black or African American
Place of birth - Native, outside of US (%) - Asian
Place of birth - Native, outside of US (%) - Hispanic or Latino
Place of birth - Native, outside of US (%) - American Indian and Alaska Native
Place of birth - Native, outside of US (%) - Multirace
Place of birth - Native, outside of US (%) - Other Race
Place of birth - Foreign born (%)
Place of birth - Foreign born (%) - White
Place of birth - Foreign born (%) - Black or African American
Place of birth - Foreign born (%) - Asian
Place of birth - Foreign born (%) - Hispanic or Latino
Place of birth - Foreign born (%) - American Indian and Alaska Native
Place of birth - Foreign born (%) - Multirace
Place of birth - Foreign born (%) - Other Race
Residents speaking English at home (%)
Residents speaking English at home - Born in the United States (%)
Residents speaking English at home - Native, born elsewhere (%)
Residents speaking English at home - Foreign born (%)
Residents speaking Spanish at home (%)
Residents speaking Spanish at home - Born in the United States (%)
Residents speaking Spanish at home - Native, born elsewhere (%)
Residents speaking Spanish at home - Foreign born (%)
Residents speaking other language at home (%)
Residents speaking other language at home - Born in the United States (%)
Residents speaking other language at home - Native, born elsewhere (%)
Residents speaking other language at home - Foreign born (%)
Marital status - Never married (%)
Marital status - Now married (%)
Marital status - Separated (%)
Marital status - Widowed (%)
Marital status - Divorced (%)
Ancestries Reported - Arab (%)
Ancestries Reported - Czech (%)
Ancestries Reported - Danish (%)
Ancestries Reported - Dutch (%)
Ancestries Reported - English (%)
Ancestries Reported - French (%)
Ancestries Reported - French Canadian (%)
Ancestries Reported - German (%)
Ancestries Reported - Greek (%)
Ancestries Reported - Hungarian (%)
Ancestries Reported - Irish (%)
Ancestries Reported - Italian (%)
Ancestries Reported - Lithuanian (%)
Ancestries Reported - Norwegian (%)
Ancestries Reported - Polish (%)
Ancestries Reported - Portuguese (%)
Ancestries Reported - Russian (%)
Ancestries Reported - Scotch-Irish (%)
Ancestries Reported - Scottish (%)
Ancestries Reported - Slovak (%)
Ancestries Reported - Subsaharan African (%)
Ancestries Reported - Swedish (%)
Ancestries Reported - Swiss (%)
Ancestries Reported - Ukrainian (%)
Ancestries Reported - United States (%)
Ancestries Reported - Welsh (%)
Ancestries Reported - West Indian (%)
Ancestries Reported - Other (%)
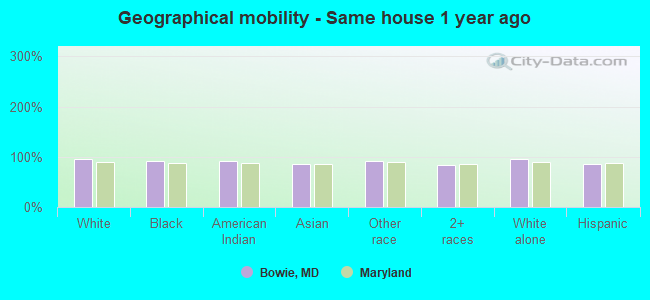
Geographical mobility - Same house 1 year ago (%)
Geographical mobility - Same house 1 year ago (%) - White
Geographical mobility - Same house 1 year ago (%) - Black or African American
Geographical mobility - Same house 1 year ago (%) - Asian
Geographical mobility - Same house 1 year ago (%) - Hispanic or Latino
Geographical mobility - Same house 1 year ago (%) - American Indian and Alaska Native
Geographical mobility - Same house 1 year ago (%) - Multirace
Geographical mobility - Same house 1 year ago (%) - Other Race
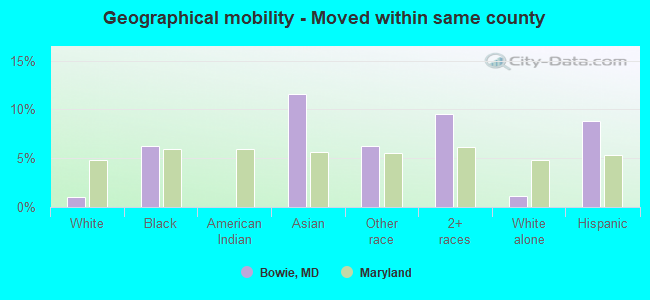
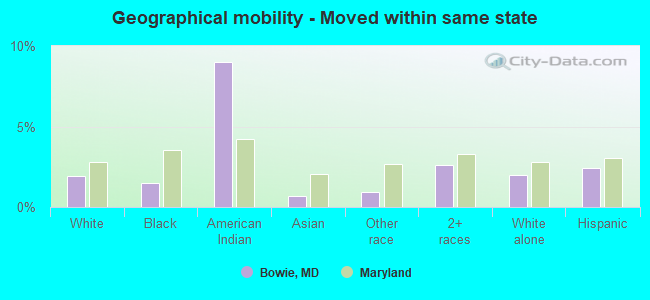
Geographical mobility - Moved within same county (%)
Geographical mobility - Moved within same county (%) - White
Geographical mobility - Moved within same county (%) - Black or African American
Geographical mobility - Moved within same county (%) - Asian
Geographical mobility - Moved within same county (%) - Hispanic or Latino
Geographical mobility - Moved within same county (%) - American Indian and Alaska Native
Geographical mobility - Moved within same county (%) - Multirace
Geographical mobility - Moved within same county (%) - Other Race
Geographical mobility - Moved from different county within same state (%)
Geographical mobility - Moved from different county within same state (%) - White
Geographical mobility - Moved from different county within same state (%) - Black or African American
Geographical mobility - Moved from different county within same state (%) - Asian
Geographical mobility - Moved from different county within same state (%) - Hispanic or Latino
Geographical mobility - Moved from different county within same state (%) - American Indian and Alaska Native
Geographical mobility - Moved from different county within same state (%) - Multirace
Geographical mobility - Moved from different county within same state (%) - Other Race
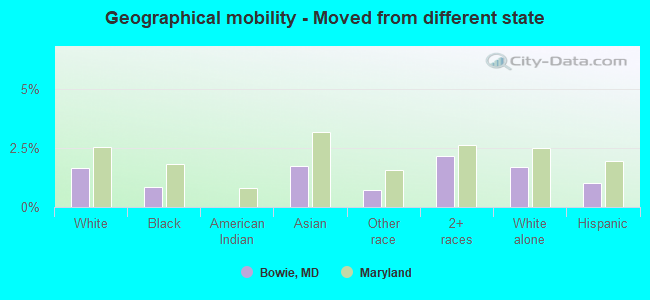
Geographical mobility - Moved from different state (%)
Geographical mobility - Moved from different state (%) - White
Geographical mobility - Moved from different state (%) - Black or African American
Geographical mobility - Moved from different state (%) - Asian
Geographical mobility - Moved from different state (%) - Hispanic or Latino
Geographical mobility - Moved from different state (%) - American Indian and Alaska Native
Geographical mobility - Moved from different state (%) - Multirace
Geographical mobility - Moved from different state (%) - Other Race
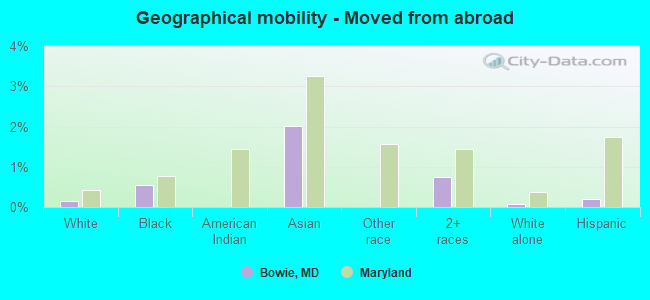
Geographical mobility - Moved from abroad (%)
Geographical mobility - Moved from abroad (%) - White
Geographical mobility - Moved from abroad (%) - Black or African American
Geographical mobility - Moved from abroad (%) - Asian
Geographical mobility - Moved from abroad (%) - Hispanic or Latino
Geographical mobility - Moved from abroad (%) - American Indian and Alaska Native
Geographical mobility - Moved from abroad (%) - Multirace
Geographical mobility - Moved from abroad (%) - Other Race
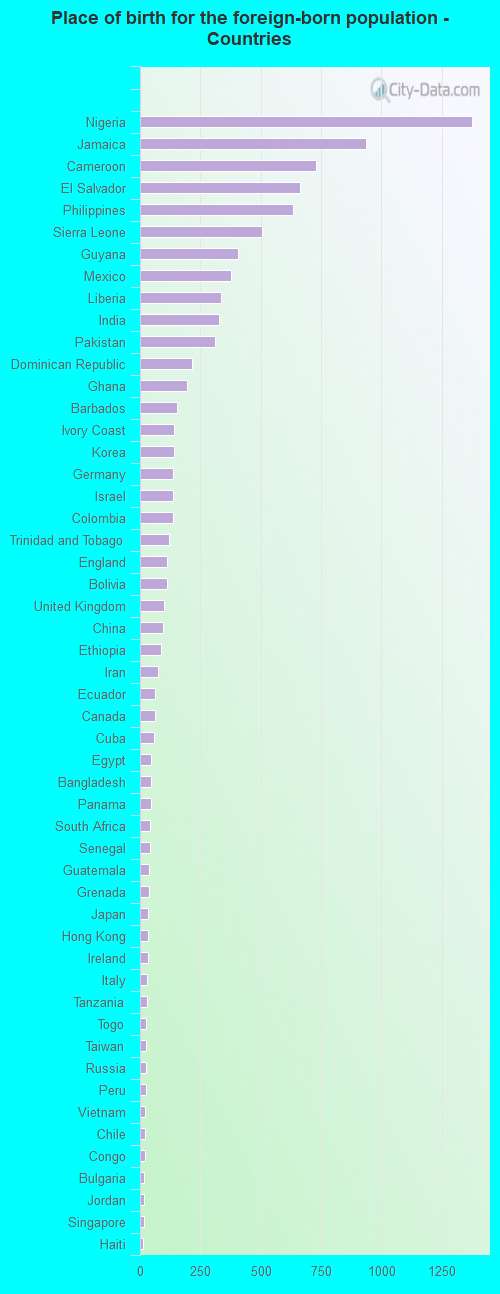
Place of birth for the foreign-born population - Ireland (%)
Place of birth for the foreign-born population - Denmark (%)
Place of birth for the foreign-born population - Norway (%)
Place of birth for the foreign-born population - Sweden (%)
Place of birth for the foreign-born population - United Kingdom (%)
Place of birth for the foreign-born population - England (%)
Place of birth for the foreign-born population - Scotland (%)
Place of birth for the foreign-born population - Other Northern Europe (%)
Place of birth for the foreign-born population - Austria (%)
Place of birth for the foreign-born population - Belgium (%)
Place of birth for the foreign-born population - France (%)
Place of birth for the foreign-born population - Germany (%)
Place of birth for the foreign-born population - Netherlands (%)
Place of birth for the foreign-born population - Switzerland (%)
Place of birth for the foreign-born population - Other Western Europe (%)
Place of birth for the foreign-born population - Greece (%)
Place of birth for the foreign-born population - Italy (%)
Place of birth for the foreign-born population - Portugal (%)
Place of birth for the foreign-born population - Spain (%)
Place of birth for the foreign-born population - Other Southern Europe (%)
Place of birth for the foreign-born population - Albania (%)
Place of birth for the foreign-born population - Belarus (%)
Place of birth for the foreign-born population - Bosnia and Herzegovina (%)
Place of birth for the foreign-born population - Bulgaria (%)
Place of birth for the foreign-born population - Croatia (%)
Place of birth for the foreign-born population - Czechoslovakia (%)
Place of birth for the foreign-born population - Hungary (%)
Place of birth for the foreign-born population - Latvia (%)
Place of birth for the foreign-born population - Lithuania (%)
Place of birth for the foreign-born population - North Macedonia (Macedonia) (%)
Place of birth for the foreign-born population - Moldova (%)
Place of birth for the foreign-born population - Poland (%)
Place of birth for the foreign-born population - Romania (%)
Place of birth for the foreign-born population - Russia (%)
Place of birth for the foreign-born population - Serbia (%)
Place of birth for the foreign-born population - Ukraine (%)
Place of birth for the foreign-born population - Other Eastern Europe (%)
Place of birth for the foreign-born population - China (%)
Place of birth for the foreign-born population - Hong Kong (%)
Place of birth for the foreign-born population - Taiwan (%)
Place of birth for the foreign-born population - Japan (%)
Place of birth for the foreign-born population - Korea (%)
Place of birth for the foreign-born population - Other Eastern Asia (%)
Place of birth for the foreign-born population - Afghanistan (%)
Place of birth for the foreign-born population - Bangladesh (%)
Place of birth for the foreign-born population - India (%)
Place of birth for the foreign-born population - Iran (%)
Place of birth for the foreign-born population - Kazakhstan (%)
Place of birth for the foreign-born population - Nepal (%)
Place of birth for the foreign-born population - Pakistan (%)
Place of birth for the foreign-born population - Sri Lanka (%)
Place of birth for the foreign-born population - Uzbekistan (%)
Place of birth for the foreign-born population - Other South Central Asia (%)
Place of birth for the foreign-born population - Burma (%)
Place of birth for the foreign-born population - Cambodia (%)
Place of birth for the foreign-born population - Indonesia (%)
Place of birth for the foreign-born population - Laos (%)
Place of birth for the foreign-born population - Malaysia (%)
Place of birth for the foreign-born population - Philippines (%)
Place of birth for the foreign-born population - Singapore (%)
Place of birth for the foreign-born population - Thailand (%)
Place of birth for the foreign-born population - Vietnam (%)
Place of birth for the foreign-born population - Other South Eastern Asia (%)
Place of birth for the foreign-born population - Armenia (%)
Place of birth for the foreign-born population - Iraq (%)
Place of birth for the foreign-born population - Israel (%)
Place of birth for the foreign-born population - Jordan (%)
Place of birth for the foreign-born population - Kuwait (%)
Place of birth for the foreign-born population - Lebanon (%)
Place of birth for the foreign-born population - Saudi Arabia (%)
Place of birth for the foreign-born population - Syria (%)
Place of birth for the foreign-born population - Turkey (%)
Place of birth for the foreign-born population - Yemen (%)
Place of birth for the foreign-born population - Other Western Asia (%)
Place of birth for the foreign-born population - Eritrea (%)
Place of birth for the foreign-born population - Ethiopia (%)
Place of birth for the foreign-born population - Kenya (%)
Place of birth for the foreign-born population - Somalia (%)
Place of birth for the foreign-born population - Uganda (%)
Place of birth for the foreign-born population - Zimbabwe (%)
Place of birth for the foreign-born population - Other Eastern Africa (%)
Place of birth for the foreign-born population - Cameroon (%)
Place of birth for the foreign-born population - Congo (%)
Place of birth for the foreign-born population - Democratic Republic of Congo (Zaire) (%)
Place of birth for the foreign-born population - Other Middle Africa (%)
Place of birth for the foreign-born population - Egypt (%)
Place of birth for the foreign-born population - Morocco (%)
Place of birth for the foreign-born population - Sudan (%)
Place of birth for the foreign-born population - Other Northern Africa (%)
Place of birth for the foreign-born population - South Africa (%)
Place of birth for the foreign-born population - Other Southern Africa (%)
Place of birth for the foreign-born population - Cabo Verde (%)
Place of birth for the foreign-born population - Ghana (%)
Place of birth for the foreign-born population - Liberia (%)
Place of birth for the foreign-born population - Nigeria (%)
Place of birth for the foreign-born population - Senegal (%)
Place of birth for the foreign-born population - Sierra Leone (%)
Place of birth for the foreign-born population - Other Western Africa (%)
Place of birth for the foreign-born population - Australia (%)
Place of birth for the foreign-born population - New Zealand (%)
Place of birth for the foreign-born population - Fiji (%)
Place of birth for the foreign-born population - Micronesia (%)
Place of birth for the foreign-born population - Bahamas (%)
Place of birth for the foreign-born population - Barbados (%)
Place of birth for the foreign-born population - Cuba (%)
Place of birth for the foreign-born population - Dominica (%)
Place of birth for the foreign-born population - Dominican Republic (%)
Place of birth for the foreign-born population - Grenada (%)
Place of birth for the foreign-born population - Haiti (%)
Place of birth for the foreign-born population - Jamaica (%)
Place of birth for the foreign-born population - St. Vincent and the Grenadines (%)
Place of birth for the foreign-born population - Trinidad and Tobago (%)
Place of birth for the foreign-born population - West Indies (%)
Place of birth for the foreign-born population - Other Caribbean (%)
Place of birth for the foreign-born population - Belize (%)
Place of birth for the foreign-born population - Costa Rica (%)
Place of birth for the foreign-born population - El Salvador (%)
Place of birth for the foreign-born population - Guatemala (%)
Place of birth for the foreign-born population - Honduras (%)
Place of birth for the foreign-born population - Mexico (%)
Place of birth for the foreign-born population - Nicaragua (%)
Place of birth for the foreign-born population - Panama (%)
Place of birth for the foreign-born population - Other Central America (%)
Place of birth for the foreign-born population - Argentina (%)
Place of birth for the foreign-born population - Bolivia (%)
Place of birth for the foreign-born population - Brazil (%)
Place of birth for the foreign-born population - Chile (%)
Place of birth for the foreign-born population - Colombia (%)
Place of birth for the foreign-born population - Ecuador (%)
Place of birth for the foreign-born population - Guyana (%)
Place of birth for the foreign-born population - Peru (%)
Place of birth for the foreign-born population - Uruguay (%)
Place of birth for the foreign-born population - Venezuela (%)
Place of birth for the foreign-born population - Other South America (%)
Place of birth for the foreign-born population - Canada (%)
Place of birth for the foreign-born population - Other Northern America (%)
Place of birth for the foreign-born population - Other (%)
Latest news about races in Bowie, MD collected exclusively by city-data.com from local newspapers, TV, and radio stations
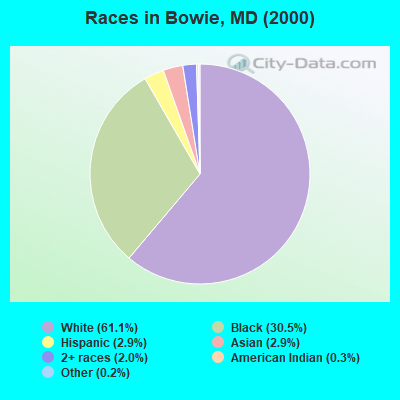
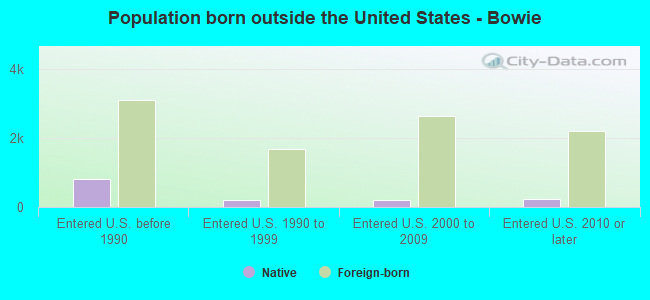
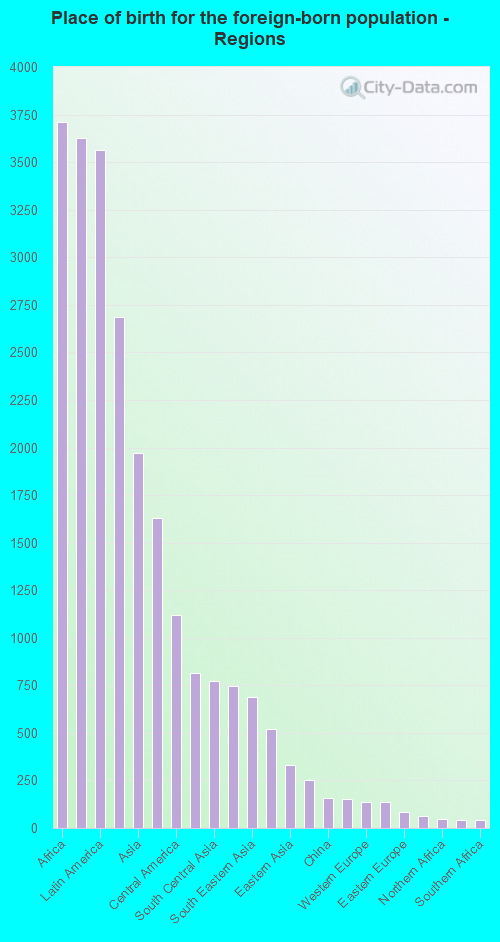
According to 2022 data, the most numerous races in Bowie, MD are White alone (14,862 residents), Black alone (31,364 residents), and Hispanic (4,944 residents). 81.6% of Bowie residents speak English at home. 17.2% of Bowie, MD residents are foreign-born (6.0% born in Africa, 5.8% born in Latin America, 3.2% born in Asia), which is 6.7% greater than the foreign-born rate of 16.0% across the entire state of Maryland.
Race distribution in Bowie
2000 2022
30,709 61.1% White alone 15,339 30.5% Black alone 1,468 2.9% Hispanic 1,466 2.9% Asian alone 1,013 2.0% Two or more races 143 0.3% American Indian alone 116 0.2% Other race alone 15 0.03% Native Hawaiian and Other
31,364 54.7% Black alone 14,862 25.9% White alone 4,944 8.6% Hispanic 3,335 5.8% Two or more races 1,915 3.3% Asian alone 203 0.4% Other race alone 93 0.2% American Indian alone
2000 2022
3,286,547 62.1% White alone 1,464,735 27.7% Black alone 227,916 4.3% Hispanic 209,738 4.0% Asian alone 82,946 1.6% Two or more races 13,312 0.3% American Indian alone 9,379 0.2% Other race alone 1,913 0.04% Native Hawaiian and Other
2,906,492 47.1% White alone 1,800,914 29.2% Black alone 705,842 11.4% Hispanic 401,818 6.5% Asian alone 291,317 4.7% Two or more races 46,930 0.8% Other race alone 8,930 0.1% American Indian alone 2,417 0.04% Native Hawaiian and Other
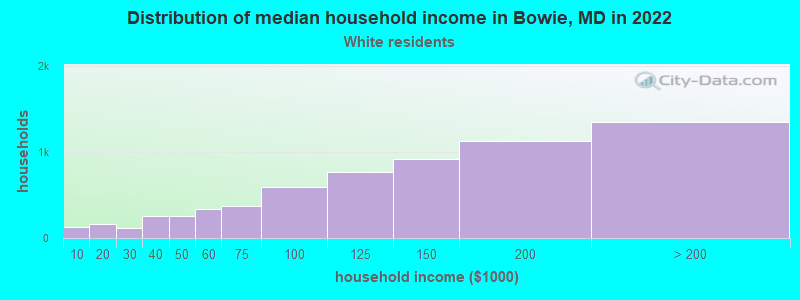
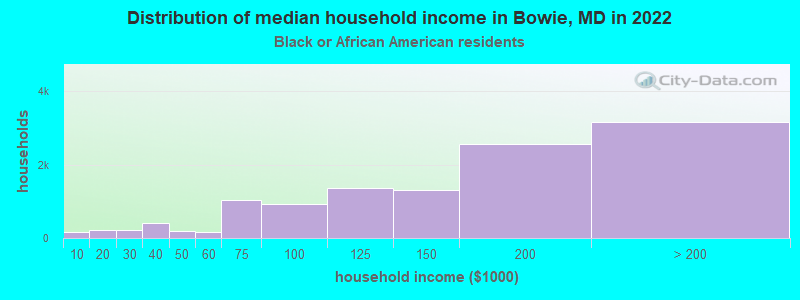
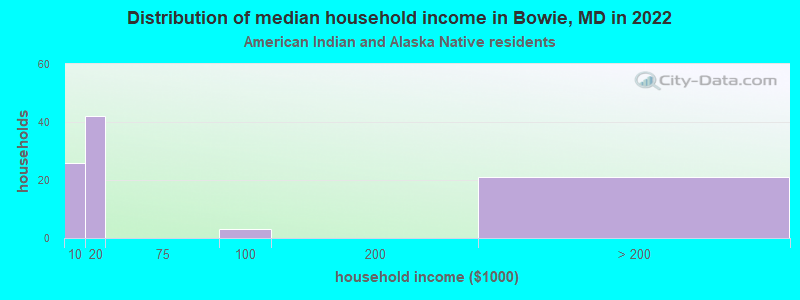
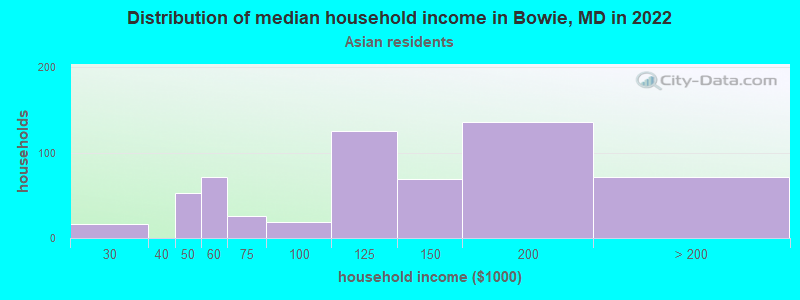
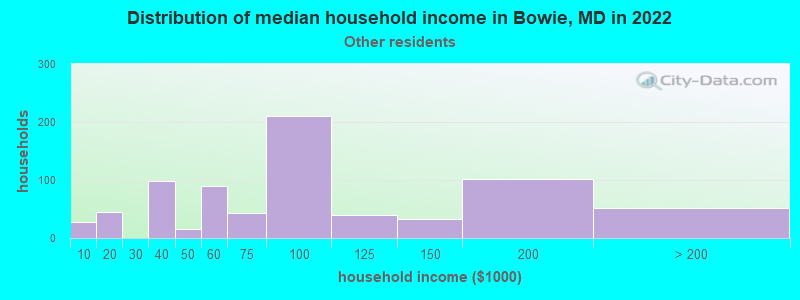
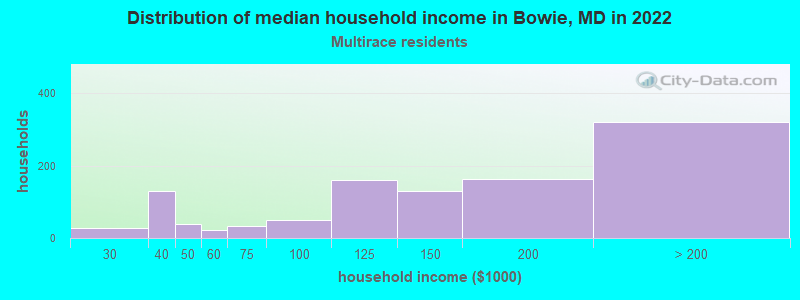
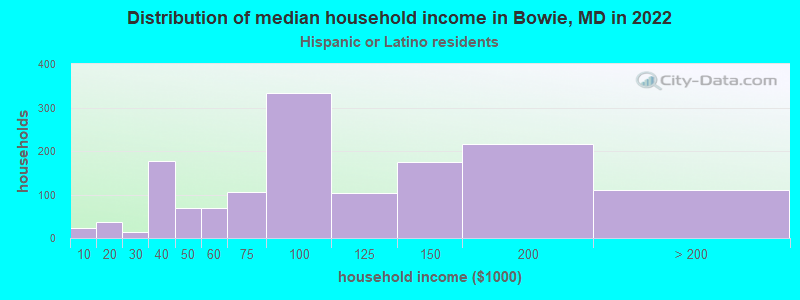
Income and house value in Bowie Median household income in 2022 $125,730 White non-Hispanic householders$146,609 Black householders$110,024 Asian householders$70,493 Some other race householders$141,839 Two or more races householders$91,165 Hispanic or Latino race householdersMedian 2022 house value $440,535 White Non-Hispanic householders$500,191 Black or African American householders$358,508 American Indian or Alaska Native householders $493,881 Asian householders$394,359 Native Hawaiian and other Pacific Islander householders$460,612 Some other race householders$406,118 Two or more races householders$441,683 Hispanic or Latino householders
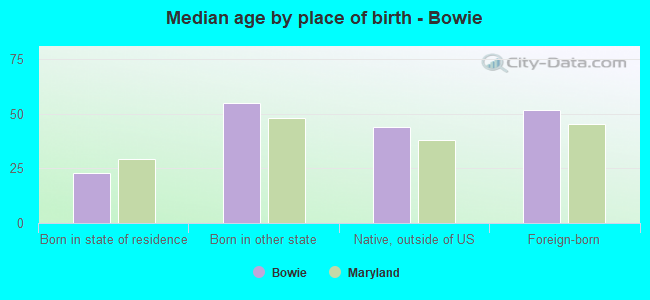
Median age by race in Bowie
53.1 Median age for White residents51.2 54.1 44.7 Median age for Black or African American residents42.8 47.3 72.9 Median age for American Indian / Alaska Native residents64.5 64.9 48.0 Median age for Asian residents42.0 50.8 -571,600,480.8 Median age for Native Hawaiian / Pacific Islander residents-720,061,021.4 -760,942,760.2 32.3 Median age for Other race residents29.4 38.7 23.6 Median age for Two or more races residents24.7 23.6 52.5 Median age for White alone residents49.3 52.9 32.9 Median age for Hispanic or Latino residents32.5 33.6
Owner/renter occupied households by race in Bowie
House owners and renters - White residents 5,623 91.2% Owner occupied541 8.8% Renter occupiedHouse owners and renters - Black or African American residents 9,688 82.7% Owner occupied2,020 17.3% Renter occupiedHouse owners and renters - American Indian / Alaska Native residents 41 48.3% Owner occupied44 51.7% Renter occupiedHouse owners and renters - Asian residents 562 86.5% Owner occupied87 13.5% Renter occupiedHouse owners and renters - Other race residents 619 90.0% Owner occupied69 10.0% Renter occupiedHouse owners and renters - Two or more races residents 1,131 87.1% Owner occupied168 12.9% Renter occupiedHouse owners and renters - White alone residents 5,579 91.2% Owner occupied539 8.8% Renter occupiedHouse owners and renters - Hispanic or Latino residents 1,292 93.8% Owner occupied85 6.2% Renter occupied
Language usage in Bowie
English speakers - Total 81.6% of residents of Bowie speak English at home.
6.8% of residents speak Spanish at home 2,492 66.6% Speak English very well1,251 33.4% Speak English less than very well10.3% of residents speak other language at home 4,635 82.4% Speak English very well993 17.6% Speak English less than very well
English speakers - Born in the United States 93.7% of residents of Bowie speak English at home.
3.6% of residents speak Spanish at home 754 81.8% Speak English very well168 18.2% Speak English less than very well2.4% of residents speak other language at home 572 93.6% Speak English very well39 6.4% Speak English less than very well
English speakers - Native, born elsewhere 82.5% of residents of Bowie speak English at home.
13.5% of residents speak Spanish at home 126 65.6% Speak English very well66 34.4% Speak English less than very well5.0% of residents speak other language at home 21 29.6% Speak English very well50 70.4% Speak English less than very well
English speakers - Foreign-born 40.8% of residents of Bowie speak English at home.
16.4% of residents speak Spanish at home 737 45.2% Speak English very well892 54.8% Speak English less than very well44.5% of residents speak other language at home 3,547 80.1% Speak English very well880 19.9% Speak English less than very well
White (Caucasian) - Speak only English Native:
95.8% (13,325)Foreign-born:
37.1% (219)
White (Caucasian) - Speak another language Native:
4.7% (649)Foreign-born:
67.7% (399)
Black or African American - Speak only English Native:
96.1% (23,853)Foreign-born:
54.9% (3,331)
Black or African American - Speak another language Native:
3.8% (949)Foreign-born:
42.8% (2,600)
American Indian / Alaska Native - Speak another language Native:
16.8% (26)Foreign-born:
99.9% (48)
Asian - Speak only English Native:
59.4% (267)Foreign-born:
19.0% (269)
Asian - Speak another language Native:
29.4% (132)Foreign-born:
81.9% (1,156)
Other race - Speak only English Native:
16.8% (179)Foreign-born:
4.1% (46)
Other race - Speak another language Native:
83.3% (889)Foreign-born:
95.7% (1,053)
Two or more races - Speak only English Native:
83.0% (2,985)Foreign-born:
30.6% (188)
Two or more races - Speak another language Native:
16.5% (592)Foreign-born:
67.1% (411)
White alone - Speak only English Native:
95.8% (13,094)Foreign-born:
31.8% (213)
White alone - Speak another language Native:
3.9% (534)Foreign-born:
68.2% (458)
Hispanic or Latino - Speak only English Native:
40.9% (1,122)Foreign-born:
4.3% (75)
Hispanic or Latino - Speak another language Native:
60.6% (1,666)Foreign-born:
95.6% (1,687)
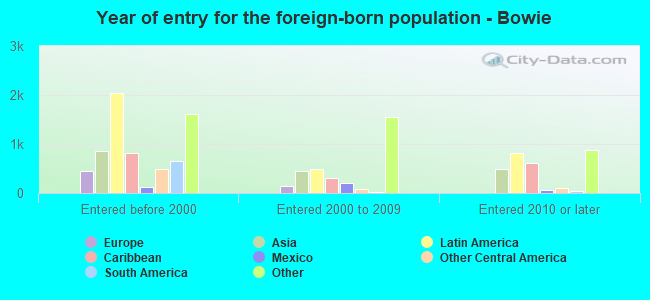
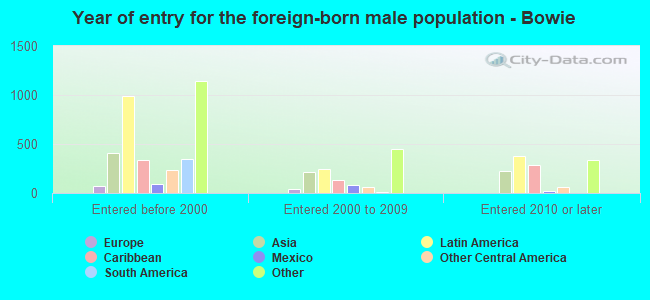
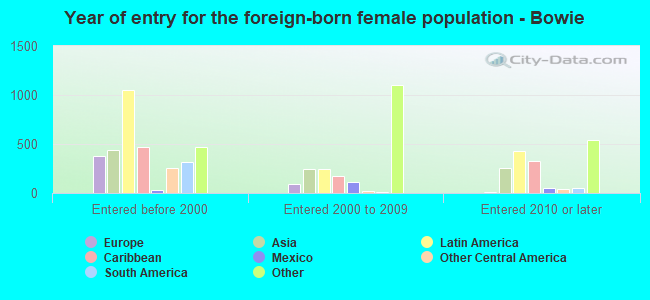
Foreign-born residents in Bowie 9,829 residents are foreign born (6.0% Africa , 5.8% Latin America , 3.2% Asia ).
This city:
17.2%Maryland:
15.7%
Marital status for residents in Bowie Marital status - White (Caucasian) population 15 years and over
Males 28.3% Never married59.0% Now married1.4% Separated4.0% Widowed7.3% DivorcedFemales 19.9% Never married56.0% Now married1.1% Separated11.4% Widowed11.6% DivorcedWomen who gave birth in the past 12 months Now married:
100.0% (136)Unmarried:
0.0% (0)
Women who did not give birth in the past 12 months Now married:
48.0% (1,049)Unmarried:
52.0% (1,137)
Marital status - Black or African American population 15 years and over
Males 37.5% Never married53.9% Now married1.3% Separated1.3% Widowed5.9% DivorcedFemales 34.8% Never married38.6% Now married1.6% Separated8.5% Widowed16.5% DivorcedWomen who gave birth in the past 12 months Now married:
54.0% (220)Unmarried:
46.0% (187)
Women who did not give birth in the past 12 months Now married:
30.8% (2,168)Unmarried:
69.2% (4,867)
Marital status - American Indian / Alaska Native population 15 years and over
Males 31.6% Never married21.1% Now married47.4% Separated0.0% Widowed0.0% DivorcedFemales 4.2% Never married53.4% Now married0.0% Separated34.7% Widowed7.6% DivorcedWomen who did not give birth in the past 12 months Now married:
84.4% (40)Unmarried:
15.6% (7)
Marital status - Asian population 15 years and over
Males 25.3% Never married63.3% Now married1.6% Separated0.9% Widowed8.8% DivorcedFemales 26.3% Never married56.7% Now married1.6% Separated7.2% Widowed8.3% DivorcedWomen who gave birth in the past 12 months Now married:
100.0% (11)Unmarried:
0.0% (0)
Women who did not give birth in the past 12 months Now married:
61.4% (275)Unmarried:
38.6% (173)
Marital status - Other race population 15 years and over
Males 45.9% Never married50.3% Now married0.0% Separated0.7% Widowed3.1% DivorcedFemales 20.4% Never married52.5% Now married3.1% Separated3.4% Widowed20.5% DivorcedWomen who gave birth in the past 12 months Now married:
100.0% (22)Unmarried:
0.0% (0)
Women who did not give birth in the past 12 months Now married:
59.3% (361)Unmarried:
40.7% (248)
Marital status - Two or more races population 15 years and over
Males 55.4% Never married32.4% Now married0.5% Separated2.2% Widowed9.4% DivorcedFemales 53.0% Never married29.6% Now married1.6% Separated1.4% Widowed14.5% DivorcedWomen who gave birth in the past 12 months Now married:
100.0% (12)Unmarried:
0.0% (0)
Women who did not give birth in the past 12 months Now married:
22.2% (235)Unmarried:
77.8% (824)
Marital status - White alone, not Hispanic / Latino population 15 years and over
Males 28.6% Never married58.7% Now married1.4% Separated4.1% Widowed7.2% DivorcedFemales 19.5% Never married55.4% Now married1.2% Separated12.0% Widowed12.0% DivorcedWomen who gave birth in the past 12 months Now married:
100.0% (111)Unmarried:
0.0% (0)
Women who did not give birth in the past 12 months Now married:
47.5% (1,080)Unmarried:
52.5% (1,191)
Marital status - Hispanic or Latino population 15 years and over
Males 37.4% Never married55.8% Now married0.6% Separated0.8% Widowed5.4% DivorcedFemales 31.8% Never married46.8% Now married1.7% Separated8.4% Widowed11.3% DivorcedWomen who gave birth in the past 12 months Now married:
91.2% (64)Unmarried:
8.8% (6)
Women who did not give birth in the past 12 months Now married:
41.2% (506)Unmarried:
58.8% (723)
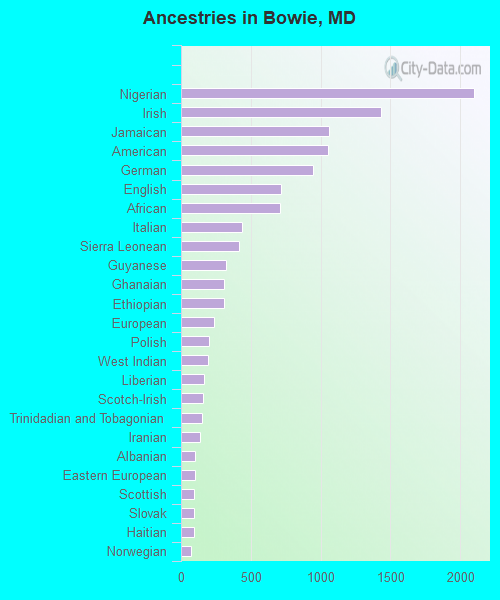
Ancestries in Bowie
2,102 6.1% Nigerian1,434 4.2% Irish1,059 3.1% Jamaican1,056 3.1% American943 2.7% German714 2.1% English711 2.1% African439 1.3% Italian419 1.2% Sierra Leonean326 0.9% Guyanese307 0.9% Ghanaian306 0.9% Ethiopian234 0.7% European198 0.6% Polish196 0.6% West Indian168 0.5% Liberian157 0.5% Scotch-Irish149 0.4% Trinidadian and Tobagonian134 0.4% Iranian97 0.3% Albanian97 0.3% Eastern European94 0.3% Scottish94 0.3% Slovak91 0.3% Haitian71 0.2% Norwegian59 0.2% French Canadian53 0.2% British50 0.1% French49 0.1% Barbadian47 0.1% South African47 0.1% British West Indian47 0.1% Russian41 0.1% Bahamian40 0.1% Hungarian40 0.1% Lithuanian35 0.1% Palestinian33 0.10% Northern European32 0.09% Cape Verdean30 0.09% Egyptian29 0.08% Welsh27 0.08% Czech26 0.08% Austrian26 0.08% Armenian21 0.06% Kenyan20 0.06% Carpatho Rusyn20 0.06% Danish20 0.06% Senegalese19 0.06% Arab18 0.05% Bulgarian18 0.05% Ukrainian16 0.05% Finnish16 0.05% Swedish12 0.03% Scandinavian12 0.03% Dutch10 0.03% Lebanese9 0.03% Belgian8 0.02% Portuguese7 0.02% Greek6 0.02% Celtic
Geographical mobility in Bowie Same house 1 year ago 13,875 95.9% White (Caucasian)28,909 91.2% Black or African American184 92.4% American Indian / Alaska Native1,662 85.1% Asian2,154 90.6% Other race3,878 83.0% Two or more races14,149 96.0% White alone, not Hispanic / Latino4,124 85.6% Hispanic or LatinoMoved within same county 150 1.0% White / Caucasian1,978 6.2% Black or African American226 11.6% Asian149 6.3% Other race443 9.5% Two or more races168 1.1% White alone, not Hispanic / Latino425 8.8% Hispanic or LatinoMoved within same state 280 1.9% White / Caucasian467 1.5% Black or African American18 9.0% American Indian / Alaska Native13 0.7% Asian22 0.9% Other race123 2.6% Two or more races290 2.0% White alone, not Hispanic / Latino116 2.4% Hispanic or LatinoMoved from different state 236 1.6% White / Caucasian270 0.9% Black or African American34 1.7% Asian17 0.7% Other race101 2.2% Two or more races251 1.7% White alone, not Hispanic / Latino49 1.0% Hispanic or LatinoMoved from abroad 22 0.2% White177 0.6% Black or African American39 2.0% Asian34 0.7% Two or more races12 0.1% White alone, not Hispanic / Latino10 0.2% Hispanic or Latino
Children Nativity (place of birth) in Bowie
Children under 6 years - Living with two parents Both parents native 1,478 100.0% NativeBoth parents foreign-born 312 100.0% NativeOne native, one foreign-born parent 445 100.0% NativeChildren under 6 years - Living with one parent Native parent 594 100.0% Native0 0.0% Foreign-bornForeign-born parent 293 92.2% Native25 7.8% Foreign-bornChildren 6 to 17 years - Living with two parents Both parents native 3,021 100.0% NativeBoth parents foreign-born 1,136 84.2% Native212 15.8% Foreign-bornOne native, one foreign-born parent 713 91.5% Native67 8.5% Foreign-bornChildren 6 to 17 years - Living with one parent Native parent 1,999 100.0% NativeForeign-born parent 976 52.8% Native873 47.2% Foreign-born
Grandparents responsible for own grandchildren in Bowie
Grandparents (30 to 59 years) White / Caucasian 28 33.7% Responsible for grandchildren54 66.3% Not responsible for grandchildrenBlack or African American 295 60.8% Responsible for grandchildren191 39.2% Not responsible for grandchildrenWhite alone, not Hispanic / Latino 19 24.2% Responsible for grandchildren59 75.8% Not responsible for grandchildrenHispanic or Latino 12 100.0% Responsible for grandchildrenGrandparents (60 years and over) White / Caucasian 7 4.4% Responsible for grandchildren151 95.6% Not responsible for grandchildrenBlack or African American 83 14.1% Responsible for grandchildren505 85.9% Not responsible for grandchildrenWhite alone, not Hispanic / Latino 7 4.1% Responsible for grandchildren161 95.9% Not responsible for grandchildrenHispanic or Latino 41 85.0% Responsible for grandchildren7 15.0% Not responsible for grandchildren