Races in Bettie, Texas (TX) Detailed Stats
Ancestries, Foreign-born residents, place of birth
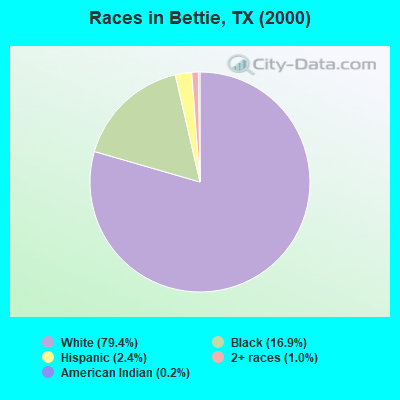
Race distribution in Bettie

- 2,59979.4%White alone
- 55416.9%Black alone
- 772.4%Hispanic
- 341.0%Two or more races
- 70.2%American Indian alone
- 30.09%Other race alone
- 10.03%Asian alone
2000
2022
-
- 10,933,31352.4%White alone
- 6,669,66632.0%Hispanic
- 2,364,25511.3%Black alone
- 554,4452.7%Asian alone
- 230,5671.1%Two or more races
- 68,8590.3%American Indian alone
- 19,9580.10%Other race alone
- 10,7570.05%Native Hawaiian and Other
Pacific Islander alone

-
- 12,070,64240.2%Hispanic
- 11,683,43038.9%White alone
- 3,508,70611.7%Black alone
- 1,608,1735.4%Asian alone
- 956,5603.2%Two or more races
- 125,7630.4%Other race alone
- 47,0230.2%American Indian alone
- 29,2750.10%Native Hawaiian and Other
Pacific Islander alone

Income and house value in Bettie
- Median household income in 2022
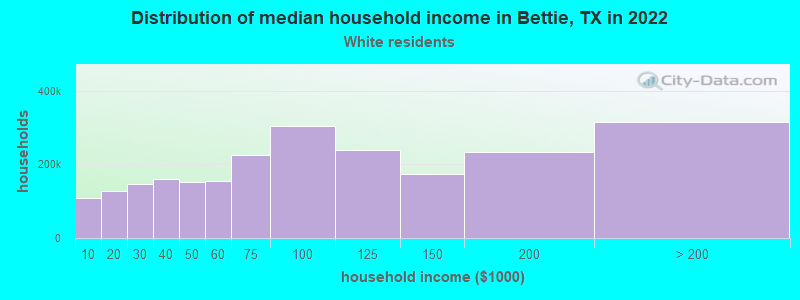
- $64,192White non-Hispanic householders
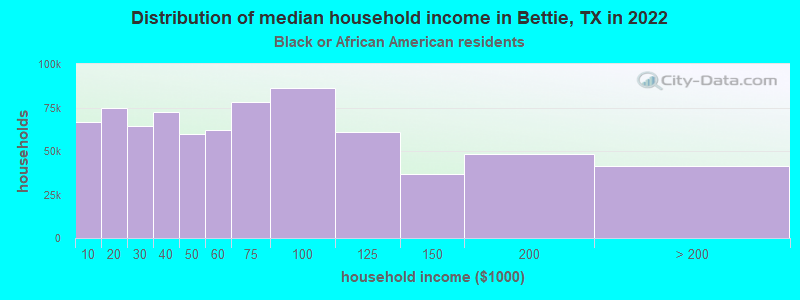
- $74,658Black householders
- $46,773Some other race householders
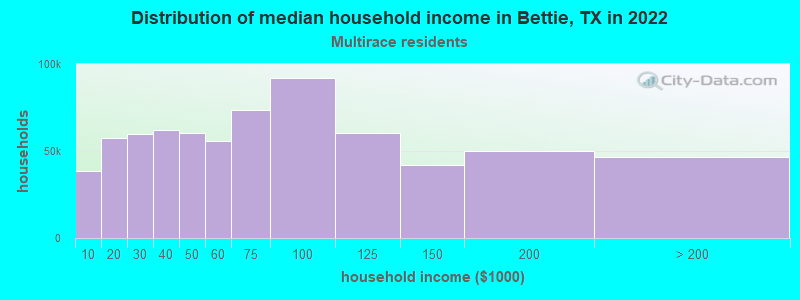
- $42,388Two or more races householders
- $49,286Hispanic or Latino race householders
- Median 2022 house value
- $173,536White Non-Hispanic householders
- $130,238Black or African American householders
- $246,387Some other race householders
- $128,863Two or more races householders
- $229,205Hispanic or Latino householders
Household income for White non-Hispanic householders
Household income for Black householders
Household income for Two or more races householders
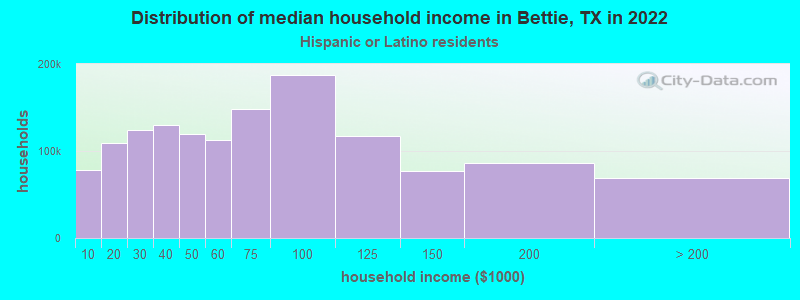
Household income for Hispanic or Latino race householders
Zip code: 75644