Races in Bakersfield, California (CA) Detailed Stats
Data:
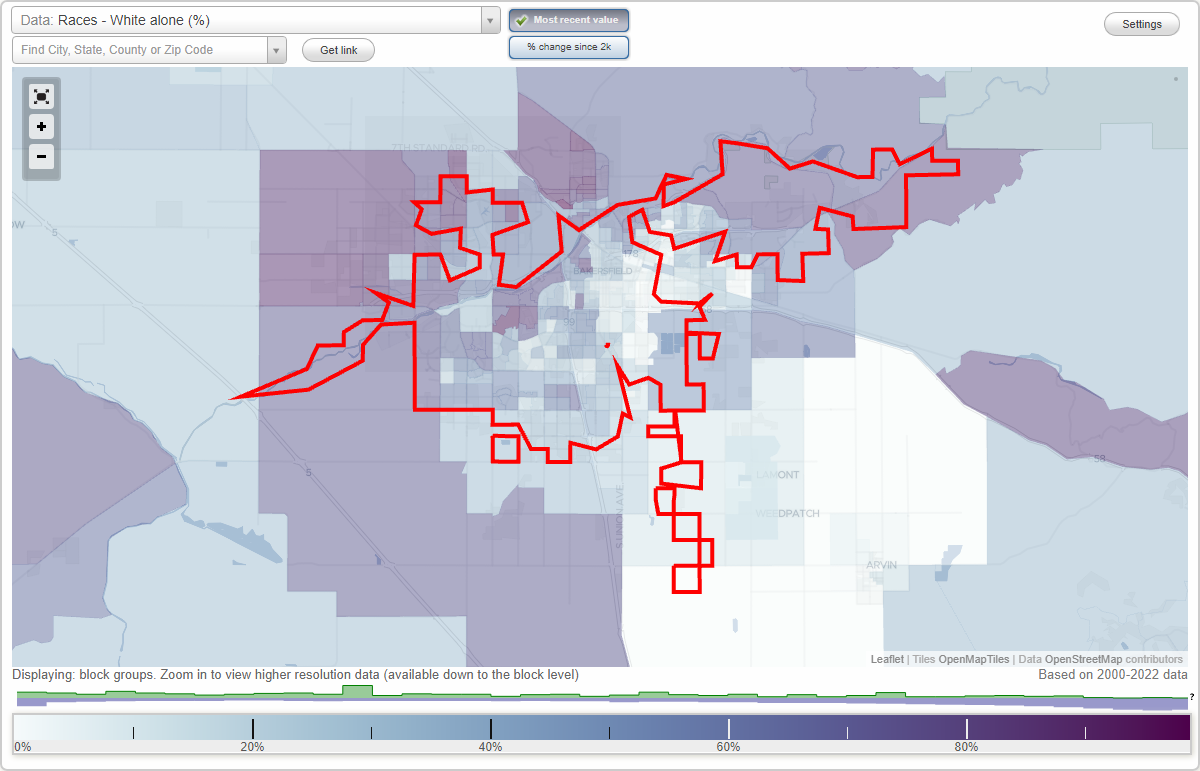
Races - White alone (%)
Races - White alone (% change since 2000)
Races - Black alone (%)
Races - Black alone (% change since 2000)
Races - American Indian alone (%)
Races - American Indian alone (% change since 2000)
Races - Asian alone (%)
Races - Asian alone (% change since 2000)
Races - Hispanic (%)
Races - Hispanic (% change since 2000)
Races - Native Hawaiian and Other Pacific Islander alone (%)
Races - Native Hawaiian and Other Pacific Islander alone (% change since 2000)
Races - Two or more races(%)
Races - Two or more races(% change since 2000)
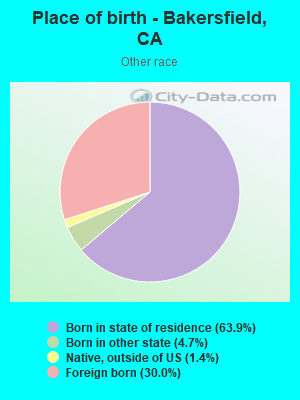
Races - Other race alone (%)
Races - Other race alone (% change since 2000)
Racial diversity
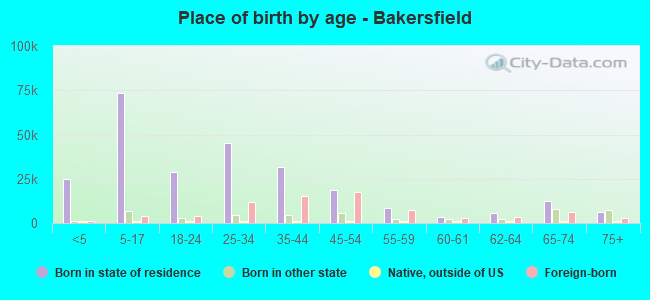
Place of birth - Born in state of residence (%)
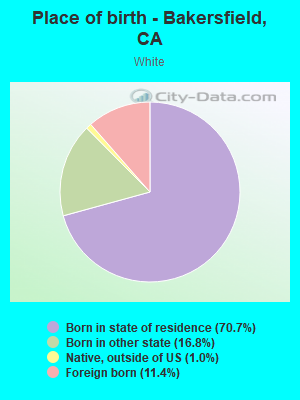
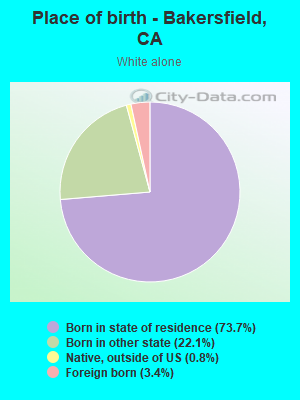
Place of birth - Born in state of residence (%) - White
Place of birth - Born in state of residence (%) - Black or African American
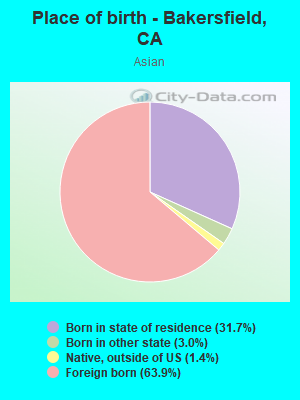
Place of birth - Born in state of residence (%) - Asian
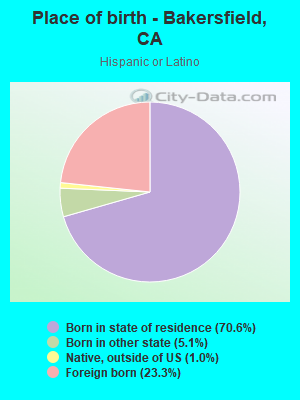
Place of birth - Born in state of residence (%) - Hispanic or Latino
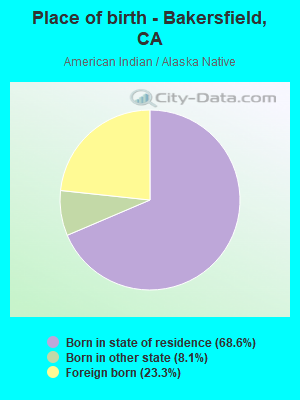
Place of birth - Born in state of residence (%) - American Indian and Alaska Native
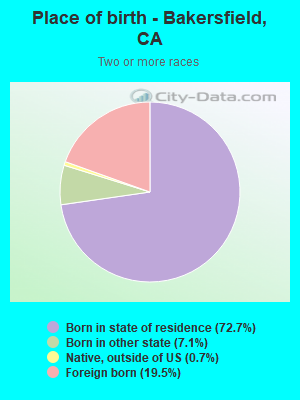
Place of birth - Born in state of residence (%) - Multirace
Place of birth - Born in state of residence (%) - Other Race
Place of birth - Born in other state (%)
Place of birth - Born in other state (%) - White
Place of birth - Born in other state (%) - Black or African American
Place of birth - Born in other state (%) - Asian
Place of birth - Born in other state (%) - Hispanic or Latino
Place of birth - Born in other state (%) - American Indian and Alaska Native
Place of birth - Born in other state (%) - Multirace
Place of birth - Born in other state (%) - Other Race
Place of birth - Native, outside of US (%)
Place of birth - Native, outside of US (%) - White
Place of birth - Native, outside of US (%) - Black or African American
Place of birth - Native, outside of US (%) - Asian
Place of birth - Native, outside of US (%) - Hispanic or Latino
Place of birth - Native, outside of US (%) - American Indian and Alaska Native
Place of birth - Native, outside of US (%) - Multirace
Place of birth - Native, outside of US (%) - Other Race
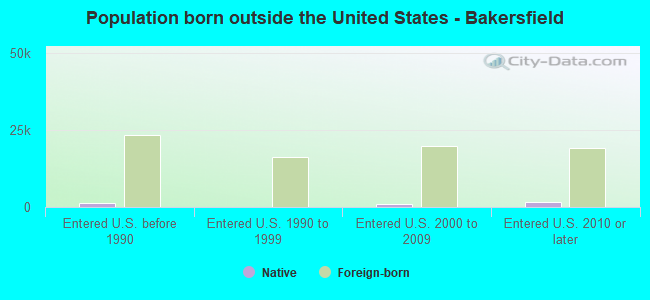
Place of birth - Foreign born (%)
Place of birth - Foreign born (%) - White
Place of birth - Foreign born (%) - Black or African American
Place of birth - Foreign born (%) - Asian
Place of birth - Foreign born (%) - Hispanic or Latino
Place of birth - Foreign born (%) - American Indian and Alaska Native
Place of birth - Foreign born (%) - Multirace
Place of birth - Foreign born (%) - Other Race
Residents speaking English at home (%)
Residents speaking English at home - Born in the United States (%)
Residents speaking English at home - Native, born elsewhere (%)
Residents speaking English at home - Foreign born (%)
Residents speaking Spanish at home (%)
Residents speaking Spanish at home - Born in the United States (%)
Residents speaking Spanish at home - Native, born elsewhere (%)
Residents speaking Spanish at home - Foreign born (%)
Residents speaking other language at home (%)
Residents speaking other language at home - Born in the United States (%)
Residents speaking other language at home - Native, born elsewhere (%)
Residents speaking other language at home - Foreign born (%)
Marital status - Never married (%)
Marital status - Now married (%)
Marital status - Separated (%)
Marital status - Widowed (%)
Marital status - Divorced (%)
Ancestries Reported - Arab (%)
Ancestries Reported - Czech (%)
Ancestries Reported - Danish (%)
Ancestries Reported - Dutch (%)
Ancestries Reported - English (%)
Ancestries Reported - French (%)
Ancestries Reported - French Canadian (%)
Ancestries Reported - German (%)
Ancestries Reported - Greek (%)
Ancestries Reported - Hungarian (%)
Ancestries Reported - Irish (%)
Ancestries Reported - Italian (%)
Ancestries Reported - Lithuanian (%)
Ancestries Reported - Norwegian (%)
Ancestries Reported - Polish (%)
Ancestries Reported - Portuguese (%)
Ancestries Reported - Russian (%)
Ancestries Reported - Scotch-Irish (%)
Ancestries Reported - Scottish (%)
Ancestries Reported - Slovak (%)
Ancestries Reported - Subsaharan African (%)
Ancestries Reported - Swedish (%)
Ancestries Reported - Swiss (%)
Ancestries Reported - Ukrainian (%)
Ancestries Reported - United States (%)
Ancestries Reported - Welsh (%)
Ancestries Reported - West Indian (%)
Ancestries Reported - Other (%)
Geographical mobility - Same house 1 year ago (%)
Geographical mobility - Same house 1 year ago (%) - White
Geographical mobility - Same house 1 year ago (%) - Black or African American
Geographical mobility - Same house 1 year ago (%) - Asian
Geographical mobility - Same house 1 year ago (%) - Hispanic or Latino
Geographical mobility - Same house 1 year ago (%) - American Indian and Alaska Native
Geographical mobility - Same house 1 year ago (%) - Multirace
Geographical mobility - Same house 1 year ago (%) - Other Race
Geographical mobility - Moved within same county (%)
Geographical mobility - Moved within same county (%) - White
Geographical mobility - Moved within same county (%) - Black or African American
Geographical mobility - Moved within same county (%) - Asian
Geographical mobility - Moved within same county (%) - Hispanic or Latino
Geographical mobility - Moved within same county (%) - American Indian and Alaska Native
Geographical mobility - Moved within same county (%) - Multirace
Geographical mobility - Moved within same county (%) - Other Race
Geographical mobility - Moved from different county within same state (%)
Geographical mobility - Moved from different county within same state (%) - White
Geographical mobility - Moved from different county within same state (%) - Black or African American
Geographical mobility - Moved from different county within same state (%) - Asian
Geographical mobility - Moved from different county within same state (%) - Hispanic or Latino
Geographical mobility - Moved from different county within same state (%) - American Indian and Alaska Native
Geographical mobility - Moved from different county within same state (%) - Multirace
Geographical mobility - Moved from different county within same state (%) - Other Race
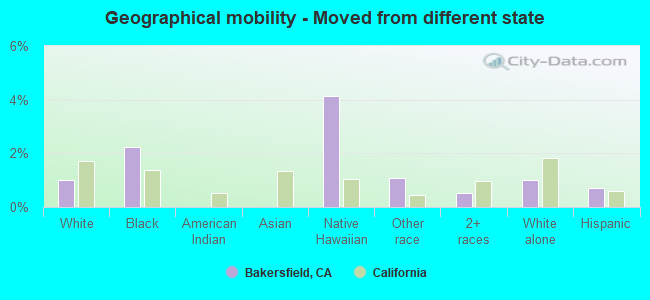
Geographical mobility - Moved from different state (%)
Geographical mobility - Moved from different state (%) - White
Geographical mobility - Moved from different state (%) - Black or African American
Geographical mobility - Moved from different state (%) - Asian
Geographical mobility - Moved from different state (%) - Hispanic or Latino
Geographical mobility - Moved from different state (%) - American Indian and Alaska Native
Geographical mobility - Moved from different state (%) - Multirace
Geographical mobility - Moved from different state (%) - Other Race
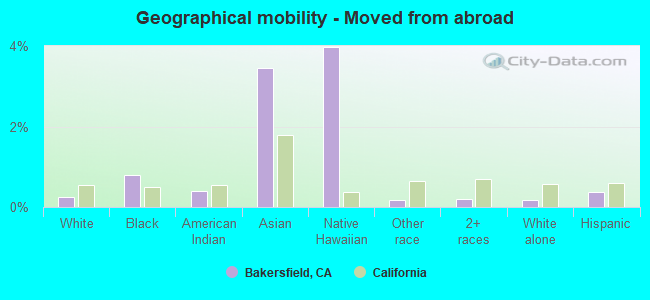
Geographical mobility - Moved from abroad (%)
Geographical mobility - Moved from abroad (%) - White
Geographical mobility - Moved from abroad (%) - Black or African American
Geographical mobility - Moved from abroad (%) - Asian
Geographical mobility - Moved from abroad (%) - Hispanic or Latino
Geographical mobility - Moved from abroad (%) - American Indian and Alaska Native
Geographical mobility - Moved from abroad (%) - Multirace
Geographical mobility - Moved from abroad (%) - Other Race
Place of birth for the foreign-born population - Ireland (%)
Place of birth for the foreign-born population - Denmark (%)
Place of birth for the foreign-born population - Norway (%)
Place of birth for the foreign-born population - Sweden (%)
Place of birth for the foreign-born population - United Kingdom (%)
Place of birth for the foreign-born population - England (%)
Place of birth for the foreign-born population - Scotland (%)
Place of birth for the foreign-born population - Other Northern Europe (%)
Place of birth for the foreign-born population - Austria (%)
Place of birth for the foreign-born population - Belgium (%)
Place of birth for the foreign-born population - France (%)
Place of birth for the foreign-born population - Germany (%)
Place of birth for the foreign-born population - Netherlands (%)
Place of birth for the foreign-born population - Switzerland (%)
Place of birth for the foreign-born population - Other Western Europe (%)
Place of birth for the foreign-born population - Greece (%)
Place of birth for the foreign-born population - Italy (%)
Place of birth for the foreign-born population - Portugal (%)
Place of birth for the foreign-born population - Spain (%)
Place of birth for the foreign-born population - Other Southern Europe (%)
Place of birth for the foreign-born population - Albania (%)
Place of birth for the foreign-born population - Belarus (%)
Place of birth for the foreign-born population - Bosnia and Herzegovina (%)
Place of birth for the foreign-born population - Bulgaria (%)
Place of birth for the foreign-born population - Croatia (%)
Place of birth for the foreign-born population - Czechoslovakia (%)
Place of birth for the foreign-born population - Hungary (%)
Place of birth for the foreign-born population - Latvia (%)
Place of birth for the foreign-born population - Lithuania (%)
Place of birth for the foreign-born population - North Macedonia (Macedonia) (%)
Place of birth for the foreign-born population - Moldova (%)
Place of birth for the foreign-born population - Poland (%)
Place of birth for the foreign-born population - Romania (%)
Place of birth for the foreign-born population - Russia (%)
Place of birth for the foreign-born population - Serbia (%)
Place of birth for the foreign-born population - Ukraine (%)
Place of birth for the foreign-born population - Other Eastern Europe (%)
Place of birth for the foreign-born population - China (%)
Place of birth for the foreign-born population - Hong Kong (%)
Place of birth for the foreign-born population - Taiwan (%)
Place of birth for the foreign-born population - Japan (%)
Place of birth for the foreign-born population - Korea (%)
Place of birth for the foreign-born population - Other Eastern Asia (%)
Place of birth for the foreign-born population - Afghanistan (%)
Place of birth for the foreign-born population - Bangladesh (%)
Place of birth for the foreign-born population - India (%)
Place of birth for the foreign-born population - Iran (%)
Place of birth for the foreign-born population - Kazakhstan (%)
Place of birth for the foreign-born population - Nepal (%)
Place of birth for the foreign-born population - Pakistan (%)
Place of birth for the foreign-born population - Sri Lanka (%)
Place of birth for the foreign-born population - Uzbekistan (%)
Place of birth for the foreign-born population - Other South Central Asia (%)
Place of birth for the foreign-born population - Burma (%)
Place of birth for the foreign-born population - Cambodia (%)
Place of birth for the foreign-born population - Indonesia (%)
Place of birth for the foreign-born population - Laos (%)
Place of birth for the foreign-born population - Malaysia (%)
Place of birth for the foreign-born population - Philippines (%)
Place of birth for the foreign-born population - Singapore (%)
Place of birth for the foreign-born population - Thailand (%)
Place of birth for the foreign-born population - Vietnam (%)
Place of birth for the foreign-born population - Other South Eastern Asia (%)
Place of birth for the foreign-born population - Armenia (%)
Place of birth for the foreign-born population - Iraq (%)
Place of birth for the foreign-born population - Israel (%)
Place of birth for the foreign-born population - Jordan (%)
Place of birth for the foreign-born population - Kuwait (%)
Place of birth for the foreign-born population - Lebanon (%)
Place of birth for the foreign-born population - Saudi Arabia (%)
Place of birth for the foreign-born population - Syria (%)
Place of birth for the foreign-born population - Turkey (%)
Place of birth for the foreign-born population - Yemen (%)
Place of birth for the foreign-born population - Other Western Asia (%)
Place of birth for the foreign-born population - Eritrea (%)
Place of birth for the foreign-born population - Ethiopia (%)
Place of birth for the foreign-born population - Kenya (%)
Place of birth for the foreign-born population - Somalia (%)
Place of birth for the foreign-born population - Uganda (%)
Place of birth for the foreign-born population - Zimbabwe (%)
Place of birth for the foreign-born population - Other Eastern Africa (%)
Place of birth for the foreign-born population - Cameroon (%)
Place of birth for the foreign-born population - Congo (%)
Place of birth for the foreign-born population - Democratic Republic of Congo (Zaire) (%)
Place of birth for the foreign-born population - Other Middle Africa (%)
Place of birth for the foreign-born population - Egypt (%)
Place of birth for the foreign-born population - Morocco (%)
Place of birth for the foreign-born population - Sudan (%)
Place of birth for the foreign-born population - Other Northern Africa (%)
Place of birth for the foreign-born population - South Africa (%)
Place of birth for the foreign-born population - Other Southern Africa (%)
Place of birth for the foreign-born population - Cabo Verde (%)
Place of birth for the foreign-born population - Ghana (%)
Place of birth for the foreign-born population - Liberia (%)
Place of birth for the foreign-born population - Nigeria (%)
Place of birth for the foreign-born population - Senegal (%)
Place of birth for the foreign-born population - Sierra Leone (%)
Place of birth for the foreign-born population - Other Western Africa (%)
Place of birth for the foreign-born population - Australia (%)
Place of birth for the foreign-born population - New Zealand (%)
Place of birth for the foreign-born population - Fiji (%)
Place of birth for the foreign-born population - Micronesia (%)
Place of birth for the foreign-born population - Bahamas (%)
Place of birth for the foreign-born population - Barbados (%)
Place of birth for the foreign-born population - Cuba (%)
Place of birth for the foreign-born population - Dominica (%)
Place of birth for the foreign-born population - Dominican Republic (%)
Place of birth for the foreign-born population - Grenada (%)
Place of birth for the foreign-born population - Haiti (%)
Place of birth for the foreign-born population - Jamaica (%)
Place of birth for the foreign-born population - St. Vincent and the Grenadines (%)
Place of birth for the foreign-born population - Trinidad and Tobago (%)
Place of birth for the foreign-born population - West Indies (%)
Place of birth for the foreign-born population - Other Caribbean (%)
Place of birth for the foreign-born population - Belize (%)
Place of birth for the foreign-born population - Costa Rica (%)
Place of birth for the foreign-born population - El Salvador (%)
Place of birth for the foreign-born population - Guatemala (%)
Place of birth for the foreign-born population - Honduras (%)
Place of birth for the foreign-born population - Mexico (%)
Place of birth for the foreign-born population - Nicaragua (%)
Place of birth for the foreign-born population - Panama (%)
Place of birth for the foreign-born population - Other Central America (%)
Place of birth for the foreign-born population - Argentina (%)
Place of birth for the foreign-born population - Bolivia (%)
Place of birth for the foreign-born population - Brazil (%)
Place of birth for the foreign-born population - Chile (%)
Place of birth for the foreign-born population - Colombia (%)
Place of birth for the foreign-born population - Ecuador (%)
Place of birth for the foreign-born population - Guyana (%)
Place of birth for the foreign-born population - Peru (%)
Place of birth for the foreign-born population - Uruguay (%)
Place of birth for the foreign-born population - Venezuela (%)
Place of birth for the foreign-born population - Other South America (%)
Place of birth for the foreign-born population - Canada (%)
Place of birth for the foreign-born population - Other Northern America (%)
Place of birth for the foreign-born population - Other (%)
Latest news about races in Bakersfield, CA collected exclusively by city-data.com from local newspapers, TV, and radio stations
According to 2022 data, the most numerous races in Bakersfield, CA are Hispanic (205,229 residents), White alone (107,371 residents), and Asian alone (30,161 residents). 58.8% of Bakersfield residents speak English at home. 18.9% of Bakersfield, CA residents are foreign-born (12.5% born in Latin America, 5.5% born in Asia), which is 37.9% less than the foreign-born rate of 26.0% across the entire state of California.
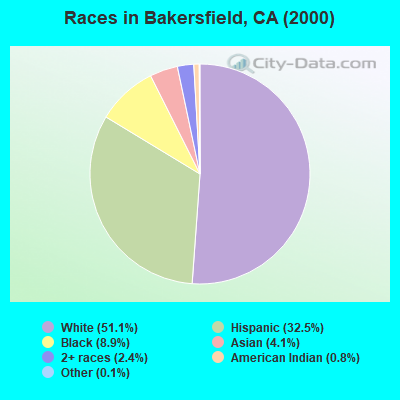
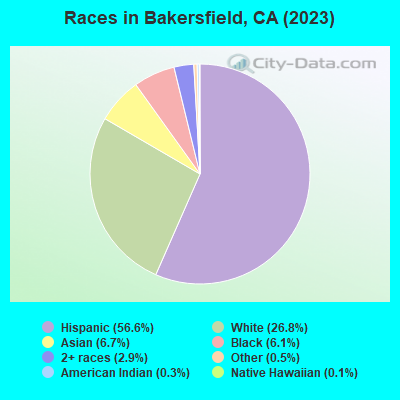
Race distribution in Bakersfield
2000 2022
126,183 51.1% White alone 80,170 32.5% Hispanic 21,987 8.9% Black alone 10,239 4.1% Asian alone 5,902 2.4% Two or more races 2,053 0.8% American Indian alone 335 0.1% Other race alone 188 0.08% Native Hawaiian and Other
205,229 53.3% Hispanic 107,371 27.9% White alone 30,161 7.8% Asian alone 24,769 6.4% Black alone 15,824 4.1% Two or more races 1,133 0.3% American Indian alone 812 0.2% Native Hawaiian and Other 509 0.1% Other race alone
2000 2022
15,816,790 46.7% White alone 10,966,556 32.4% Hispanic 3,648,860 10.8% Asian alone 2,181,926 6.4% Black alone 903,115 2.7% Two or more races 178,984 0.5% American Indian alone 103,736 0.3% Native Hawaiian and Other 71,681 0.2% Other race alone
15,732,184 40.3% Hispanic 13,160,426 33.7% White alone 5,957,867 15.3% Asian alone 2,025,218 5.2% Black alone 1,663,222 4.3% Two or more races 251,618 0.6% Other race alone 135,777 0.3% Native Hawaiian and Other 103,030 0.3% American Indian alone
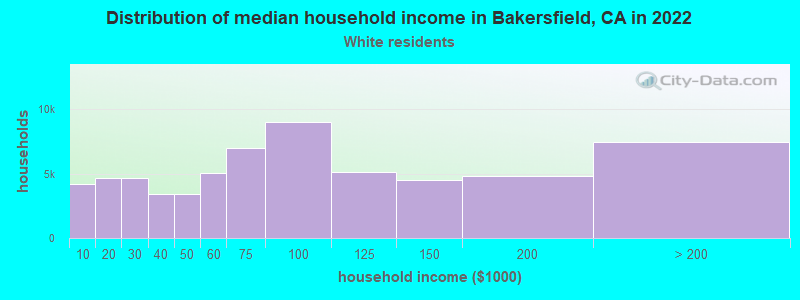
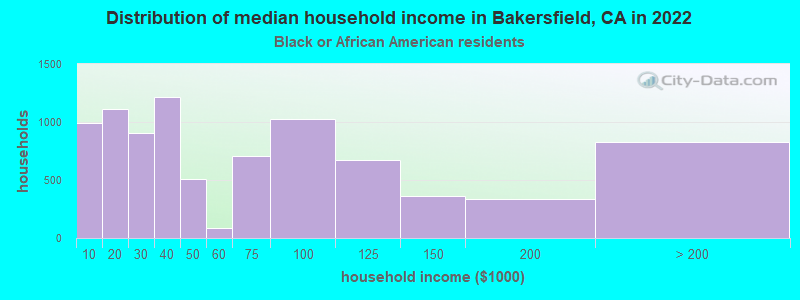
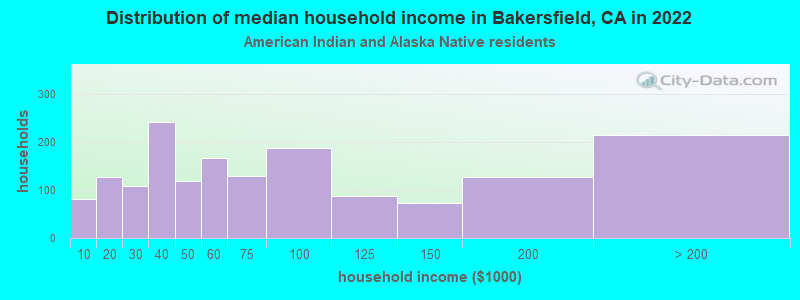
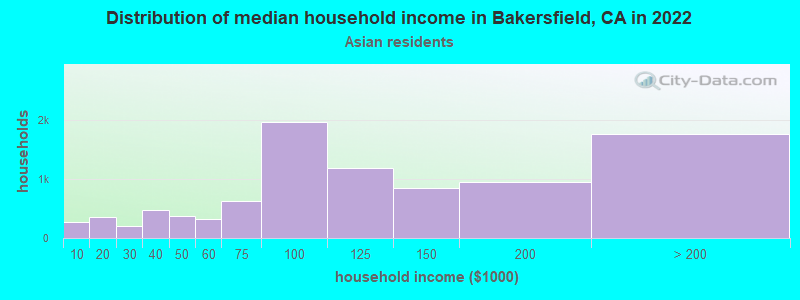
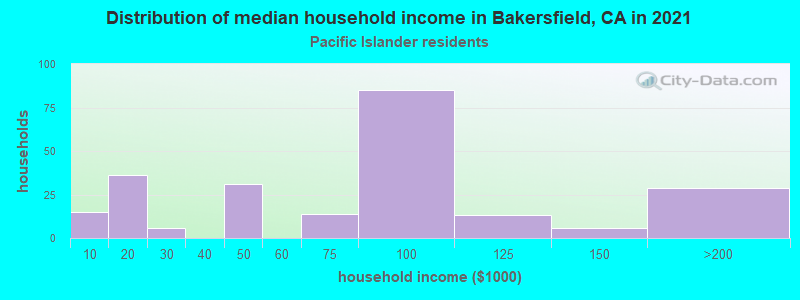
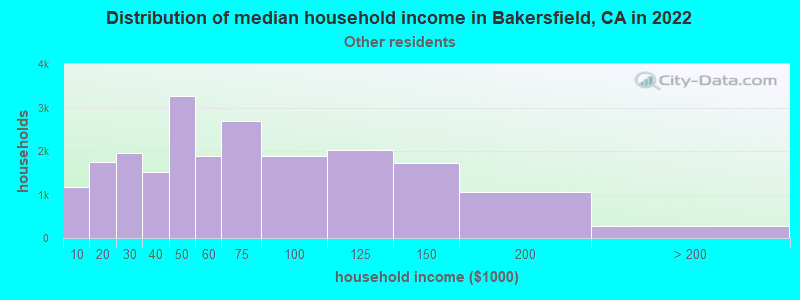
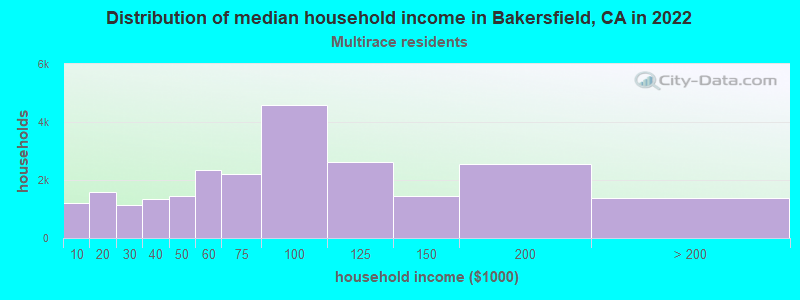
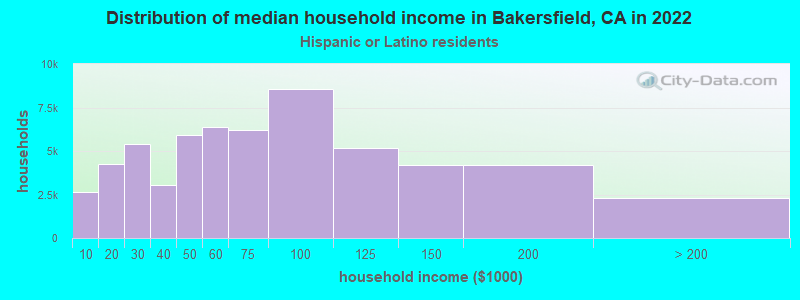
Income and house value in Bakersfield Median household income in 2022 $95,273 White non-Hispanic householders$48,569 Black householders$45,469 American Indian and Alaska Native householders$107,893 Asian householders$111,440 Native Hawaiian and other Pacific Islander householders$58,590 Some other race householders$79,666 Two or more races householders$65,819 Hispanic or Latino race householdersMedian 2022 house value $411,039 White Non-Hispanic householders$313,138 Black or African American householders$352,011 American Indian or Alaska Native householders $460,709 Asian householders$390,523 Native Hawaiian and other Pacific Islander householders$312,058 Some other race householders$359,569 Two or more races householders$320,697 Hispanic or Latino householders
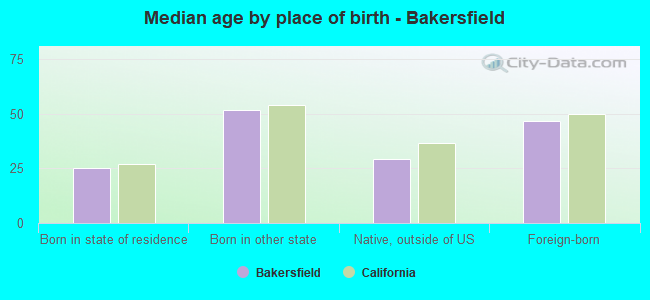
Median age by race in Bakersfield
33.5 Median age for White residents32.1 35.0 29.4 Median age for Black or African American residents29.6 29.0 36.2 Median age for American Indian / Alaska Native residents27.0 42.7 36.4 Median age for Asian residents35.8 39.6 36.6 Median age for Native Hawaiian / Pacific Islander residents44.2 31.2 31.8 Median age for Other race residents31.7 31.9 27.3 Median age for Two or more races residents29.4 24.0 42.6 Median age for White alone residents40.8 45.3 27.8 Median age for Hispanic or Latino residents26.5 29.2
Owner/renter occupied households by race in Bakersfield
House owners and renters - White residents 44,432 64.0% Owner occupied25,033 36.0% Renter occupiedHouse owners and renters - Black or African American residents 3,341 36.0% Owner occupied5,941 64.0% Renter occupiedHouse owners and renters - American Indian / Alaska Native residents 987 63.9% Owner occupied557 36.1% Renter occupiedHouse owners and renters - Asian residents 6,661 77.6% Owner occupied1,927 22.4% Renter occupiedHouse owners and renters - Native Hawaiian / Pacific Islander residents 120 45.5% Owner occupied143 54.5% Renter occupiedHouse owners and renters - Other race residents 9,982 56.9% Owner occupied7,563 43.1% Renter occupiedHouse owners and renters - Two or more races residents 5,488 46.6% Owner occupied6,295 53.4% Renter occupiedHouse owners and renters - White alone residents 30,462 71.2% Owner occupied12,294 28.8% Renter occupiedHouse owners and renters - Hispanic or Latino residents 29,831 54.2% Owner occupied25,161 45.8% Renter occupied
Language usage in Bakersfield
English speakers - Total 58.8% of residents of Bakersfield speak English at home.
33.5% of residents speak Spanish at home 81,119 69.4% Speak English very well35,767 30.6% Speak English less than very well7.7% of residents speak other language at home 16,338 60.5% Speak English very well10,653 39.5% Speak English less than very well
English speakers - Born in the United States 84.4% of residents of Bakersfield speak English at home.
13.4% of residents speak Spanish at home 5,113 89.2% Speak English very well617 10.8% Speak English less than very well2.2% of residents speak other language at home 897 96.5% Speak English very well33 3.5% Speak English less than very well
English speakers - Native, born elsewhere 38.4% of residents of Bakersfield speak English at home.
48.2% of residents speak Spanish at home 1,068 67.3% Speak English very well519 32.7% Speak English less than very well14.2% of residents speak other language at home 309 66.0% Speak English very well159 34.0% Speak English less than very well
English speakers - Foreign-born 8.8% of residents of Bakersfield speak English at home.
61.1% of residents speak Spanish at home 15,981 37.1% Speak English very well27,076 62.9% Speak English less than very well29.2% of residents speak other language at home 10,996 53.4% Speak English very well9,587 46.6% Speak English less than very well
White (Caucasian) - Speak only English Native:
74.8% (128,964)Foreign-born:
11.3% (2,711)
White (Caucasian) - Speak another language Native:
22.3% (38,517)Foreign-born:
86.6% (20,849)
Black or African American - Speak only English Native:
95.8% (23,363)Foreign-born:
37.1% (258)
Black or African American - Speak another language Native:
4.2% (1,016)Foreign-born:
60.4% (420)
American Indian / Alaska Native - Speak another language Native:
47.4% (1,623)Foreign-born:
100.0% (998)
Asian - Speak only English Native:
63.1% (6,521)Foreign-born:
10.8% (2,086)
Asian - Speak another language Native:
37.2% (3,845)Foreign-born:
89.1% (17,146)
Native Hawaiian / Pacific Islander - Speak only English Native:
92.8% (450)Foreign-born:
36.6% (97)
Native Hawaiian / Pacific Islander - Speak another language Native:
12.2% (59)Foreign-born:
68.5% (181)
Other race - Speak only English Native:
55.6% (18,125)Foreign-born:
10.7% (2,021)
Other race - Speak another language Native:
47.6% (15,490)Foreign-born:
90.8% (17,132)
Two or more races - Speak only English Native:
64.1% (19,030)Foreign-born:
4.4% (664)
Two or more races - Speak another language Native:
35.7% (10,592)Foreign-born:
100.0% (15,139)
White alone - Speak only English Native:
95.4% (94,355)Foreign-born:
38.8% (1,410)
White alone - Speak another language Native:
4.6% (4,501)Foreign-born:
61.0% (2,219)
Hispanic or Latino - Speak only English Native:
49.1% (68,986)Foreign-born:
7.7% (3,770)
Hispanic or Latino - Speak another language Native:
51.5% (72,383)Foreign-born:
92.9% (45,496)
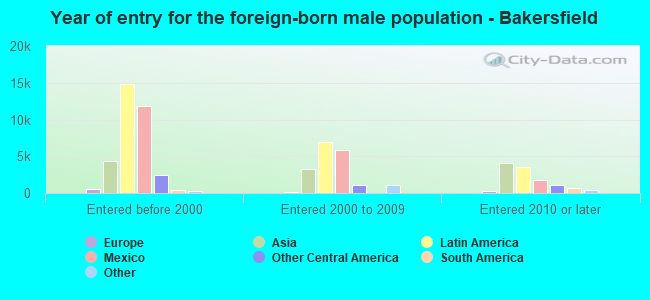
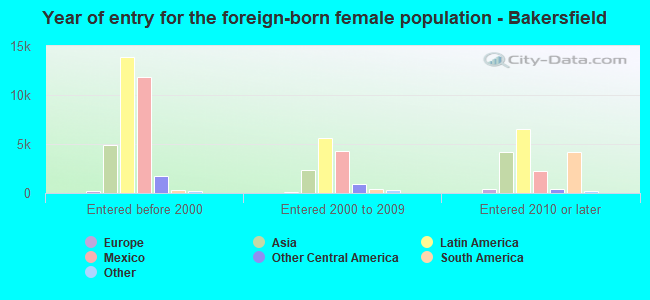
Foreign-born residents in Bakersfield 72,400 residents are foreign born (12.5% Latin America , 5.5% Asia ).
This city:
18.9%California:
100.0%
Marital status for residents in Bakersfield Marital status - White (Caucasian) population 15 years and over
Males 39.0% Never married50.5% Now married1.2% Separated1.8% Widowed7.5% DivorcedFemales 30.8% Never married48.2% Now married2.0% Separated8.0% Widowed10.9% DivorcedWomen who gave birth in the past 12 months Now married:
53.2% (2,145)Unmarried:
46.8% (1,888)
Women who did not give birth in the past 12 months Now married:
46.7% (21,165)Unmarried:
53.3% (24,139)
Marital status - Black or African American population 15 years and over
Males 50.3% Never married38.0% Now married2.5% Separated3.4% Widowed5.7% DivorcedFemales 52.7% Never married15.6% Now married3.2% Separated17.2% Widowed11.3% DivorcedWomen who gave birth in the past 12 months Now married:
25.7% (97)Unmarried:
74.3% (280)
Women who did not give birth in the past 12 months Now married:
17.9% (1,039)Unmarried:
82.1% (4,765)
Marital status - American Indian / Alaska Native population 15 years and over
Males 40.7% Never married49.6% Now married0.5% Separated2.9% Widowed6.3% DivorcedFemales 47.0% Never married34.1% Now married1.5% Separated5.5% Widowed11.9% DivorcedWomen who did not give birth in the past 12 months Now married:
27.2% (334)Unmarried:
72.8% (892)
Marital status - Asian population 15 years and over
Males 33.7% Never married63.2% Now married0.9% Separated1.2% Widowed1.0% DivorcedFemales 26.7% Never married65.6% Now married3.9% Separated3.2% Widowed0.6% DivorcedWomen who gave birth in the past 12 months Now married:
100.0% (917)Unmarried:
0.0% (0)
Women who did not give birth in the past 12 months Now married:
56.0% (3,920)Unmarried:
44.0% (3,083)
Marital status - Native Hawaiian / Pacific Islander population 15 years and over
Males 33.0% Never married47.8% Now married0.0% Separated0.0% Widowed19.1% DivorcedFemales 30.2% Never married62.6% Now married0.0% Separated7.1% Widowed0.0% DivorcedWomen who gave birth in the past 12 months Now married:
100.0% (7)Unmarried:
0.0% (0)
Women who did not give birth in the past 12 months Now married:
57.3% (110)Unmarried:
42.7% (82)
Marital status - Other race population 15 years and over
Males 47.7% Never married41.8% Now married0.0% Separated2.4% Widowed8.1% DivorcedFemales 32.8% Never married43.4% Now married3.7% Separated9.3% Widowed10.8% DivorcedWomen who gave birth in the past 12 months Now married:
20.7% (188)Unmarried:
79.3% (721)
Women who did not give birth in the past 12 months Now married:
41.5% (5,950)Unmarried:
58.5% (8,402)
Marital status - Two or more races population 15 years and over
Males 53.3% Never married31.9% Now married0.0% Separated3.8% Widowed11.0% DivorcedFemales 46.4% Never married36.7% Now married0.6% Separated11.3% Widowed5.0% DivorcedWomen who gave birth in the past 12 months Now married:
30.0% (124)Unmarried:
70.0% (289)
Women who did not give birth in the past 12 months Now married:
39.2% (4,043)Unmarried:
60.8% (6,266)
Marital status - White alone, not Hispanic / Latino population 15 years and over
Males 30.9% Never married54.3% Now married1.1% Separated1.8% Widowed11.8% DivorcedFemales 20.2% Never married49.8% Now married1.6% Separated11.7% Widowed16.7% DivorcedWomen who gave birth in the past 12 months Now married:
55.2% (728)Unmarried:
44.8% (591)
Women who did not give birth in the past 12 months Now married:
48.3% (10,531)Unmarried:
51.7% (11,254)
Marital status - Hispanic or Latino population 15 years and over
Males 47.0% Never married45.2% Now married0.9% Separated1.9% Widowed5.1% DivorcedFemales 38.4% Never married45.5% Now married2.7% Separated5.7% Widowed7.8% DivorcedWomen who gave birth in the past 12 months Now married:
46.4% (2,155)Unmarried:
53.6% (2,486)
Women who did not give birth in the past 12 months Now married:
44.5% (22,130)Unmarried:
55.5% (27,633)
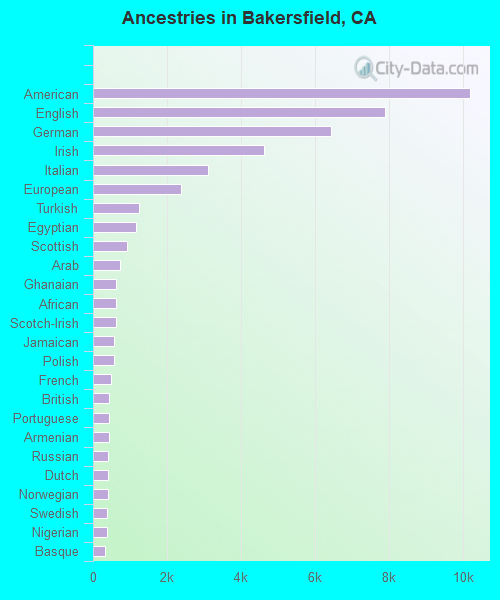
Ancestries in Bakersfield
8,555 3.4% American6,273 2.5% English5,612 2.2% German4,746 1.9% Irish4,388 1.7% European2,582 1.0% Italian1,126 0.4% African1,001 0.4% Scottish992 0.4% Egyptian660 0.3% Nigerian620 0.2% Norwegian587 0.2% British585 0.2% French547 0.2% Arab466 0.2% Scotch-Irish412 0.2% Portuguese385 0.2% Scandinavian363 0.1% Northern European361 0.1% Polish354 0.1% Iranian338 0.1% Dutch296 0.1% Canadian286 0.1% Swedish272 0.1% Eastern European272 0.1% Syrian269 0.1% Russian262 0.1% Welsh224 0.09% Basque222 0.09% Armenian212 0.08% Greek194 0.08% Jordanian192 0.08% French Canadian188 0.07% Croatian187 0.07% Lebanese183 0.07% Jamaican172 0.07% Danish131 0.05% Belizean128 0.05% Sudanese123 0.05% Finnish106 0.04% Belgian98 0.04% Afghan93 0.04% Kenyan91 0.04% Romanian79 0.03% Czech72 0.03% Ukrainian71 0.03% Slavic58 0.02% Hungarian57 0.02% Assyrian52 0.02% Turkish49 0.02% Brazilian49 0.02% Swiss39 0.02% Czechoslovakian38 0.02% Maltese32 0.01% Celtic32 0.01% Haitian24 0.01% Somali21 0.01% Yugoslavian21 0.01% Trinidadian and Tobagonian20 0.01% Lithuanian17 0.01% Palestinian17 0.01% Ethiopian16 0.01% Ghanaian16 0.01% Latvian14 0.01% Serbian14 0.01% West Indian
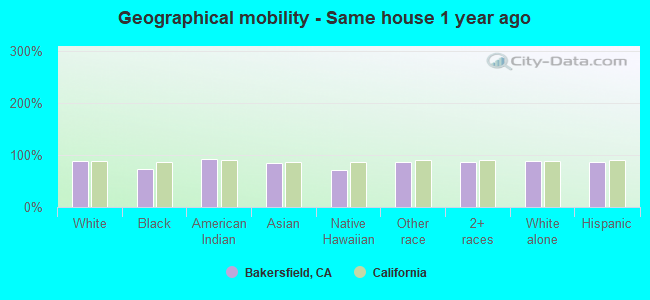
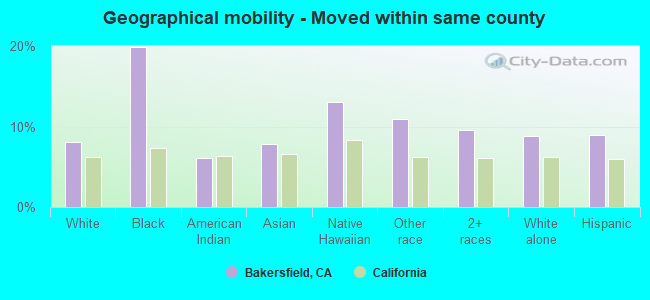
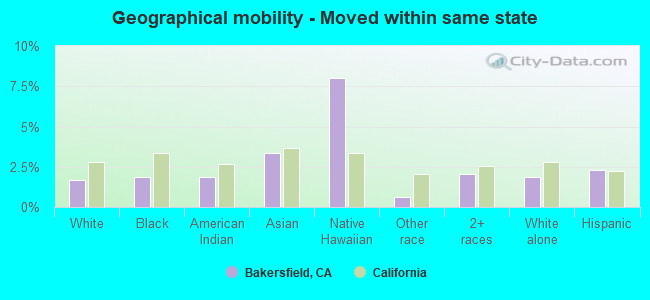
Geographical mobility in Bakersfield Same house 1 year ago 184,107 88.9% White (Caucasian)18,521 72.9% Black or African American4,260 93.0% American Indian / Alaska Native25,751 84.7% Asian580 71.0% Native Hawaiian / Pacific Islander46,951 86.1% Other race33,708 87.0% Two or more races101,649 88.0% White alone, not Hispanic / Latino165,766 87.2% Hispanic or LatinoMoved within same county 16,719 8.1% White / Caucasian5,053 19.9% Black or African American277 6.0% American Indian / Alaska Native2,375 7.8% Asian107 13.1% Native Hawaiian / Pacific Islander5,979 11.0% Other race3,694 9.5% Two or more races10,218 8.8% White alone, not Hispanic / Latino16,990 8.9% Hispanic or LatinoMoved within same state 3,412 1.6% White / Caucasian473 1.9% Black or African American85 1.9% American Indian / Alaska Native1,025 3.4% Asian65 8.0% Native Hawaiian / Pacific Islander346 0.6% Other race783 2.0% Two or more races2,186 1.9% White alone, not Hispanic / Latino4,375 2.3% Hispanic or LatinoMoved from different state 2,094 1.0% White / Caucasian571 2.2% Black or African American34 4.1% Native Hawaiian / Pacific Islander591 1.1% Other race196 0.5% Two or more races1,180 1.0% White alone, not Hispanic / Latino1,326 0.7% Hispanic or LatinoMoved from abroad 531 0.3% White200 0.8% Black or African American18 0.4% American Indian / Alaska Native1,052 3.5% Asian32 4.0% Native Hawaiian / Pacific Islander101 0.2% Other race78 0.2% Two or more races212 0.2% White alone, not Hispanic / Latino698 0.4% Hispanic or Latino
Children Nativity (place of birth) in Bakersfield
Children under 6 years - Living with two parents Both parents native 10,068 100.0% NativeBoth parents foreign-born 3,640 100.0% NativeOne native, one foreign-born parent 2,682 100.0% NativeChildren under 6 years - Living with one parent Native parent 10,858 99.9% Native13 0.1% Foreign-bornForeign-born parent 2,383 72.4% Native909 27.6% Foreign-bornChildren 6 to 17 years - Living with two parents Both parents native 24,970 100.0% NativeBoth parents foreign-born 13,038 90.4% Native1,379 9.6% Foreign-bornOne native, one foreign-born parent 8,382 93.2% Native611 6.8% Foreign-bornChildren 6 to 17 years - Living with one parent Native parent 16,682 100.0% NativeForeign-born parent 7,225 56.6% Native5,532 43.4% Foreign-born
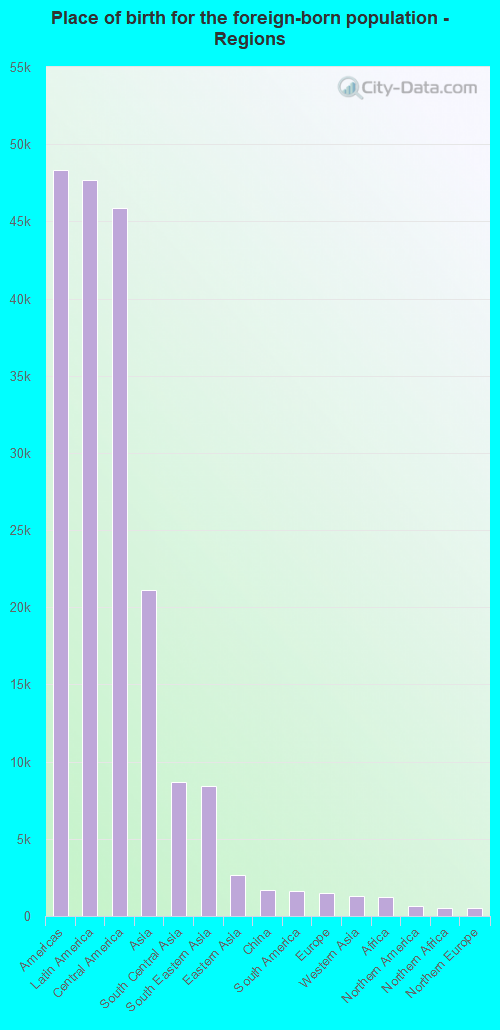
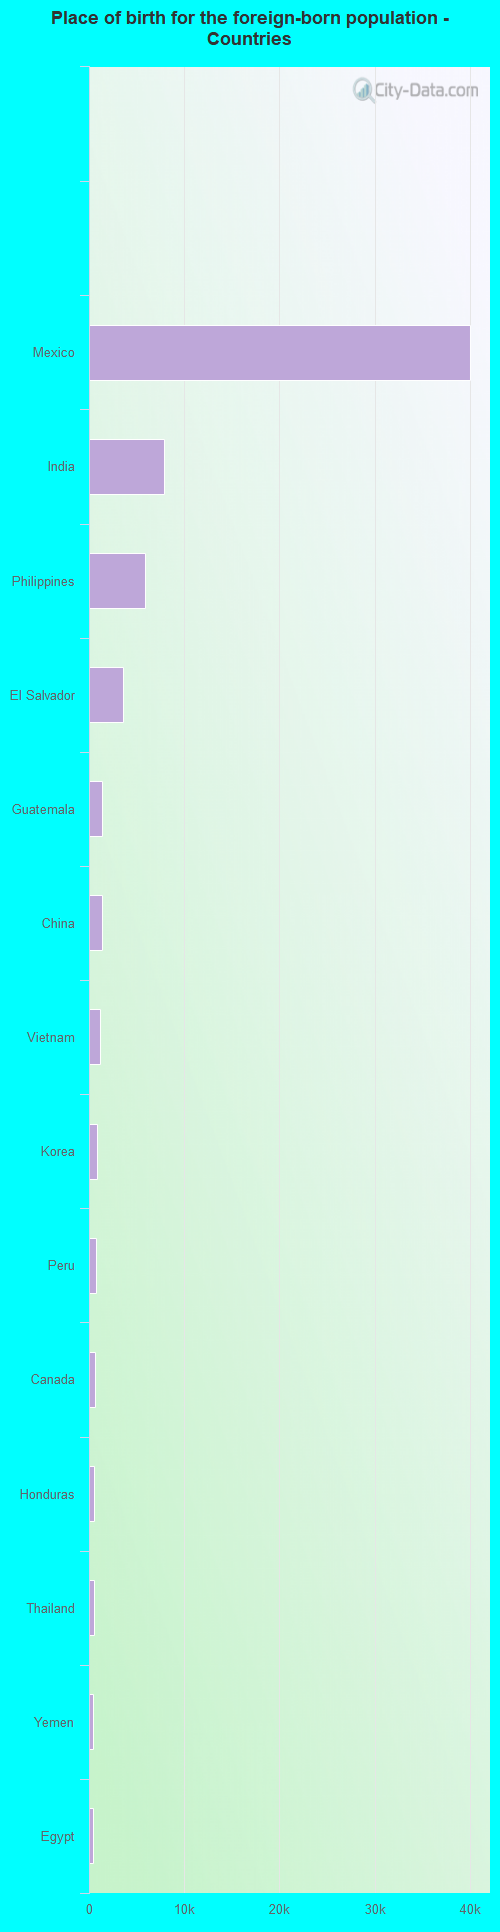
Place of birth for residents in Bakersfield 48,332 Americas47,679 Latin America45,883 Central America21,108 Asia8,655 South Central Asia8,419 South Eastern Asia2,628 Eastern Asia1,661 China1,605 South America1,484 Europe1,306 Western Asia1,251 Africa653 Northern America508 Northern Africa507 Northern Europe380 Western Africa332 Western Europe325 Southern Europe320 Eastern Europe226 Eastern Africa222 Oceania190 Caribbean71 Southern Africa52 Australia and New Zealand Subregion27 Middle Africa40,008 Mexico7,891 India5,925 Philippines3,622 El Salvador1,405 Guatemala1,317 China1,112 Vietnam827 Korea697 Peru653 Canada531 Honduras478 Thailand435 Yemen406 Egypt336 Nigeria312 Colombia310 Burma309 Iran271 Pakistan263 England262 Syria244 Argentina238 Hong Kong225 Cambodia179 Nicaragua178 Jordan154 Germany151 Kenya143 Indonesia139 Japan118 Kuwait112 Russia112 France111 Spain106 Fiji105 Taiwan102 Laos102 Malaysia95 Portugal93 Venezuela92 United Kingdom87 Sudan80 Bolivia79 Iraq72 Chile69 Cuba68 Afghanistan64 Romania64 Greece62 Turkey62 Sweden62 Ireland60 South Africa58 Sri Lanka58 Moldova57 Belize50 Uruguay47 Bangladesh47 Costa Rica45 Australia44 Saudi Arabia44 Ghana42 Italy40 Lebanon36 Jamaica32 Belgium31 Haiti31 Panama31 Brazil27 Cameroon26 Dominican Republic26 Netherlands25 Israel23 Ethiopia19 Trinidad and Tobago19 Singapore15 Eritrea15 Morocco15 Latvia13 Ukraine13 Lithuania10 Denmark9 Ecuador8 Hungary8 Nepal7 Poland7 Scotland7 Bahamas7 New Zealand6 Austria4 Uganda
Grandparents responsible for own grandchildren in Bakersfield
Grandparents (30 to 59 years) White / Caucasian 1,179 58.8% Responsible for grandchildren825 41.2% Not responsible for grandchildrenBlack or African American 181 45.8% Responsible for grandchildren214 54.2% Not responsible for grandchildrenAmerican Indian / Alaska Native 10 11.1% Responsible for grandchildren77 88.9% Not responsible for grandchildrenAsian 147 50.7% Responsible for grandchildren143 49.3% Not responsible for grandchildrenNative Hawaiian / Pacific Islander 7 100.0% Responsible for grandchildrenOther race 238 24.4% Responsible for grandchildren738 75.6% Not responsible for grandchildrenTwo or more races 128 34.4% Responsible for grandchildren245 65.6% Not responsible for grandchildrenWhite alone, not Hispanic / Latino 439 90.3% Responsible for grandchildren47 9.7% Not responsible for grandchildrenHispanic or Latino 1,382 34.5% Responsible for grandchildren2,621 65.5% Not responsible for grandchildrenGrandparents (60 years and over) White / Caucasian 235 14.2% Responsible for grandchildren1,422 85.8% Not responsible for grandchildrenBlack or African American 132 36.2% Responsible for grandchildren232 63.8% Not responsible for grandchildrenAmerican Indian / Alaska Native 110 100.0% Not responsible for grandchildrenAsian 161 14.4% Responsible for grandchildren955 85.6% Not responsible for grandchildrenOther race 114 15.7% Responsible for grandchildren612 84.3% Not responsible for grandchildrenTwo or more races 52 36.2% Responsible for grandchildren92 63.8% Not responsible for grandchildrenWhite alone, not Hispanic / Latino 150 12.5% Responsible for grandchildren1,052 87.5% Not responsible for grandchildrenHispanic or Latino 368 21.1% Responsible for grandchildren1,373 78.9% Not responsible for grandchildren
Zip codes: 93220 , 93301 , 93304 , 93305 , 93306 , 93307 , 93308 , 93309 , 93311 , 93312 , 93313 , 93314 .