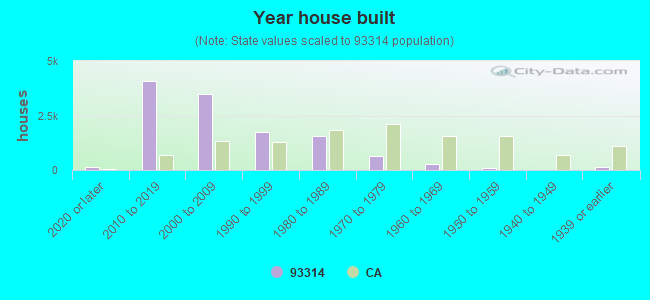
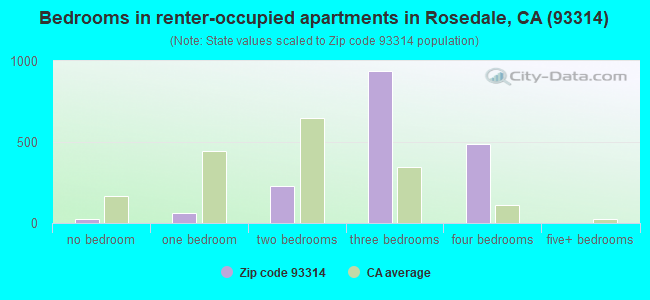
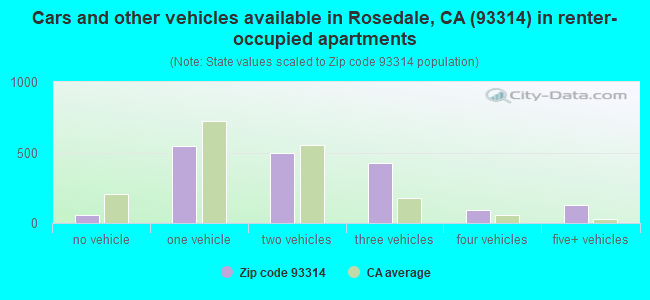
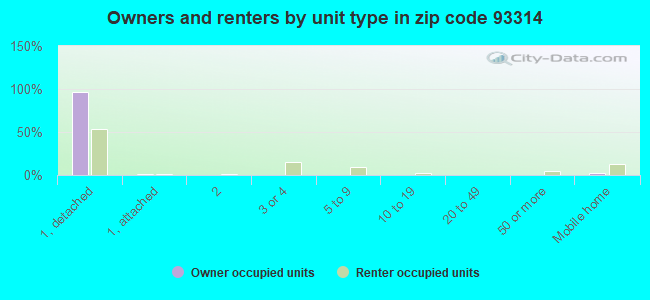
Houses and condos: 11,438 Renter-occupied apartments: 1,739
% of renters here:
16%
State:
44%
March 2022 cost of living index in zip code 93314: 95.8 (near average, U.S. average is 100)
Land area: 98.9 sq. mi. Water area: 0.4 sq. mi.
Population density: 342 people per square mile
(very low).
OSM Map
Google Map
MSN Map
OSM Map
General Map
Google Map
MSN Map
OSM Map
Google Map
MSN Map
OSM Map
Google Map
MSN Map
Please wait while loading the map...
Real estate property taxes paid for housing units in 2022:
This zip code:
1.1% ($5,537)
California:
0.7% ($4,831)
Median real estate property taxes paid for housing units with mortgages in 2022: $5,739 (1.1%) Median real estate property taxes paid for housing units with no mortgage in 2022: $4,797 (1.0%)
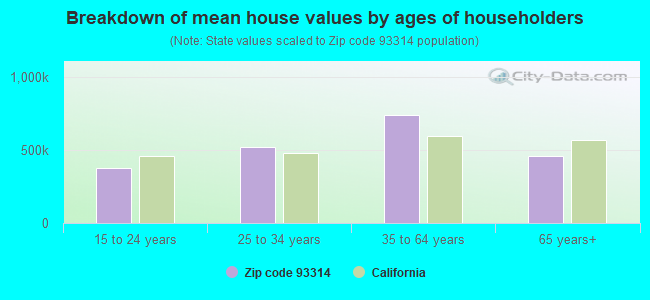
Estimated median house/condo value in 2022: $509,154
93314:
$509,154
California:
$715,900
According to our research of California and other state lists, there were 22 registered sex offenders living in 93314 zip code as of April 27, 2024. The ratio of all residents to sex offenders in zip code 93314 is 1,208 to 1. The ratio of registered sex offenders to all residents in this zip code is lower than the state average.
Median resident age:
This zip code:
36.6 years
California median age:
37.9 years
Average household size:
This zip code:
3.1 people
California:
2.8 people
Averages for the 2020 tax year for zip code 93314, filed in 2021:
Average Adjusted Gross Income (AGI) in 2020: $107,765 (Individual Income Tax Returns)
Here:
$107,765
State:
$95,910
Salary/wage: $92,737 (reported on 83.5% of returns)
Here:
$92,737
State:
$77,331
(% of AGI for various income ranges: 1260.3% for AGIs below $25k, 3950.5% for AGIs $25k-50k, 7468.0% for AGIs $50k-75k, 10870.3% for AGIs $75k-100k, 22095.9% for AGIs $100k-200k, 78549.4% for AGIs over 200k)
Taxable interest for individuals: $1,305 (reported on 49.8% of returns)
This zip code:
$1,305
California:
$2,294
(% of AGI for various income ranges: 11.6% for AGIs below $25k, 36.7% for AGIs $25k-50k, 54.3% for AGIs $50k-75k, 47.8% for AGIs $75k-100k, 109.9% for AGIs $100k-200k, 1049.6% for AGIs over 200k)
Ordinary dividends: $10,461 (reported on 17.5% of returns)
Here:
$10,461
State:
$10,949
(% of AGI for various income ranges: 20.5% for AGIs below $25k, 36.4% for AGIs $25k-50k, 58.7% for AGIs $50k-75k, 95.3% for AGIs $75k-100k, 174.3% for AGIs $100k-200k, 4043.1% for AGIs over 200k)
Net capital gain/loss in AGI: +$24,294 (reported on 19.2% of returns)
Here:
+$24,294
State:
+$49,306
(% of AGI for various income ranges: 14.5% for AGIs below $25k, 30.1% for AGIs $25k-50k, 78.0% for AGIs $50k-75k, 108.1% for AGIs $75k-100k, 325.3% for AGIs $100k-200k, 11501.0% for AGIs over 200k)
Profit/loss from business: +$13,887 (reported on 19.1% of returns)
Here:
+$13,887
State:
+$15,671
(% of AGI for various income ranges: 147.1% for AGIs below $25k, 260.7% for AGIs $25k-50k, 259.2% for AGIs $50k-75k, 343.3% for AGIs $75k-100k, 370.9% for AGIs $100k-200k, 3463.3% for AGIs over 200k)
Taxable individual retirement arrangement distribution: $26,780 (reported on 6.6% of returns)
93314:
$26,780
California:
$23,505
(% of AGI for various income ranges: 39.6% for AGIs below $25k, 84.7% for AGIs $25k-50k, 180.4% for AGIs $50k-75k, 270.4% for AGIs $75k-100k, 517.8% for AGIs $100k-200k, 1682.5% for AGIs over 200k)
Self-employed (Keogh) retirement plans: $30,967 (reported on 0.6% of returns)
93314:
$30,967
California:
$30,163
(% of AGI for various income ranges: 32.0% for AGIs $100k-200k, 417.3% for AGIs over 200k)
Total itemized deductions: $33,111 (reported on 24.7% of returns)
Here:
$33,111
State:
$39,517
(% of AGI for various income ranges: 109.7% for AGIs below $25k, 305.9% for AGIs $25k-50k, 738.1% for AGIs $50k-75k, 1264.3% for AGIs $75k-100k, 2352.9% for AGIs $100k-200k, 8597.5% for AGIs over 200k)
Charity contributions: $9,433 (reported on 21.9% of returns)
Here:
$9,433
State:
$12,598
(% of AGI for various income ranges: 7.9% for AGIs below $25k, 38.0% for AGIs $25k-50k, 91.2% for AGIs $50k-75k, 173.1% for AGIs $75k-100k, 493.7% for AGIs $100k-200k, 3239.4% for AGIs over 200k)
Taxes paid: $9,258 (reported on 24.7% of returns)
93314:
$9,258
State:
$8,807
(% of AGI for various income ranges: 23.4% for AGIs below $25k, 73.3% for AGIs $25k-50k, 220.5% for AGIs $50k-75k, 409.5% for AGIs $75k-100k, 748.0% for AGIs $100k-200k, 1974.9% for AGIs over 200k)
Earned income credit: $2,133 (reported on 9.1% of returns)
Here:
$2,133
State:
$2,074
(% of AGI for various income ranges: 73.3% for AGIs below $25k, 74.7% for AGIs $25k-50k, 1.4% for AGIs $50k-75k)
Percentage of individuals using paid preparers for their 2020 taxes: 95.3%
Here:
95%
State:
92%
(% for various income ranges: 93.9% for AGIs below $25k, 95.1% for AGIs $25k-50k, 95.8% for AGIs $50k-75k, 95.5% for AGIs $75k-100k, 96.0% for AGIs $100k-200k, 95.9% for AGIs over 200k)
Averages for the 2012 tax year for zip code 93314, filed in 2013:
Average Adjusted Gross Income (AGI) in 2012: $111,852 (Individual Income Tax Returns)
Here:
$111,852
State:
$72,726
Salary/wage: $81,881 (reported on 86.3% of returns)
Here:
$81,881
State:
$59,079
(% of AGI for various income ranges: 73.5% for AGIs below $25k, 77.6% for AGIs $25k-50k, 79.8% for AGIs $50k-75k, 81.6% for AGIs $75k-100k, 82.1% for AGIs $100k-200k, 40.4% for AGIs over 200k)
Taxable interest for individuals: $1,569 (reported on 50.2% of returns)
This zip code:
$1,569
California:
$2,146
(% of AGI for various income ranges: 1.3% for AGIs below $25k, 0.7% for AGIs $25k-50k, 0.7% for AGIs $50k-75k, 0.6% for AGIs $75k-100k, 0.4% for AGIs $100k-200k, 0.9% for AGIs over 200k)
Ordinary dividends: $6,794 (reported on 18.6% of returns)
Here:
$6,794
State:
$9,308
(% of AGI for various income ranges: 1.3% for AGIs below $25k, 0.8% for AGIs $25k-50k, 0.4% for AGIs $50k-75k, 0.4% for AGIs $75k-100k, 0.5% for AGIs $100k-200k, 1.9% for AGIs over 200k)
Net capital gain/loss in AGI: +$18,207 (reported on 16.1% of returns)
Here:
+$18,207
State:
+$30,460
(% of AGI for various income ranges: 0.6% for AGIs $25k-50k, 0.4% for AGIs $50k-75k, 0.4% for AGIs $75k-100k, 0.7% for AGIs $100k-200k, 5.3% for AGIs over 200k)
Profit/loss from business: +$23,019 (reported on 18.0% of returns)
Here:
+$23,019
State:
+$17,064
(% of AGI for various income ranges: 8.9% for AGIs below $25k, 7.7% for AGIs $25k-50k, 3.6% for AGIs $50k-75k, 3.4% for AGIs $75k-100k, 4.0% for AGIs $100k-200k, 2.8% for AGIs over 200k)
Taxable individual retirement arrangement distribution: $20,717 (reported on 6.8% of returns)
93314:
$20,717
California:
$19,557
(% of AGI for various income ranges: 2.4% for AGIs below $25k, 2.0% for AGIs $25k-50k, 2.1% for AGIs $50k-75k, 1.5% for AGIs $75k-100k, 1.4% for AGIs $100k-200k, 0.8% for AGIs over 200k)
Self-employment retirement plans: $28,655 (reported on 1.1% of returns)
93314:
$28,655
California:
$24,530
(% of AGI for various income ranges: 0.7% for AGIs $25k-50k, 0.2% for AGIs $100k-200k, 0.4% for AGIs over 200k)
Total itemized deductions: $36,300 (21% of AGI, reported on 57.1% of returns)
Here:
$36,300
State:
$34,004
Here:
21.1% of AGI
State:
22.7% of AGI
(% of AGI for various income ranges: 13.6% for AGIs below $25k, 15.6% for AGIs $25k-50k, 20.8% for AGIs $50k-75k, 21.1% for AGIs $75k-100k, 21.1% for AGIs $100k-200k, 16.3% for AGIs over 200k)
Charity contributions: $5,711 (reported on 50.1% of returns)
Here:
$5,711
State:
$4,659
(% of AGI for various income ranges: 0.8% for AGIs below $25k, 1.3% for AGIs $25k-50k, 2.2% for AGIs $50k-75k, 2.2% for AGIs $75k-100k, 2.6% for AGIs $100k-200k, 2.9% for AGIs over 200k)
Taxes paid: $15,844 (reported on 57.1% of returns)
93314:
$15,844
State:
$14,448
(% of AGI for various income ranges: 2.8% for AGIs below $25k, 4.2% for AGIs $25k-50k, 5.8% for AGIs $50k-75k, 6.5% for AGIs $75k-100k, 7.9% for AGIs $100k-200k, 9.7% for AGIs over 200k)
Earned income credit: $2,070 (reported on 9.5% of returns)
Here:
$2,070
State:
$2,286
(% of AGI for various income ranges: 4.4% for AGIs below $25k, 1.2% for AGIs $25k-50k)
Percentage of individuals using paid preparers for their 2012 taxes: 69.3%
Here:
69%
State:
64%
(% for various income ranges: 58.5% for AGIs below $25k, 64.4% for AGIs $25k-50k, 71.6% for AGIs $50k-75k, 72.4% for AGIs $75k-100k, 75.9% for AGIs $100k-200k, 83.0% for AGIs over 200k)
Averages for the 2004 tax year for zip code 93314, filed in 2005:
Average Adjusted Gross Income (AGI) in 2004: $69,322 (Individual Income Tax Returns)
Here:
$69,322
State:
$58,600
Salary/wage: $62,235 (reported on 86.9% of returns)
Here:
$62,235
State:
$49,455
(% of AGI for various income ranges: 74.8% for AGIs $10k-25k, 76.5% for AGIs $25k-50k, 82.8% for AGIs $50k-75k, 86.2% for AGIs $75k-100k, 70.7% for AGIs over 100k)
Taxable interest for individuals: $1,646 (reported on 62.5% of returns)
This zip code:
$1,646
California:
$2,365
(% of AGI for various income ranges: 1.8% for AGIs $10k-25k, 1.3% for AGIs $25k-50k, 0.9% for AGIs $50k-75k, 0.8% for AGIs $75k-100k, 1.6% for AGIs over 100k)
Taxable dividends: $1,810 (reported on 23.7% of returns)
Here:
$1,810
State:
$4,746
(% of AGI for various income ranges: 1.4% for AGIs $10k-25k, 0.8% for AGIs $25k-50k, 0.5% for AGIs $50k-75k, 0.4% for AGIs $75k-100k, 0.6% for AGIs over 100k)
Net capital gain/loss: +$15,561 (reported on 21.6% of returns)
Here:
+$15,561
State:
+$23,418
(% of AGI for various income ranges: 0.6% for AGIs $10k-25k, 0.7% for AGIs $25k-50k, 0.5% for AGIs $50k-75k, 0.7% for AGIs $75k-100k, 7.5% for AGIs over 100k)
Profit/loss from business: +$19,192 (reported on 21.0% of returns)
Here:
+$19,192
State:
+$16,826
(% of AGI for various income ranges: 9.7% for AGIs $10k-25k, 10.1% for AGIs $25k-50k, 6.5% for AGIs $50k-75k, 3.0% for AGIs $75k-100k, 5.4% for AGIs over 100k)
IRA payment deduction: $3,693 (reported on 3.5% of returns)
93314:
$3,693
California:
$3,192
(% of AGI for various income ranges: 0.3% for AGIs $10k-25k, 0.4% for AGIs $25k-50k, 0.3% for AGIs $50k-75k, 0.2% for AGIs $75k-100k, 0.1% for AGIs over 100k)
Self-employed pension: $16,327 (reported on 1.6% of returns)
Here:
$16,327
California:
$17,688
(% of AGI for various income ranges: 0.4% for AGIs $50k-75k, 0.2% for AGIs $75k-100k, 0.5% for AGIs over 100k)
Total itemized deductions: $26,496 (25% of AGI, reported on 59.0% of returns)
Here:
$26,496
State:
$28,113
Here:
25.0% of AGI
State:
25.3% of AGI
(% of AGI for various income ranges: 16.9% for AGIs $10k-25k, 23.2% for AGIs $25k-50k, 27.3% for AGIs $50k-75k, 25.4% for AGIs $75k-100k, 20.0% for AGIs over 100k)
Charity contributions deductions: $3,894 (4% of AGI, reported on 55.2% of returns)
Here:
$3,894
State:
$3,923
Here:
3.6% of AGI
State:
3.3% of AGI
(% of AGI for various income ranges: 1.7% for AGIs $10k-25k, 2.4% for AGIs $25k-50k, 3.1% for AGIs $50k-75k, 3.2% for AGIs $75k-100k, 3.1% for AGIs over 100k)
Total tax: $11,106 (reported on 81.3% of returns)
93314:
$11,106
State:
$10,761
(% of AGI for various income ranges: 5.0% for AGIs $10k-25k, 6.6% for AGIs $25k-50k, 7.3% for AGIs $50k-75k, 8.5% for AGIs $75k-100k, 16.6% for AGIs over 100k)
Earned income credit: $1,654 (reported on 8.6% of returns)
Here:
$1,654
State:
$1,763
Percentage of individuals using paid preparers for their 2004 taxes: 70.6%
Here:
71%
State:
66%
(% for various income ranges: 56.6% for AGIs below $10k, 61.5% for AGIs $10k-25k, 74.0% for AGIs $25k-50k, 77.0% for AGIs $50k-75k, 75.0% for AGIs $75k-100k, 78.4% for AGIs over 100k)
Likely homosexual households (counted as self-reported same-sex unmarried-partner households)
Lesbian couples: 0.2% of all households
Gay men: 0.0% of all households
Household received Food Stamps/SNAP in the past 12 months: 447 Household did not receive Food Stamps/SNAP in the past 12 months: 10,342
Women who had a birth in the past 12 months: 393 (364 now married, 27 unmarried) Women who did not have a birth in the past 12 months: 7,770 (4,080 now married, 3,647 unmarried)
Housing units in zip code 93314 with a mortgage: 7,009 (249 second mortgage, 30 home equity loan, 180 both second mortgage and home equity loan) Median monthly owner costs for units with a mortgage: $2,510 Median monthly owner costs for units without a mortgage: $879
Residents with income below the poverty level in 2022:
This zip code:
7.2%
Whole state:
12.2%
Residents with income below 50% of the poverty level in 2022:
This zip code:
4.5%
Whole state:
6.2%
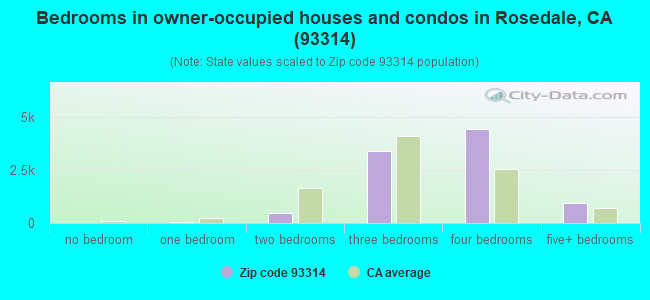
Median number of rooms in houses and condos:
Here:
6.8
State:
6.0
Median number of rooms in apartments:
Here:
5.4
State:
3.9
Notable locations in this zip code not listed on our city pages
Notable locations in zip code 93314: AJB Ranch Dairy (A), Buena Vista Ranch (B), Rio Bravo Pumping Station (C), Kern County Fire Department Station 67 Rosedale (D), Bureau of Land Management - Midway Fire Station (E). Display/hide their locations on the map
6,531 married couples with children.
1,407 single-parent households (413 men, 994 women).
82.3% of residents of 93314 zip code speak English at home.
11.7% of residents speak Spanish at home (79% very well, 11% well, 5% not well, 5% not at all).
1.0% of residents speak other Indo-European language at home (85% very well, 13% well, 2% not well).
4.0% of residents speak Asian or Pacific Island language at home (74% very well, 17% well, 8% not well, 1% not at all).
0.4% of residents speak other language at home (74% very well, 16% well, 10% not well).
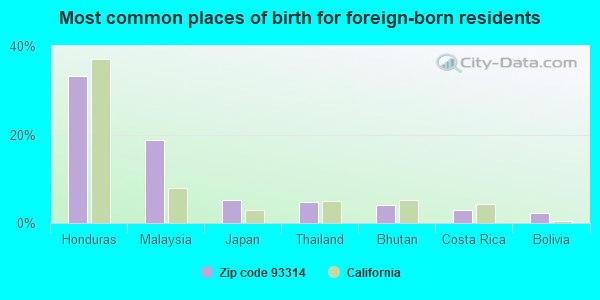
Foreign born population: 3,080 (9.1%) (64.8% of them are naturalized citizens)
This zip code:
9.1%
Whole state:
26.7%
33%Honduras
19%Malaysia
5%Japan
5%Thailand
4%Bhutan
3%Costa Rica
2%Bolivia
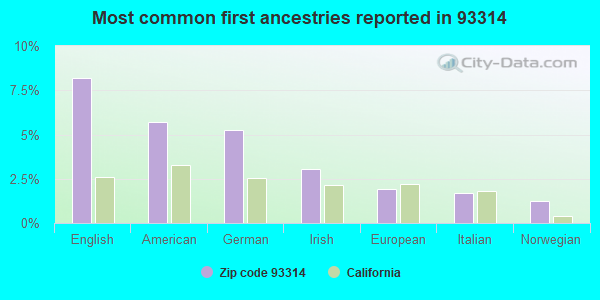
8%English
6%American
5%German
3%Irish
2%European
2%Italian
1%Norwegian
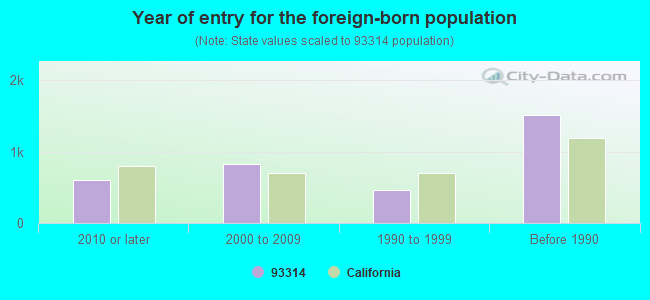
Year of entry for the foreign-born population
5972010 or later
8232000 to 2009
4591990 to 1999
1,513Before 1990
Facilities with environmental interests located in this zip code:
CARPENTER TRANSPORTATION (14400 KATHLEEN AVE in BAKERSFIELD, CA)
CASTRO AND SINGLETON TRUCKING (410 VIA SOL in BAKERSFIELD, CA)
TRANSPORTER (Resource Conservation and Recovery Act (tracking hazardous waste)) Organizations: RONALD T SINGLETON (CONTACT/OPERATOR)
Housing units lacking complete plumbing facilities: 0.6% Housing units lacking complete kitchen facilities: 0.7%
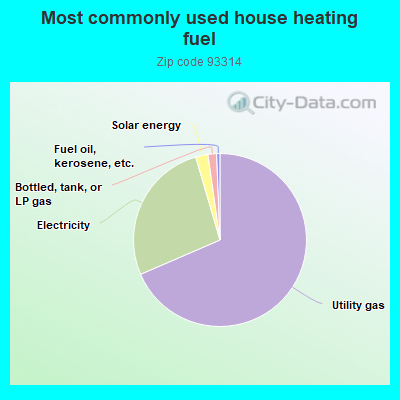
68.1%Utility gas
26.8%Electricity
2.3%Solar energy
1.6%Bottled, tank, or LP gas
0.6%Fuel oil, kerosene, etc.
Place of birth for U.S.-born residents:
This state: 26,027
Northeast: 687
Midwest: 1,112
South: 1,647
West: 963
93% of the 93314 zip code residents lived in the same house 1 year ago. Out of people who lived in different houses, 76% moved from this county. Out of people who lived in different houses, 14% moved from different county within same state. Out of people who lived in different houses, 4% moved from different state. Out of people who lived in different houses, 7% moved from abroad.
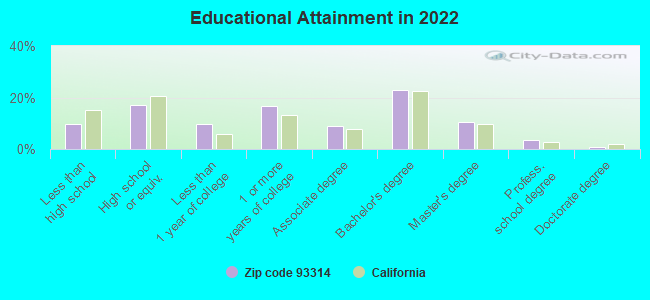
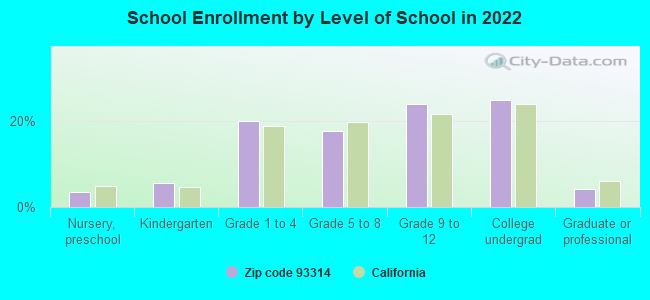
Private vs. public school enrollment:
Students in private schools in grades 1 to 8 (elementary and middle school): 610
Here:
16.5%
California:
10.5%
Students in private schools in grades 9 to 12 (high school): 140
Here:
6.0%
California:
8.5%
Students in private undergraduate colleges: 253
Here:
10.4%
California:
15.9%
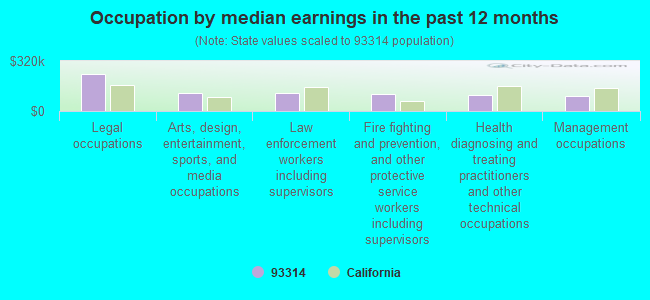
Occupation by median earnings in the past 12 months ($)
233,679Legal occupations
117,709Arts, design, entertainment, sports, and media occupations
114,072Law enforcement workers including supervisors
107,837Fire fighting and prevention, and other protective service workers including supervisors
101,540Health diagnosing and treating practitioners and other technical occupations
98,551Management occupations
Companies with federal contracts located in this zip code:
RON'S MOBILE HOME SERVICE (17955 ROSEDALE HWY in BAKERSFIELD, CA; small business)
$12,000 with Air Force for Other Vehicle Charter for Transportation of Things. Signed on 2006-05-02. Completion date: 2006-05-09.
Top industries in this zip code by the number of employees in 2005:
Administrative and Support and Waste Management and Remediation Services: Landscaping Services (100-249 employees: 1 establishment, 5-9 employees: 1 establishment, 1-4 employees: 5 establishments)
Other Services (except Public Administration): Commercial and Industrial Machinery and Equipment (except Automotive and Electronic) Repair and Maintenance (50-99: 1, 5-9: 1, 1-4: 1)
Accommodation and Food Services: Limited-Service Restaurants (20-49: 2, 5-9: 1)
Construction: Framing Contractors (50-99: 1)
Construction: New Single-Family Housing Construction (except Operative Builders) (20-49: 1, 10-19: 1, 5-9: 1, 1-4: 2)
Construction: Commercial and Institutional Building Construction (20-49: 1, 10-19: 1, 5-9: 1)
Construction: Masonry Contractors (10-19: 3)
Construction: Site Preparation Contractors (20-49: 1, 1-4: 2)
Fatal accident statistics in 2013:
Fatal accident count: 3
Vehicles involved in fatal accidents: 7
Fatal accidents caused by drunken drivers: 0
Fatalities: 3
Persons involved in fatal accidents: 9
Pedestrians involved in fatal accidents: 0
Fatal accident statistics in 2012:
Fatal accident count: 4
Vehicles involved in fatal accidents: 7
Fatal accidents caused by drunken drivers: 2
Fatalities: 4
Persons involved in fatal accidents: 9
Pedestrians involved in fatal accidents: 0
2005 - 2018 National Fire Incident Reporting System (NFIRS) incidents
Based on the data from the years 2005 - 2018 the average number of fires per year is 45. The highest number of fires - 91 took place in 2017, and the least - 0 in 2010. The data has an increasing trend.
When looking into fire subcategories, the most incidents belonged to: Outside Fires (48.9%), and Structure Fires (27.5%).
Fire incident types reported to NFIRS in Zip Code 93314


 Based on the data from the years 2005 - 2018 the average number of fires per year is 45. The highest number of fires - 91 took place in 2017, and the least - 0 in 2010. The data has an increasing trend.
 When looking into fire subcategories, the most incidents belonged to: Outside Fires (48.9%), and Structure Fires (27.5%).