West Hollywood West neighborhood in Los Angeles, California (CA), 90048 detailed profile
Settings
X

Business Search - 14 Million verified businesses
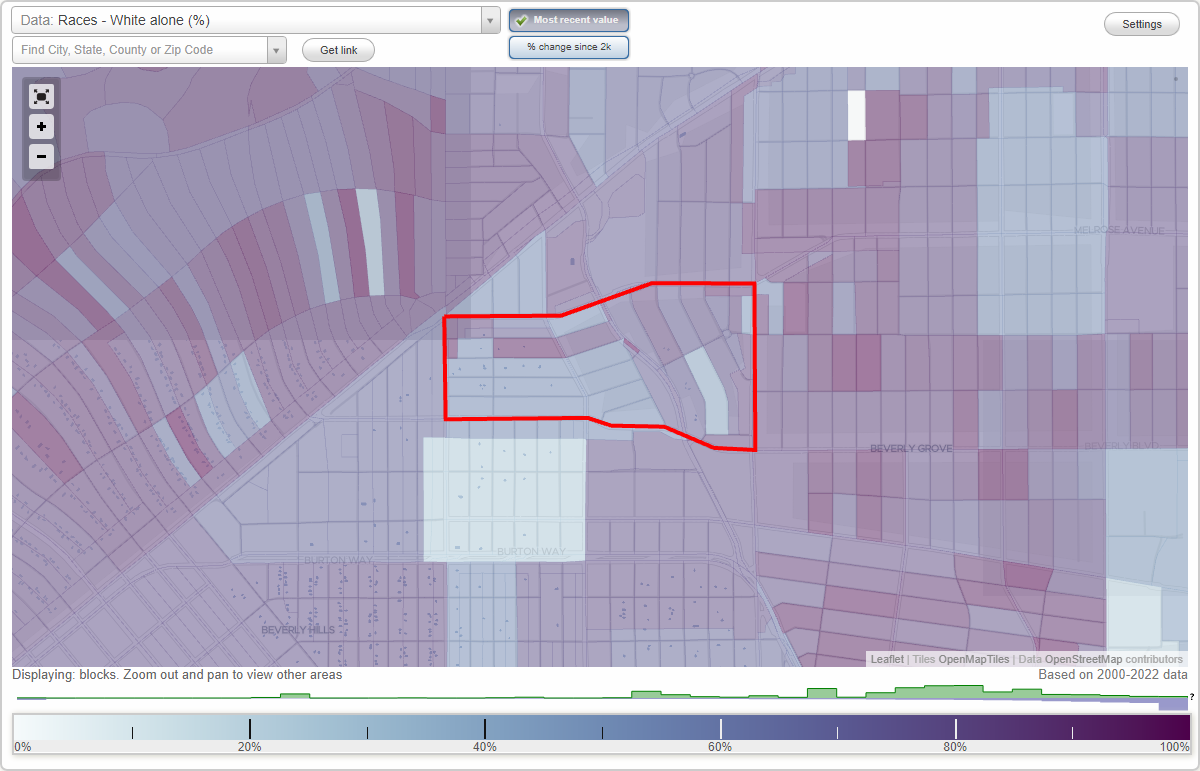
Area: 0.237 square miles
Population: 1,397
Population density:
| West Hollywood West: | 5,895 people per square mile |
| Los Angeles: | 8,148 people per square mile |

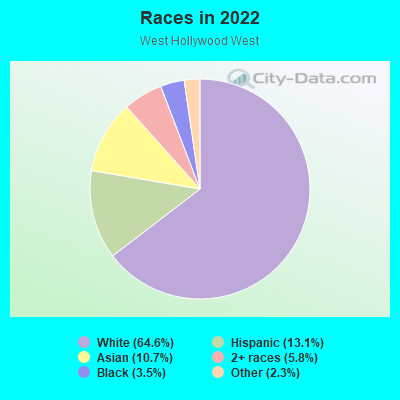
- 97964.6%White
- 19913.1%Hispanic or Latino
- 16210.7%Asian
- 885.8%Two or more races
- 533.5%Black
- 352.3%Some other race
Distribution of median household income
![Distribution of median household income]()
- 56Less than $10,000
- 84$10,000 to $19,999
- 71$20,000 to $29,999
- 130$30,000 to $39,999
- 195$40,000 to $49,999
- 109$50,000 to $59,999
- 73$60,000 to $74,999
- 174$75,000 to $99,999
- 109$100,000 to $124,999
- 223$125,000 to $149,999
- 70$150,000 to $199,999
- 267$200,000 or more

Distribution of owner-occupied house/condo value
![Distribution of owner-occupied house/condo value]()
- 19Less than $50,000
- 32$400,000 to $499,999
- 86$500,000 to $749,999
- 71$750,000 to $999,999
- 352$1,000,000 or more

Distribution of rent paid by renters
![Distribution of rent paid by renters]()
- 20$100 to $199
- 49$200 to $299
- 40$300 to $399
- 245$600 to $699
- 33$700 to $799
- 20$800 to $899
- 24$900 to $999
- 118$1,000 to $1,249
- 799$1,250 to $1,499
- 137$1,500 to $1,999
- 437$2,000 or more

Median rent in 2022:
| West Hollywood West: | $2,360 |
| Los Angeles: | $1,648 |
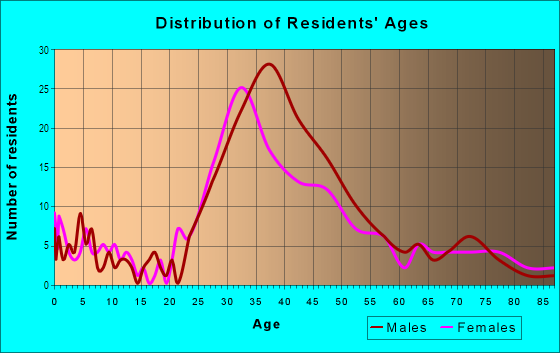
| Males: | 690 |
| Females: | 706 |
Males:
| This neighborhood: | 49.5 years |
| Whole city: | 36.5 years |
| This neighborhood: | 43.6 years |
| Whole city: | 37.9 years |
Average household size:
| West Hollywood West: | 1.6 people |
| Los Angeles: | 2.6 people |
Percentage of family households:
| West Hollywood West: | 28.6% |
| Los Angeles: | 40.1% |
| Here: | 23.8% |
| Los Angeles: | 36.7% |
Percentage of married-couple families with children (among all households):
| West Hollywood West: | 63.6% |
| Los Angeles: | 24.3% |
Percentage of single-mother households (among all households):
| West Hollywood West: | 75.5% |
| Los Angeles: | 9.9% |
Percentage of never married males 15 years old and over:
Percentage of never married females 15 years old and over:
| West Hollywood West: | 24.3% |
| Los Angeles: | 24.7% |
Percentage of never married females 15 years old and over:
| West Hollywood West: | 27.0% |
| city: | 22.0% |
Percentage of people that speak English not well or not at all:
| West Hollywood West: | 0.9% |
| Los Angeles: | 13.8% |
Percentage of people born in this state:
Percentage of people born in another U.S. state:
Percentage of native residents but born outside the U.S.:
Percentage of foreign born residents:
| Here: | 26.9% |
| Los Angeles: | 46.9% |
Percentage of people born in another U.S. state:
| West Hollywood West: | 43.0% |
| Los Angeles: | 15.7% |
Percentage of native residents but born outside the U.S.:
| Here: | 0.7% |
| city: | 1.6% |
Percentage of foreign born residents:
| Here: | 29.4% |
| Los Angeles: | 35.7% |
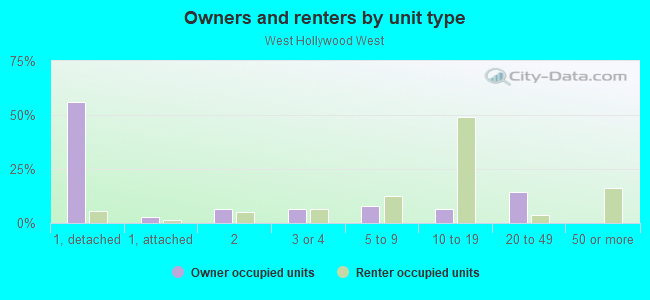
Owner-occupied
Renter-occupied

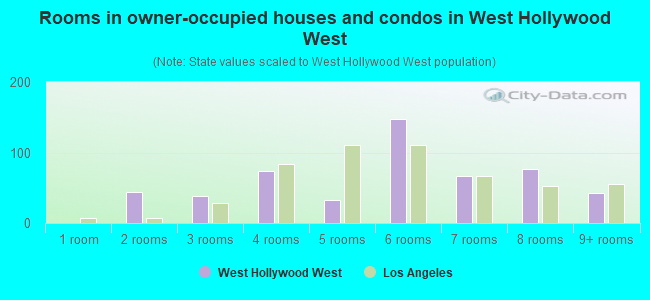
- Rooms in owner-occupied houses and condos in West Hollywood West
- 01 room
- 442 rooms
- 393 rooms
- 744 rooms
- 325 rooms
- 1476 rooms
- 677 rooms
- 778 rooms
- 429+ rooms
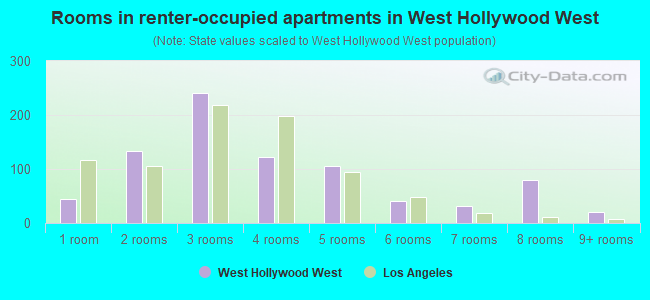
- Rooms in renter-occupied apartments in West Hollywood West
- 441 room
- 1332 rooms
- 2413 rooms
- 1234 rooms
- 1065 rooms
- 416 rooms
- 327 rooms
- 808 rooms
- 209+ rooms
Owner-occupied
Renter-occupied
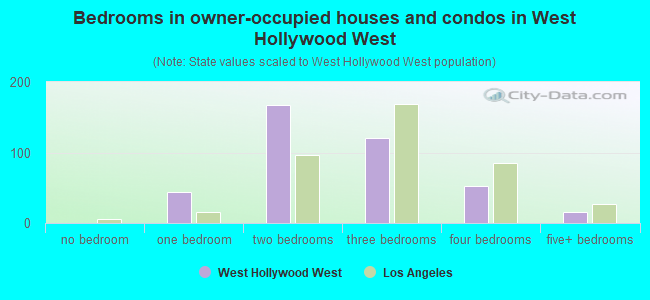
- Bedrooms in owner-occupied houses and condos in West Hollywood West
- 0no bedroom
- 441 bedroom
- 1672 bedrooms
- 1203 bedrooms
- 524 bedrooms
- 155+ bedrooms
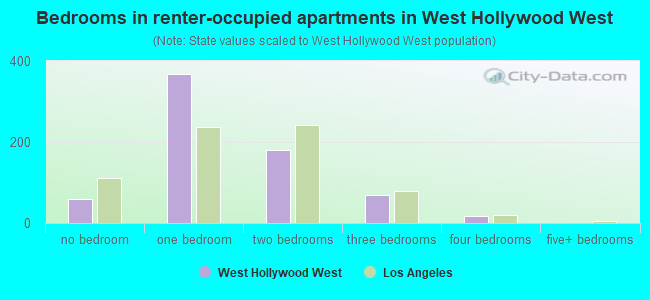
- Bedrooms in renter-occupied apartments in West Hollywood West
- 59no bedroom
- 3671 bedroom
- 1802 bedrooms
- 703 bedrooms
- 184 bedrooms
- 05+ bedrooms
Average number of cars or other vehicles available in houses/condos:
Average number of cars or other vehicles available in apartments:
| This neighborhood: | 1.8 |
| Los Angeles: | 2.1 |
Average number of cars or other vehicles available in apartments:
| Here: | 0.7 |
| city: | 1.3 |
Percentage of units with a mortgage:
| West Hollywood West: | 67.9% |
| Los Angeles: | 68.9% |
Average estimated value of detached houses in 2022 (54.7% of all units):
| West Hollywood West: | $3,638,718 |
| Los Angeles: | $1,324,769 |
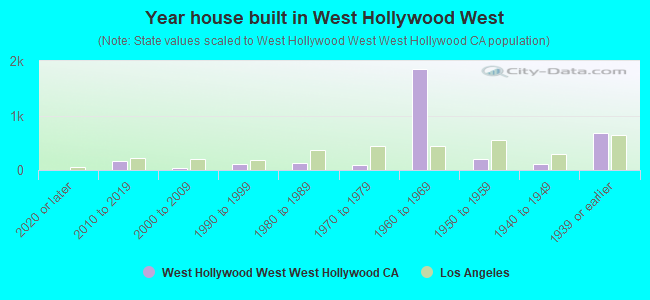
- Year house built in West Hollywood West
- 62020 or later
- 1612010 to 2019
- 362000 to 2009
- 1181990 to 1999
- 1341980 to 1989
- 831970 to 1979
- 1,8541960 to 1969
- 1971950 to 1959
- 1031940 to 1949
- 6821939 or earlier
City-data.com crime index for city in 2020 (higher means more crime):
| City: | 327.4 |
| U.S. average: | 219.5 |
Travel time to work (commute)
![Travel time to work (commute)]()
- 8Less than 5 minutes
- 585 to 9 minutes
- 7110 to 14 minutes
- 16115 to 19 minutes
- 14420 to 24 minutes
- 4125 to 29 minutes
- 13730 to 34 minutes
- 3135 to 39 minutes
- 2740 to 44 minutes
- 5645 to 59 minutes
- 4260 to 89 minutes
- 1190 or more minutes

Means of transportation to work
![Means of transportation to work]()
- 56.2%535Drove a car alone
- 4.0%38Carpooled
- 14.5%138Bus
- 4.6%44Bicycle
- 5.1%49Walked
- 13.8%131Other means
- 25.6%244Worked at home

Time leaving home to go to work
![Time leaving home to go to work]()
- 3012:00 a.m. to 4:59 a.m.
- 95:00 a.m. to 5:29 a.m.
- 75:30 a.m. to 5:59 a.m.
- 206:00 a.m. to 6:29 a.m.
- 246:30 a.m. to 6:59 a.m.
- 517:00 a.m. to 7:29 a.m.
- 767:30 a.m. to 7:59 a.m.
- 1728:00 a.m. to 8:29 a.m.
- 968:30 a.m. to 8:59 a.m.
- 1959:00 a.m. to 9:59 a.m.
- 5710:00 a.m. to 10:59 a.m.
- 4712:00 p.m. to 3:59 p.m.
- 224:00 p.m. to 11:59 p.m.

Occupations of males:
- Percentage of males in management occupations (except farmers):
Here: 31.4% city: 10.6%
- Percentage of males in business and financial operations occupations:
Here: 5.3% city: 5.0%
- Percentage of males in architecture and engineering occupations:
Here: 1.0% city: 2.2%
- Percentage of males in life, physical, and social science occupations:
Here: 8.2% city: 0.7%
- Percentage of males in legal occupations:
Here: 12.6% city: 1.8%
- Percentage of males in education, training, and library occupations:
Here: 3.1% city: 3.2%
- Percentage of males in arts, design, entertainment, sports, and media occupations:
Here: 7.8% city: 8.0%
- Percentage of males in service occupations:
Here: 16.0% city: 16.2%
- Percentage of males in sales and office occupations:
Here: 10.3% city: 15.1%
Occupations of females:
- Percentage of females in management occupations (except farmers):
Here: 32.7% city: 10.5%
- Percentage of females in business and financial operations occupations:
Here: 10.5% city: 6.5%
- Percentage of females in life, physical, and social science occupations:
Here: 9.4% city: 1.2%
- Percentage of females in legal occupations:
Here: 2.5% city: 2.1%
- Percentage of females in education, training, and library occupations:
Here: 1.0% city: 7.1%
- Percentage of females in arts, design, entertainment, sports, and media occupations:
Here: 19.6% city: 6.3%
- Percentage of females in healthcare practitioners and technical occupations:
Here: 6.8% city: 6.5%
- Percentage of females in service occupations:
Here: 5.9% city: 23.6%
- Percentage of females in sales and office occupations:
Here: 11.2% city: 24.7%
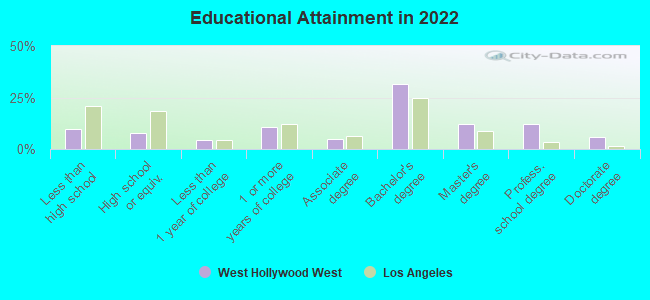
Education in this neighborhood (subdivision or community):
- Percentage of people 3 years and older in K-12 schools:
West Hollywood West: 10.6% Los Angeles: 14.4%
- Percentage of people 3 years and older in undergraduate colleges:
West Hollywood West: 33.5% Los Angeles: 6.0%
- Percentage of people 3 years and older in grad. or professional schools:
West Hollywood West: 6.1% Los Angeles: 2.1%
- Percentage of students K-12 enrolled in private schools:
West Hollywood West: 45.1% Los Angeles: 12.1%
Percentage of population below poverty level:
| West Hollywood West: | 12.1% |
| Los Angeles: | 16.8% |
Median year renter moved in (as recorded in 2022):
| West Hollywood West: | 2013 |
| Los Angeles: | 2018 |
Percentage of married-couple families with both working:
| West Hollywood West: | 99.8% |
| Los Angeles: | 63.8% |
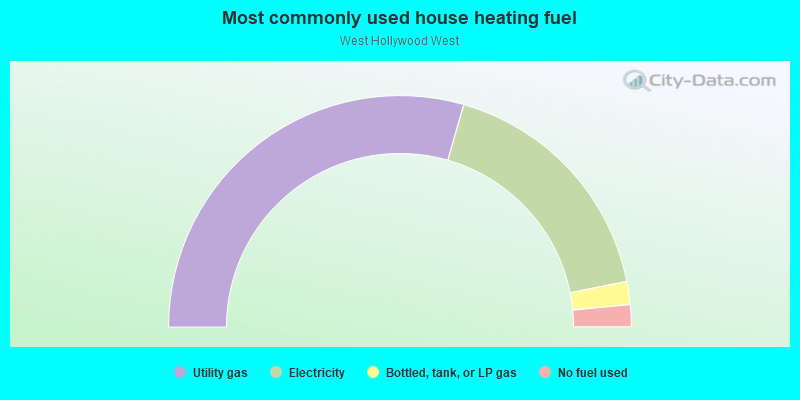
- 58.9%Utility gas
- 34.8%Electricity
- 3.2%Bottled, tank, or LP gas
- 3.1%No fuel used
Roads and streets:
Rosewood Ave
Length: 0.73 miles
Directions: E-W, N-S, SW-NE
Address range: 8500 to 8999
Directions: E-W, N-S, SW-NE
Address range: 8500 to 8999
Dorrington Ave
Length: 0.50 miles
Directions: E-W, SW-NE
Address range: 8700 to 9075
Directions: E-W, SW-NE
Address range: 8700 to 9075
Rangely Ave
Length: 0.49 miles
Direction: E-W
Address range: 8700 to 9099
Direction: E-W
Address range: 8700 to 9099
Ashcroft Ave
Length: 0.45 miles
Directions: E-W, SW-NE
Address range: 8600 to 8999
Directions: E-W, SW-NE
Address range: 8600 to 8999
N San Vicente Blvd
Length: 0.37 miles
Directions: N-S, SE-NW
Address range: 300 to 551
Directions: N-S, SE-NW
Address range: 300 to 551
N la Cienega Blvd
Length: 0.34 miles
Direction: N-S
Address range: 310 to 575
Direction: N-S
Address range: 310 to 575
N Robertson Blvd
Length: 0.28 miles
Directions: N-S, SE-NW
Address range: 300 to 599
Directions: N-S, SE-NW
Address range: 300 to 599
Westmount Dr
Length: 0.25 miles
Directions: E-W, N-S, SE-NW
Address range: 400 to 577
Directions: E-W, N-S, SE-NW
Address range: 400 to 577
Beverly Blvd
Length: 0.25 miles
Direction: E-W
Address range: 8900 to 9032
Direction: E-W
Address range: 8900 to 9032
Westbourne Dr
Length: 0.24 miles
Directions: N-S, SE-NW
Address range: 300 to 499
Directions: N-S, SE-NW
Address range: 300 to 499
N Almont Dr
Length: 0.22 miles
Direction: N-S
Address range: 300 to 547
Direction: N-S
Address range: 300 to 547
Huntley Dr
Length: 0.21 miles
Directions: N-S, SE-NW
Address range: 300 to 399
Directions: N-S, SE-NW
Address range: 300 to 399
Beverly Pl
Length: 0.16 miles
Directions: E-W, SW-NE
Address range: 8500 to 8611
Directions: E-W, SW-NE
Address range: 8500 to 8611
W Knoll Dr
Length: 0.12 miles
Directions: E-W, N-S, SE-NW
Address range: 500 to 599
Directions: E-W, N-S, SE-NW
Address range: 500 to 599
N Sherbourne Dr
Length: 0.08 miles
Direction: SE-NW
Address range: 401 to 499
Direction: SE-NW
Address range: 401 to 499
N Sherbourne Dr (Park Ave)
Length: 0.05 miles
Direction: SE-NW
Address range: 344 to 406
Direction: SE-NW
Address range: 344 to 406
Melrose Ave
Length: 0.03 miles
Direction: E-W
Address range: 8780 to 8799
Direction: E-W
Address range: 8780 to 8799