West Hollywood North neighborhood in West Hollywood, California (CA), 90069 detailed profile
Settings
X


Business Search - 14 Million verified businesses
Area: 0.086 square miles
Population: 2,940
Population density:
| West Hollywood North: | 34,282 people per square mile |
| West Hollywood: | 18,802 people per square mile |

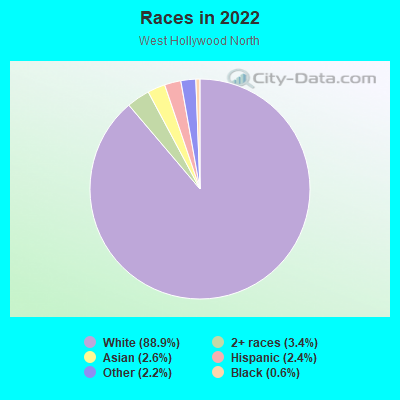
- 2,67488.9%White
- 1013.4%Two or more races
- 792.6%Asian
- 712.4%Hispanic or Latino
- 652.2%Some other race
- 190.6%Black
Distribution of median household income
![Distribution of median household income]()
- 89Less than $10,000
- 1,093$10,000 to $19,999
- 898$20,000 to $29,999
- 49$30,000 to $39,999
- 40$40,000 to $49,999
- 41$50,000 to $59,999
- 47$60,000 to $74,999
- 186$75,000 to $99,999
- 286$100,000 to $124,999
- 212$125,000 to $149,999
- 74$150,000 to $199,999
- 343$200,000 or more

Distribution of owner-occupied house/condo value
![Distribution of owner-occupied house/condo value]()
- 34Less than $50,000
- 10$300,000 to $399,999
- 60$400,000 to $499,999
- 388$500,000 to $749,999
- 242$750,000 to $999,999
- 620$1,000,000 or more

Distribution of rent paid by renters
![Distribution of rent paid by renters]()
- 8$100 to $199
- 165$200 to $299
- 171$300 to $399
- 61$400 to $499
- 81$600 to $699
- 11$700 to $799
- 8$800 to $899
- 9$900 to $999
- 122$1,000 to $1,249
- 25$1,250 to $1,499
- 283$1,500 to $1,999
- 451$2,000 or more

Median rent in 2022:
| West Hollywood North: | $1,853 |
| West Hollywood: | $1,894 |
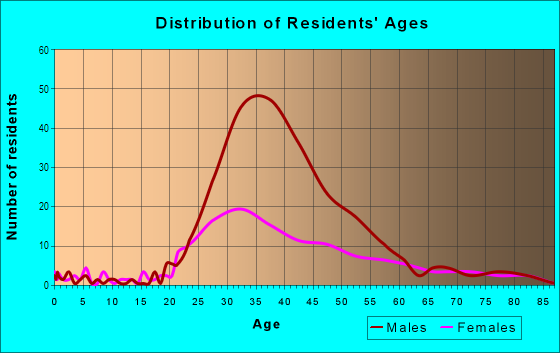
| Males: | 2,190 |
| Females: | 749 |
Males:
| This neighborhood: | 50.6 years |
| Whole city: | 43.5 years |
| This neighborhood: | 51.5 years |
| Whole city: | 36.4 years |
Average household size:
| West Hollywood North: | 1.5 people |
| West Hollywood: | 1.5 people |
Percentage of family households:
| West Hollywood North: | 8.9% |
| West Hollywood: | 14.5% |
| Here: | 13.0% |
| West Hollywood: | 15.1% |
Percentage of married-couple families with children (among all households):
| West Hollywood North: | 71.7% |
| West Hollywood: | 45.7% |
Percentage of single-mother households (among all households):
| West Hollywood North: | 38.0% |
| West Hollywood: | 16.3% |
Percentage of never married males 15 years old and over:
Percentage of never married females 15 years old and over:
| West Hollywood North: | 54.2% |
| West Hollywood: | 39.9% |
Percentage of never married females 15 years old and over:
| West Hollywood North: | 6.4% |
| city: | 23.7% |
Percentage of people that speak English not well or not at all:
| West Hollywood North: | 6.9% |
| West Hollywood: | 4.2% |
Percentage of people born in this state:
Percentage of people born in another U.S. state:
Percentage of native residents but born outside the U.S.:
Percentage of foreign born residents:
| Here: | 28.3% |
| West Hollywood: | 30.6% |
Percentage of people born in another U.S. state:
| West Hollywood North: | 47.6% |
| West Hollywood: | 44.7% |
Percentage of native residents but born outside the U.S.:
| Here: | 1.6% |
| city: | 0.9% |
Percentage of foreign born residents:
| Here: | 22.6% |
| West Hollywood: | 23.7% |
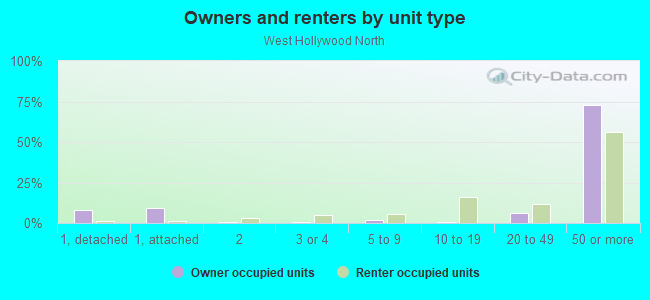
Owner-occupied
Renter-occupied

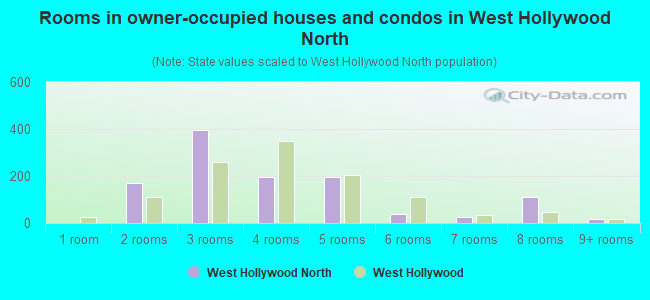
- Rooms in owner-occupied houses and condos in West Hollywood North
- 01 room
- 1692 rooms
- 3973 rooms
- 1974 rooms
- 1965 rooms
- 396 rooms
- 247 rooms
- 1128 rooms
- 199+ rooms
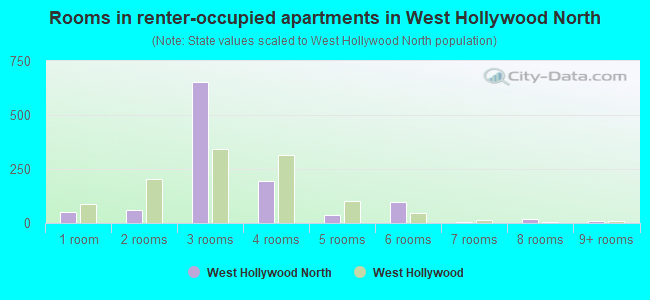
- Rooms in renter-occupied apartments in West Hollywood North
- 531 room
- 612 rooms
- 6553 rooms
- 1954 rooms
- 395 rooms
- 956 rooms
- 67 rooms
- 178 rooms
- 79+ rooms
Owner-occupied
Renter-occupied
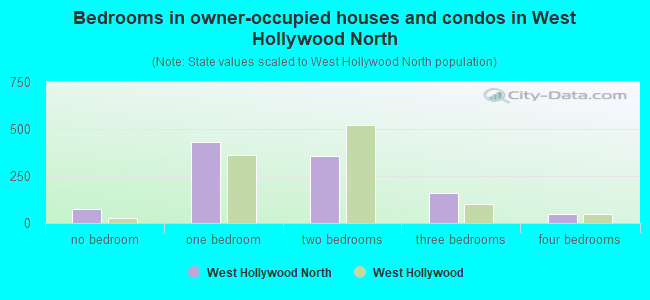
- Bedrooms in owner-occupied houses and condos in West Hollywood North
- 73no bedroom
- 4301 bedroom
- 3552 bedrooms
- 1583 bedrooms
- 484 bedrooms
- 05+ bedrooms
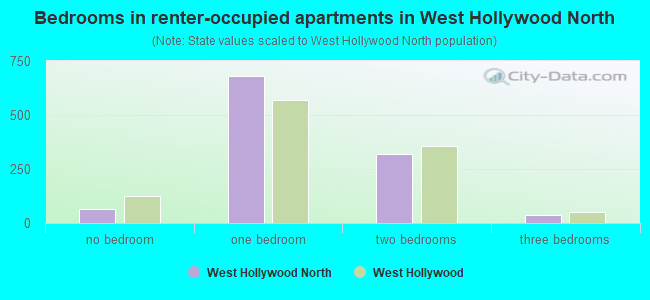
- Bedrooms in renter-occupied apartments in West Hollywood North
- 67no bedroom
- 6801 bedroom
- 3192 bedrooms
- 383 bedrooms
- 64 bedrooms
- 05+ bedrooms
Average number of cars or other vehicles available in houses/condos:
Average number of cars or other vehicles available in apartments:
| This neighborhood: | 1.1 |
| West Hollywood: | 1.4 |
Average number of cars or other vehicles available in apartments:
| Here: | 1.0 |
| city: | 1.1 |
Percentage of units with a mortgage:
| West Hollywood North: | 73.1% |
| West Hollywood: | 73.8% |
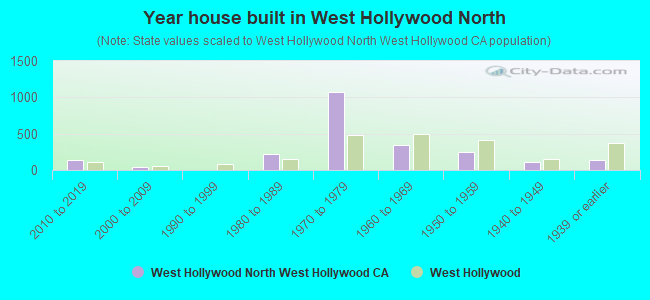
- Year house built in West Hollywood North
- 02020 or later
- 1322010 to 2019
- 402000 to 2009
- 61990 to 1999
- 2151980 to 1989
- 1,0771970 to 1979
- 3501960 to 1969
- 2451950 to 1959
- 1141940 to 1949
- 1411939 or earlier
City-data.com crime index for city in 2020 (higher means more crime):
| City: | 346.7 |
| U.S. average: | 219.5 |
Travel time to work (commute)
![Travel time to work (commute)]()
- 11Less than 5 minutes
- 535 to 9 minutes
- 7410 to 14 minutes
- 10315 to 19 minutes
- 12720 to 24 minutes
- 3725 to 29 minutes
- 13130 to 34 minutes
- 4735 to 39 minutes
- 4540 to 44 minutes
- 12445 to 59 minutes
- 2960 to 89 minutes
- 790 or more minutes

Means of transportation to work
![Means of transportation to work]()
- 40.8%702Drove a car alone
- 2.4%41Carpooled
- 3.2%55Bus
- 7.3%125Subway or elevated rail
- 0.7%12Taxi
- 0.3%6Motorcycle
- 0.4%7Bicycle
- 6.2%106Walked
- 2.4%42Other means
- 43.3%744Worked at home

Time leaving home to go to work
![Time leaving home to go to work]()
- 1912:00 a.m. to 4:59 a.m.
- 175:00 a.m. to 5:29 a.m.
- 85:30 a.m. to 5:59 a.m.
- 476:00 a.m. to 6:29 a.m.
- 226:30 a.m. to 6:59 a.m.
- 617:00 a.m. to 7:29 a.m.
- 617:30 a.m. to 7:59 a.m.
- 1358:00 a.m. to 8:29 a.m.
- 1218:30 a.m. to 8:59 a.m.
- 1549:00 a.m. to 9:59 a.m.
- 4110:00 a.m. to 10:59 a.m.
- 711:00 a.m. to 11:59 a.m.
- 3612:00 p.m. to 3:59 p.m.
- 294:00 p.m. to 11:59 p.m.

Occupations of males:
- Percentage of males in management occupations (except farmers):
Here: 15.9% city: 16.2%
- Percentage of males in business and financial operations occupations:
Here: 6.5% city: 6.9%
- Percentage of males in education, training, and library occupations:
Here: 6.8% city: 3.6%
- Percentage of males in arts, design, entertainment, sports, and media occupations:
Here: 23.8% city: 15.6%
- Percentage of males in healthcare practitioners and technical occupations:
Here: 2.0% city: 6.0%
- Percentage of males in service occupations:
Here: 1.7% city: 8.4%
- Percentage of males in sales and office occupations:
Here: 16.3% city: 21.6%
- Percentage of males in production occupations:
Here: 23.0% city: 2.3%
- Percentage of males in transportation occupations:
Here: 2.0% city: 2.8%
Occupations of females:
- Percentage of females in management occupations (except farmers):
Here: 18.5% city: 13.7%
- Percentage of females in business and financial operations occupations:
Here: 5.5% city: 11.6%
- Percentage of females in architecture and engineering occupations:
Here: 1.4% city: 0.2%
- Percentage of females in life, physical, and social science occupations:
Here: 4.2% city: 1.5%
- Percentage of females in legal occupations:
Here: 1.5% city: 4.0%
- Percentage of females in education, training, and library occupations:
Here: 4.5% city: 4.3%
- Percentage of females in arts, design, entertainment, sports, and media occupations:
Here: 10.7% city: 13.9%
- Percentage of females in healthcare practitioners and technical occupations:
Here: 21.0% city: 9.1%
- Percentage of females in service occupations:
Here: 8.2% city: 13.3%
- Percentage of females in sales and office occupations:
Here: 20.7% city: 21.1%
- Percentage of females in production occupations:
Here: 3.8% city: 1.9%
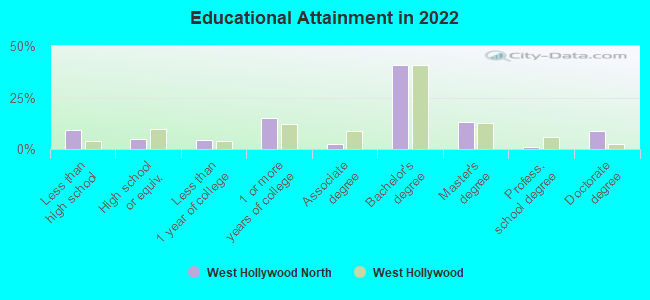
Education in this neighborhood (subdivision or community):
- Percentage of people 3 years and older in K-12 schools:
West Hollywood North: 2.6% West Hollywood: 1.9%
- Percentage of people 3 years and older in undergraduate colleges:
West Hollywood North: 8.2% West Hollywood: 4.1%
- Percentage of people 3 years and older in grad. or professional schools:
West Hollywood North: 7.8% West Hollywood: 1.8%
- Percentage of students K-12 enrolled in private schools:
West Hollywood North: 9.3% West Hollywood: 3.6%
Percentage of population below poverty level:
| West Hollywood North: | 9.7% |
| West Hollywood: | 12.7% |
Median year owner moved in (as recorded in 2022):
Median year renter moved in (as recorded in 2022):
| West Hollywood North: | 2008 |
| West Hollywood: | 2012 |
Median year renter moved in (as recorded in 2022):
| West Hollywood North: | 2013 |
| West Hollywood: | 2015 |
Percentage of married-couple families with both working:
| West Hollywood North: | 78.7% |
| West Hollywood: | 72.3% |
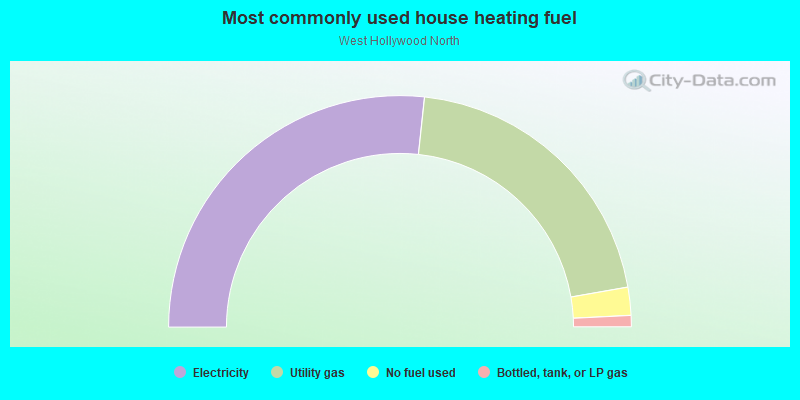
- 53.4%Electricity
- 41.1%Utility gas
- 3.9%No fuel used
- 1.6%Bottled, tank, or LP gas
Highways in this neighborhood:
Santa Monica Blvd (State Rte 2)
Length: 0.90 miles
Direction: SW-NE
Address range: 8548 to 8746
Direction: SW-NE
Address range: 8548 to 8746
Roads and streets:
Holloway Dr
Length: 0.36 miles
Direction: E-W
Address range: 8226 to 8729
Direction: E-W
Address range: 8226 to 8729
W Knoll Dr
Length: 0.29 miles
Directions: E-W, SE-NW, SW-NE
Address range: 8500 to 8799
Directions: E-W, SE-NW, SW-NE
Address range: 8500 to 8799
Hancock Ave
Length: 0.25 miles
Direction: N-S
Address range: 900 to 1099
Direction: N-S
Address range: 900 to 1099
Westmount Dr
Length: 0.16 miles
Directions: N-S, SE-NW
Address range: 900 to 1099
Directions: N-S, SE-NW
Address range: 900 to 1099
Westbourne Dr
Length: 0.12 miles
Directions: N-S, SE-NW
Address range: 900 to 999
Directions: N-S, SE-NW
Address range: 900 to 999
N la Cienega Blvd
Length: 0.08 miles
Direction: N-S
Address range: 1000 to 1099
Direction: N-S
Address range: 1000 to 1099