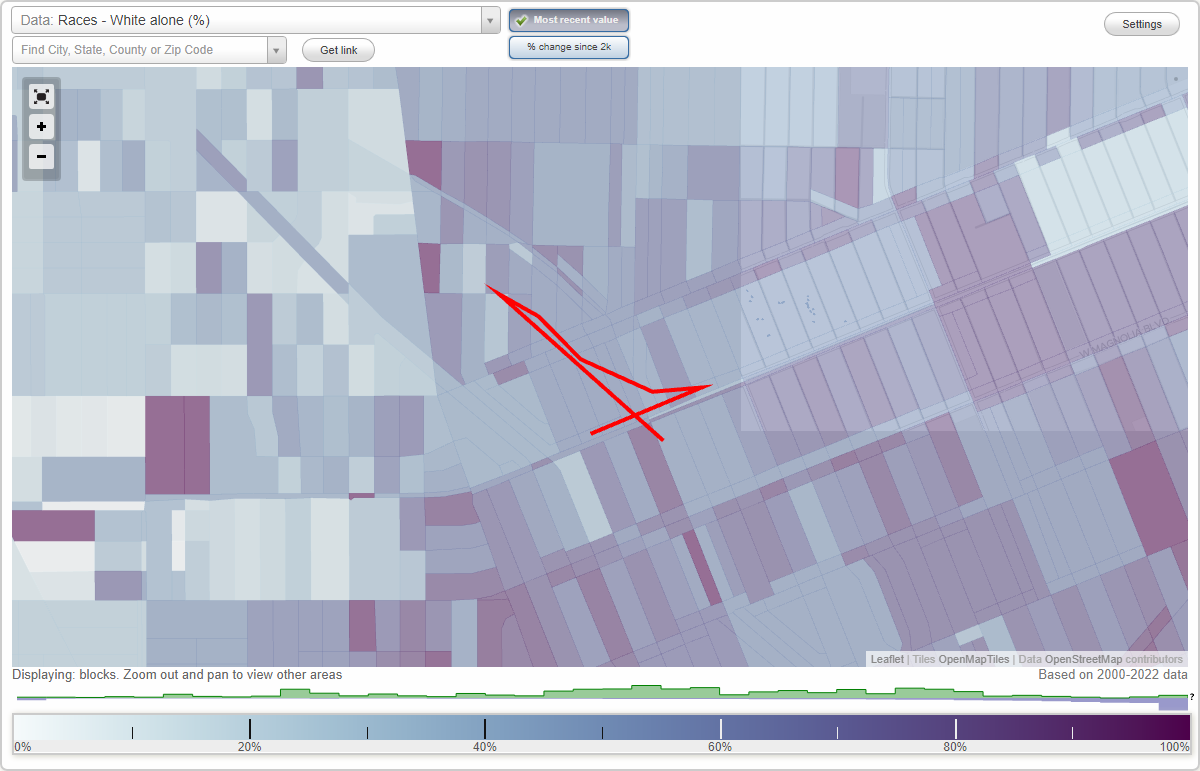
Magnolia Park neighborhood in Burbank, California (CA), 91505 detailed profile
Settings
X

Business Search - 14 Million verified businesses
Area: 0.161 square miles
Population: 1,436
Population density:
| Magnolia Park: | 8,906 people per square mile |
| Burbank: | 5,990 people per square mile |

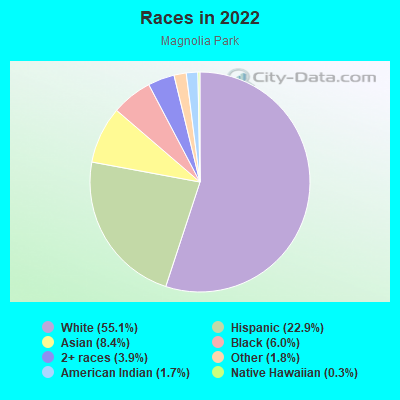
- 81555.1%White
- 33822.9%Hispanic or Latino
- 1248.4%Asian
- 886.0%Black
- 573.9%Two or more races
- 261.8%Some other race
- 251.7%American Indian
- 50.3%Native Hawaiian and Other
Pacific Islander
Median household income in 2022:
| Magnolia Park: | $114,772 |
| Burbank: | $92,581 |
Distribution of median household income
![Distribution of median household income]()
- 38Less than $10,000
- 39$10,000 to $19,999
- 46$20,000 to $29,999
- 22$30,000 to $39,999
- 50$40,000 to $49,999
- 14$50,000 to $59,999
- 70$60,000 to $74,999
- 62$75,000 to $99,999
- 72$100,000 to $124,999
- 77$125,000 to $149,999
- 98$150,000 to $199,999
- 106$200,000 or more

Distribution of owner-occupied house/condo value
![Distribution of owner-occupied house/condo value]()
- 32$50,000 to $99,999
- 17$100,000 to $149,999
- 12$300,000 to $399,999
- 19$400,000 to $499,999
- 26$500,000 to $749,999
- 144$750,000 to $999,999
- 137$1,000,000 or more

Distribution of rent paid by renters
![Distribution of rent paid by renters]()
- 5Less than $100
- 18$800 to $899
- 35$900 to $999
- 66$1,000 to $1,249
- 62$1,250 to $1,499
- 115$1,500 to $1,999
- 146$2,000 or more

Median rent in 2022:
| Magnolia Park: | $1,867 |
| Burbank: | $1,871 |
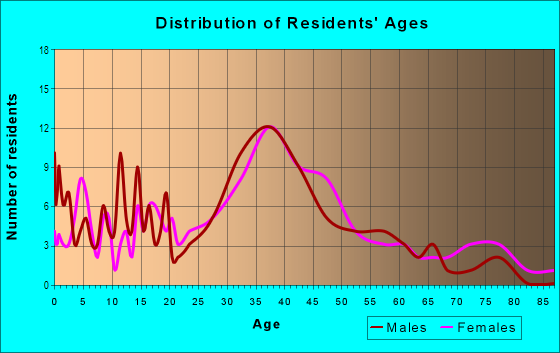
| Males: | 706 |
| Females: | 729 |
Males:
| This neighborhood: | 37.6 years |
| Whole city: | 36.7 years |
| This neighborhood: | 41.8 years |
| Whole city: | 42.1 years |
Average household size:
| Magnolia Park: | 2.4 people |
| Burbank: | 2.4 people |
Percentage of family households:
| Magnolia Park: | 42.3% |
| Burbank: | 43.5% |
| Here: | 41.9% |
| Burbank: | 40.3% |
Percentage of married-couple families with children (among all households):
| Magnolia Park: | 39.1% |
| Burbank: | 32.8% |
Percentage of single-mother households (among all households):
| Magnolia Park: | 3.3% |
| Burbank: | 7.0% |
Percentage of never married males 15 years old and over:
Percentage of never married females 15 years old and over:
| Magnolia Park: | 20.8% |
| Burbank: | 20.3% |
Percentage of never married females 15 years old and over:
| Magnolia Park: | 21.3% |
| city: | 18.6% |
Percentage of people that speak English not well or not at all:
| Magnolia Park: | 2.7% |
| Burbank: | 5.9% |
Percentage of people born in this state:
Percentage of people born in another U.S. state:
Percentage of native residents but born outside the U.S.:
Percentage of foreign born residents:
| Here: | 57.6% |
| Burbank: | 50.1% |
Percentage of people born in another U.S. state:
| Magnolia Park: | 25.1% |
| Burbank: | 21.2% |
Percentage of native residents but born outside the U.S.:
| Here: | 1.8% |
| city: | 1.2% |
Percentage of foreign born residents:
| Here: | 15.5% |
| Burbank: | 27.4% |
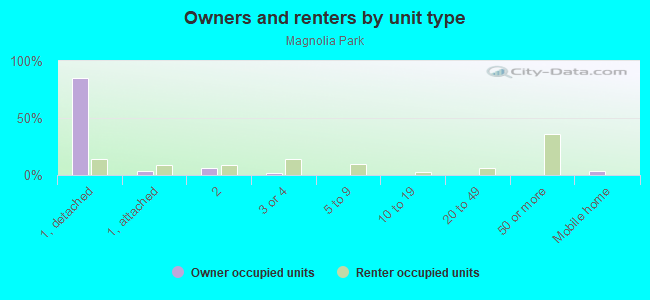
Owner-occupied
Renter-occupied

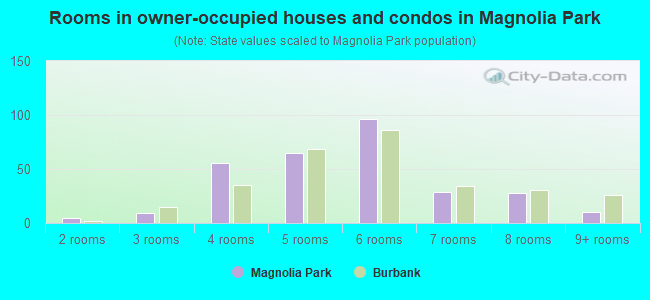
- Rooms in owner-occupied houses and condos in Magnolia Park
- 01 room
- 52 rooms
- 93 rooms
- 564 rooms
- 655 rooms
- 966 rooms
- 297 rooms
- 288 rooms
- 109+ rooms
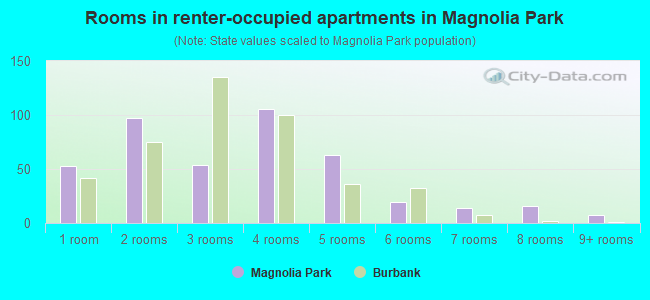
- Rooms in renter-occupied apartments in Magnolia Park
- 531 room
- 972 rooms
- 543 rooms
- 1064 rooms
- 635 rooms
- 196 rooms
- 147 rooms
- 168 rooms
- 79+ rooms
Owner-occupied
Renter-occupied
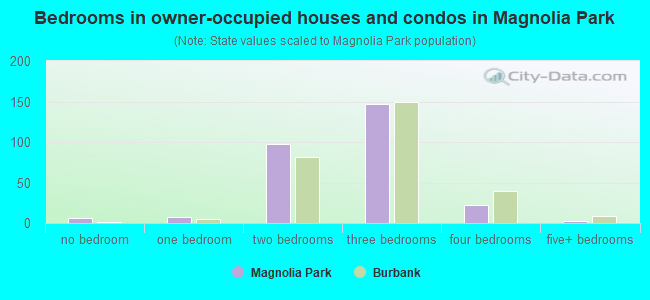
- Bedrooms in owner-occupied houses and condos in Magnolia Park
- 6no bedroom
- 81 bedroom
- 982 bedrooms
- 1473 bedrooms
- 224 bedrooms
- 35+ bedrooms
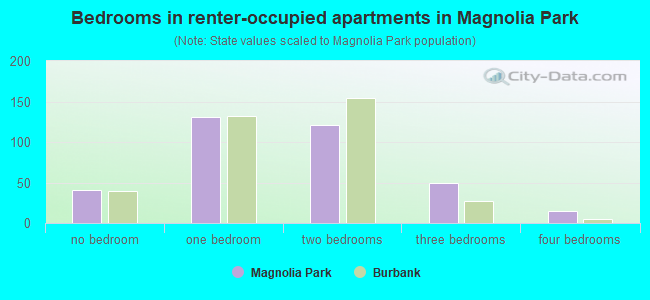
- Bedrooms in renter-occupied apartments in Magnolia Park
- 41no bedroom
- 1311 bedroom
- 1212 bedrooms
- 503 bedrooms
- 154 bedrooms
- 05+ bedrooms
Average number of cars or other vehicles available in houses/condos:
Average number of cars or other vehicles available in apartments:
| This neighborhood: | 1.9 |
| Burbank: | 2.1 |
Average number of cars or other vehicles available in apartments:
| Here: | 1.5 |
| city: | 1.3 |
Percentage of units with a mortgage:
| Magnolia Park: | 76.6% |
| Burbank: | 73.7% |
Average estimated value of detached houses in 2022 (55.2% of all units):
| Magnolia Park: | $975,708 |
| Burbank: | $1,253,446 |
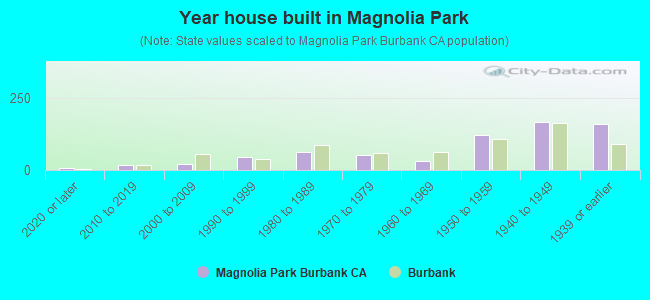
- Year house built in Magnolia Park
- 62020 or later
- 192010 to 2019
- 212000 to 2009
- 461990 to 1999
- 641980 to 1989
- 511970 to 1979
- 321960 to 1969
- 1201950 to 1959
- 1681940 to 1949
- 1611939 or earlier
City-data.com crime index for city in 2020 (higher means more crime):
| City: | 164.4 |
| U.S. average: | 219.5 |
Travel time to work (commute)
![Travel time to work (commute)]()
- 22Less than 5 minutes
- 865 to 9 minutes
- 9210 to 14 minutes
- 8515 to 19 minutes
- 6320 to 24 minutes
- 3625 to 29 minutes
- 9230 to 34 minutes
- 2035 to 39 minutes
- 2540 to 44 minutes
- 5645 to 59 minutes
- 4660 to 89 minutes
- 1190 or more minutes

Means of transportation to work
![Means of transportation to work]()
- 58.1%445Drove a car alone
- 7.1%54Carpooled
- 0.9%7Bus
- 1.4%11Subway or elevated rail
- 1.7%13Taxi
- 1.0%8Motorcycle
- 3.9%30Bicycle
- 3.1%24Walked
- 2.1%16Other means
- 29.1%223Worked at home

Time leaving home to go to work
![Time leaving home to go to work]()
- 1812:00 a.m. to 4:59 a.m.
- 225:00 a.m. to 5:29 a.m.
- 205:30 a.m. to 5:59 a.m.
- 536:00 a.m. to 6:29 a.m.
- 486:30 a.m. to 6:59 a.m.
- 767:00 a.m. to 7:29 a.m.
- 807:30 a.m. to 7:59 a.m.
- 958:00 a.m. to 8:29 a.m.
- 928:30 a.m. to 8:59 a.m.
- 699:00 a.m. to 9:59 a.m.
- 2810:00 a.m. to 10:59 a.m.
- 411:00 a.m. to 11:59 a.m.
- 2812:00 p.m. to 3:59 p.m.
- 204:00 p.m. to 11:59 p.m.

Occupations of males:
- Percentage of males in management occupations (except farmers):
Here: 11.8% city: 12.9%
- Percentage of males in business and financial operations occupations:
Here: 7.1% city: 6.1%
- Percentage of males in computer and mathematical occupations:
Here: 7.7% city: 5.5%
- Percentage of males in architecture and engineering occupations:
Here: 4.7% city: 3.3%
- Percentage of males in community and social services occupations:
Here: 2.7% city: 1.2%
- Percentage of males in education, training, and library occupations:
Here: 3.7% city: 3.3%
- Percentage of males in arts, design, entertainment, sports, and media occupations:
Here: 32.0% city: 18.9%
- Percentage of males in healthcare practitioners and technical occupations:
Here: 1.9% city: 3.0%
- Percentage of males in service occupations:
Here: 4.2% city: 11.2%
- Percentage of males in sales and office occupations:
Here: 14.2% city: 14.1%
- Percentage of males in construction, extraction, and maintenance occupations:
Here: 4.7% city: 3.7%
- Percentage of males in production occupations:
Here: 1.6% city: 4.8%
- Percentage of males in transportation occupations:
Here: 1.3% city: 4.5%
- Percentage of males in material moving occupations:
Here: 1.2% city: 1.8%
Occupations of females:
- Percentage of females in management occupations (except farmers):
Here: 11.2% city: 13.3%
- Percentage of females in business and financial operations occupations:
Here: 11.1% city: 8.3%
- Percentage of females in community and social services occupations:
Here: 4.3% city: 2.2%
- Percentage of females in legal occupations:
Here: 1.8% city: 1.4%
- Percentage of females in education, training, and library occupations:
Here: 15.7% city: 7.5%
- Percentage of females in arts, design, entertainment, sports, and media occupations:
Here: 6.7% city: 11.3%
- Percentage of females in healthcare practitioners and technical occupations:
Here: 7.2% city: 7.1%
- Percentage of females in service occupations:
Here: 16.3% city: 17.4%
- Percentage of females in sales and office occupations:
Here: 17.9% city: 24.6%
- Percentage of females in production occupations:
Here: 5.5% city: 1.7%
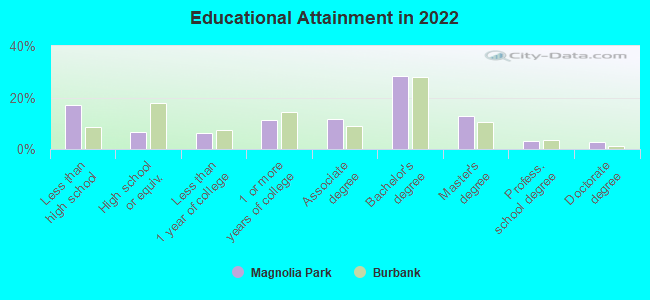
Education in this neighborhood (subdivision or community):
- Percentage of people 3 years and older in K-12 schools:
Magnolia Park: 15.8% Burbank: 13.3%
- Percentage of people 3 years and older in undergraduate colleges:
Magnolia Park: 7.0% Burbank: 5.8%
- Percentage of people 3 years and older in grad. or professional schools:
Magnolia Park: 2.8% Burbank: 2.1%
- Percentage of students K-12 enrolled in private schools:
Magnolia Park: 20.0% Burbank: 10.0%
Percentage of population below poverty level:
| Magnolia Park: | 4.9% |
| Burbank: | 9.5% |
Median year owner moved in (as recorded in 2022):
Median year renter moved in (as recorded in 2022):
| Magnolia Park: | 2005 |
| Burbank: | 2005 |
Median year renter moved in (as recorded in 2022):
| Magnolia Park: | 2016 |
| Burbank: | 2019 |
Percentage of married-couple families with both working:
| Magnolia Park: | 63.2% |
| Burbank: | 68.2% |
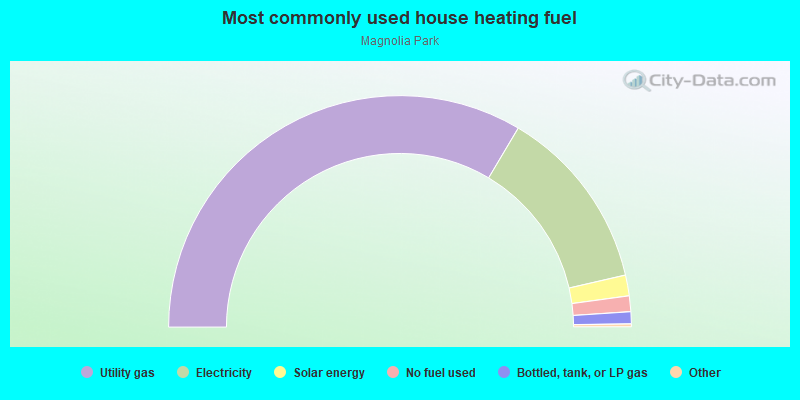
- 67.1%Utility gas
- 25.7%Electricity
- 2.9%Solar energy
- 2.2%No fuel used
- 1.7%Bottled, tank, or LP gas
Roads and streets:
Chandler Blvd (W Chandler Blvd)
Length: 0.58 miles
Directions: E-W, SW-NE
Address range: 3500 to 3898
Directions: E-W, SW-NE
Address range: 3500 to 3898
N Hollywood Way
Length: 0.50 miles
Direction: SE-NW
Address range: 828 to 1195
Direction: SE-NW
Address range: 828 to 1195
N Screenland Dr
Length: 0.49 miles
Direction: SE-NW
Address range: 826 to 1199
Direction: SE-NW
Address range: 826 to 1199
N Cordova St
Length: 0.49 miles
Direction: SE-NW
Address range: 826 to 1199
Direction: SE-NW
Address range: 826 to 1199
N Kenwood St (Kenwood St)
Length: 0.49 miles
Direction: SE-NW
Address range: 826 to 1199
Direction: SE-NW
Address range: 826 to 1199
N Avon St
Length: 0.49 miles
Direction: SE-NW
Address range: 826 to 1199
Direction: SE-NW
Address range: 826 to 1199
W Magnolia Blvd (Magnolia Blvd)
Length: 0.29 miles
Direction: E-W
Address range: 3500 to 3899
Direction: E-W
Address range: 3500 to 3899