Highland Village neighborhood in Miami, Florida (FL), 33181 detailed profile
Settings
X

Business Search - 14 Million verified businesses
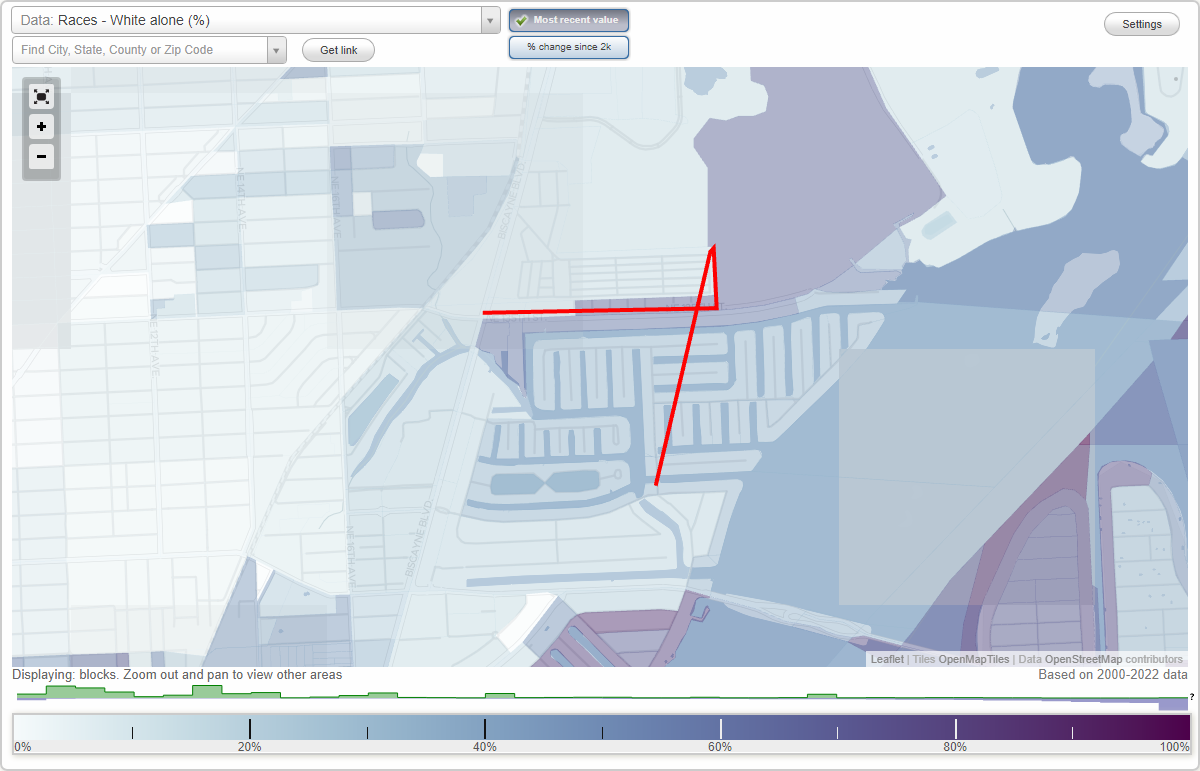
Area: 0.095 square miles
Population: 54
Population density:
| Highland Village: | 569 people per square mile |
| Miami: | 12,600 people per square mile |

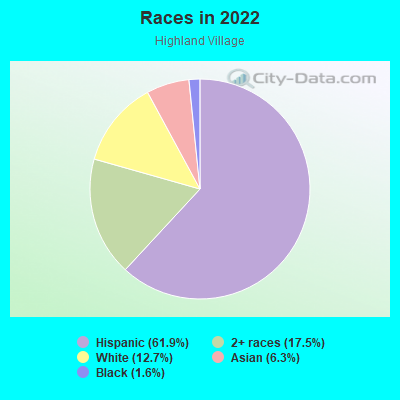
- 3961.9%Hispanic or Latino
- 1117.5%Two or more races
- 812.7%White
- 46.3%Asian
- 11.6%Black
Median household income in 2022:
| Highland Village: | $50,741 |
| Miami: | $60,989 |
Distribution of median household income
![Distribution of median household income]()
- 2Less than $10,000
- 9$10,000 to $19,999
- 8$20,000 to $29,999
- 8$30,000 to $39,999
- 7$40,000 to $49,999
- 10$50,000 to $59,999
- 3$60,000 to $74,999
- 22$75,000 to $99,999
- 6$100,000 to $124,999
- 10$125,000 to $149,999
- 3$150,000 to $199,999
- 2$200,000 or more

Distribution of owner-occupied house/condo value
![Distribution of owner-occupied house/condo value]()
- 2$50,000 to $99,999
- 3$100,000 to $149,999
- 3$150,000 to $199,999
- 14$300,000 to $399,999
- 2$400,000 to $499,999
- 1$500,000 to $749,999
- 3$1,000,000 or more

Distribution of rent paid by renters
![Distribution of rent paid by renters]()
- 4$100 to $199
- 1$500 to $599
- 2$800 to $899
- 8$900 to $999
- 6$1,000 to $1,249
- 4$1,250 to $1,499
- 4$1,500 to $1,999
- 24$2,000 or more

Median rent in 2022:
| Highland Village: | $1,085 |
| Miami: | $1,460 |
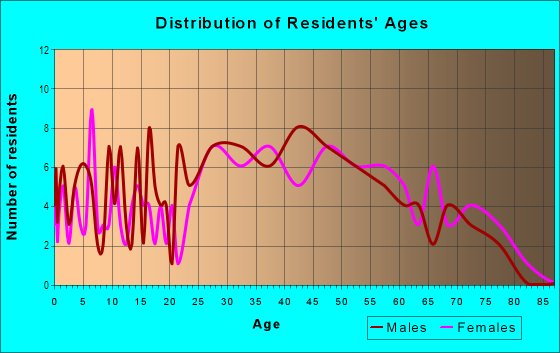
| Males: | 25 |
| Females: | 29 |
Males:
| This neighborhood: | 40.9 years |
| Whole city: | 38.3 years |
| This neighborhood: | 33.9 years |
| Whole city: | 41.9 years |
Average household size:
| Highland Village: | 21.0 people |
| Miami: | 2.2 people |
Percentage of family households:
| Highland Village: | 52.1% |
| Miami: | 34.3% |
| Here: | 51.1% |
| Miami: | 28.3% |
Percentage of married-couple families with children (among all households):
| Highland Village: | 49.9% |
| Miami: | 22.4% |
Percentage of single-mother households (among all households):
| Highland Village: | 40.9% |
| Miami: | 17.5% |
Percentage of never married males 15 years old and over:
Percentage of never married females 15 years old and over:
| Highland Village: | 19.8% |
| Miami: | 25.1% |
Percentage of never married females 15 years old and over:
| Highland Village: | 15.4% |
| city: | 18.0% |
Percentage of people that speak English not well or not at all:
| Highland Village: | 40.7% |
| Miami: | 25.5% |
Percentage of people born in this state:
Percentage of people born in another U.S. state:
Percentage of native residents but born outside the U.S.:
Percentage of foreign born residents:
| Here: | 23.1% |
| Miami: | 26.5% |
Percentage of people born in another U.S. state:
| Highland Village: | 11.3% |
| Miami: | 11.8% |
Percentage of native residents but born outside the U.S.:
| Here: | 1.4% |
| city: | 3.9% |
Percentage of foreign born residents:
| Here: | 64.2% |
| Miami: | 57.8% |
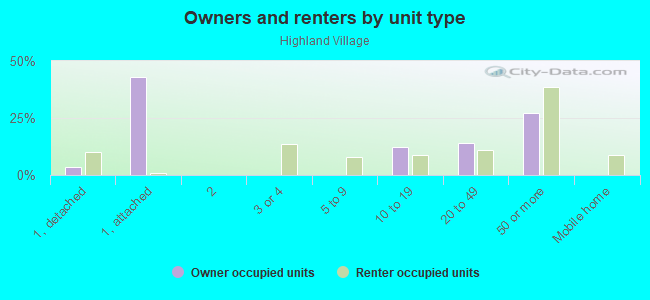
Owner-occupied
Renter-occupied

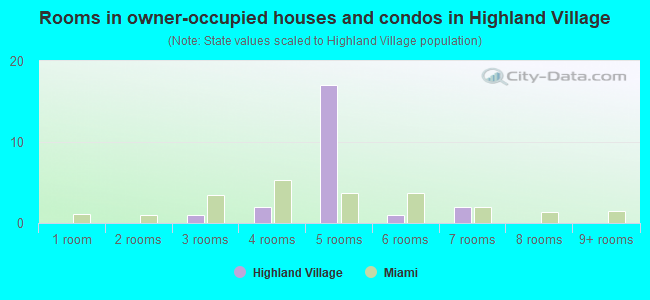
- Rooms in owner-occupied houses and condos in Highland Village
- 01 room
- 02 rooms
- 13 rooms
- 24 rooms
- 175 rooms
- 16 rooms
- 27 rooms
- 08 rooms
- 09+ rooms
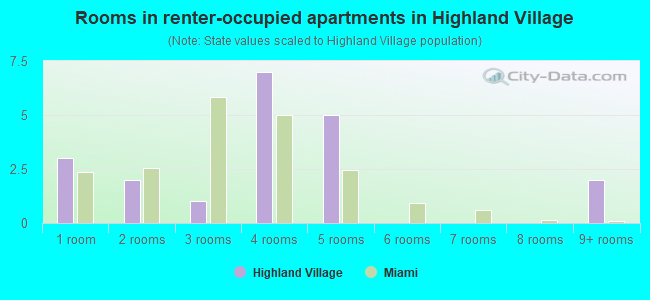
- Rooms in renter-occupied apartments in Highland Village
- 31 room
- 22 rooms
- 13 rooms
- 74 rooms
- 55 rooms
- 06 rooms
- 07 rooms
- 08 rooms
- 29+ rooms
Owner-occupied
Renter-occupied
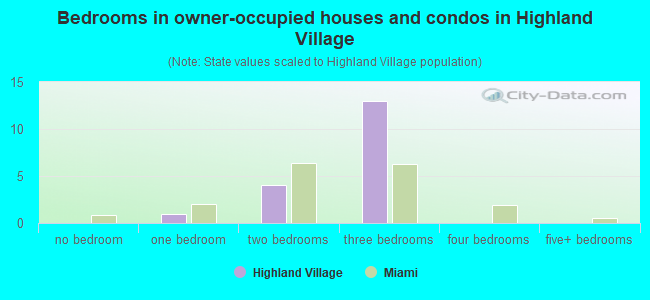
- Bedrooms in owner-occupied houses and condos in Highland Village
- 0no bedroom
- 11 bedroom
- 42 bedrooms
- 133 bedrooms
- 04 bedrooms
- 05+ bedrooms
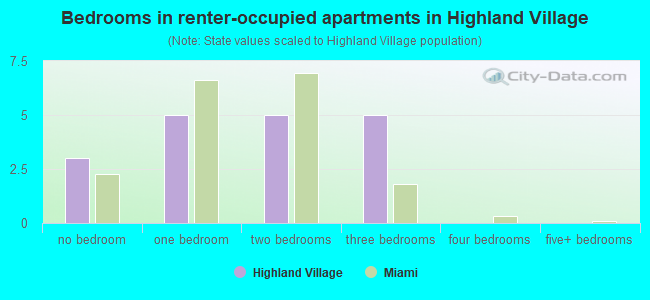
- Bedrooms in renter-occupied apartments in Highland Village
- 3no bedroom
- 51 bedroom
- 52 bedrooms
- 53 bedrooms
- 04 bedrooms
- 05+ bedrooms
Average number of cars or other vehicles available in houses/condos:
Average number of cars or other vehicles available in apartments:
| This neighborhood: | 1.6 |
| Miami: | 1.6 |
Average number of cars or other vehicles available in apartments:
| Here: | 1.7 |
| city: | 1.1 |
Percentage of units with a mortgage:
| Highland Village: | 70.2% |
| Miami: | 55.0% |
Housing prices:
- Average estimated value of detached houses in 2022 (26.5% of all units):
Highland Village: $1,105,479 Miami: $834,023
- Average estimated '22 value of housing units in 5-or-more-unit structures (158.8% of all units):
Highland Village: $512,767 Miami: $631,350
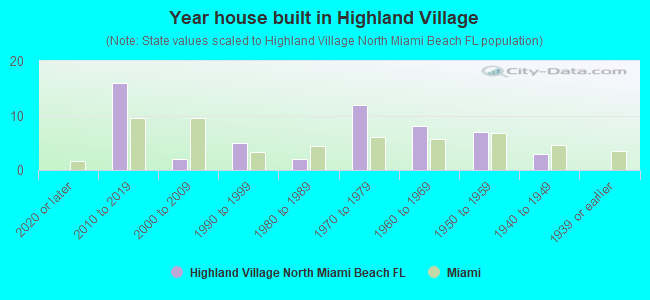
- Year house built in Highland Village
- 02020 or later
- 162010 to 2019
- 22000 to 2009
- 51990 to 1999
- 21980 to 1989
- 121970 to 1979
- 81960 to 1969
- 71950 to 1959
- 31940 to 1949
- 01939 or earlier
City-data.com crime index for city in 2020 (higher means more crime):
| City: | 291.6 |
| U.S. average: | 219.5 |
Travel time to work (commute)
![Travel time to work (commute)]()
- 45 to 9 minutes
- 610 to 14 minutes
- 2615 to 19 minutes
- 1920 to 24 minutes
- 2125 to 29 minutes
- 3430 to 34 minutes
- 1835 to 39 minutes
- 440 to 44 minutes
- 145 to 59 minutes
- 860 to 89 minutes

Means of transportation to work
![Means of transportation to work]()
- 88.6%32Drove a car alone
- 2.8%1Carpooled
- 47.0%17Bus
- 5.5%2Walked
- 2.8%1Other means
- 19.4%7Worked at home

Time leaving home to go to work
![Time leaving home to go to work]()
- 512:00 a.m. to 4:59 a.m.
- 25:00 a.m. to 5:29 a.m.
- 216:00 a.m. to 6:29 a.m.
- 66:30 a.m. to 6:59 a.m.
- 407:00 a.m. to 7:29 a.m.
- 77:30 a.m. to 7:59 a.m.
- 188:00 a.m. to 8:29 a.m.
- 48:30 a.m. to 8:59 a.m.
- 279:00 a.m. to 9:59 a.m.
- 610:00 a.m. to 10:59 a.m.
- 511:00 a.m. to 11:59 a.m.
- 912:00 p.m. to 3:59 p.m.
- 44:00 p.m. to 11:59 p.m.

Occupations of males:
- Percentage of males in management occupations (except farmers):
Here: 13.2% city: 14.1%
- Percentage of males in business and financial operations occupations:
Here: 17.6% city: 5.1%
- Percentage of males in computer and mathematical occupations:
Here: 43.9% city: 2.5%
- Percentage of males in architecture and engineering occupations:
Here: 4.9% city: 2.0%
- Percentage of males in life, physical, and social science occupations:
Here: 12.7% city: 0.5%
- Percentage of males in legal occupations:
Here: 5.9% city: 1.8%
- Percentage of males in education, training, and library occupations:
Here: 5.9% city: 1.9%
- Percentage of males in arts, design, entertainment, sports, and media occupations:
Here: 7.3% city: 2.7%
- Percentage of males in service occupations:
Here: 10.7% city: 15.7%
- Percentage of males in sales and office occupations:
Here: 17.1% city: 15.9%
- Percentage of males in construction, extraction, and maintenance occupations:
Here: 22.0% city: 15.9%
- Percentage of males in transportation occupations:
Here: 17.1% city: 7.7%
- Percentage of males in material moving occupations:
Here: 38.1% city: 3.4%
Occupations of females:
- Percentage of females in management occupations (except farmers):
Here: 10.2% city: 9.8%
- Percentage of females in community and social services occupations:
Here: 19.3% city: 1.4%
- Percentage of females in legal occupations:
Here: 2.3% city: 3.0%
- Percentage of females in education, training, and library occupations:
Here: 10.2% city: 5.4%
- Percentage of females in arts, design, entertainment, sports, and media occupations:
Here: 6.2% city: 2.6%
- Percentage of females in healthcare practitioners and technical occupations:
Here: 5.7% city: 6.4%
- Percentage of females in service occupations:
Here: 46.0% city: 29.1%
- Percentage of females in sales and office occupations:
Here: 15.9% city: 27.0%
- Percentage of females in production occupations:
Here: 11.4% city: 1.9%
- Percentage of females in transportation occupations:
Here: 9.7% city: 1.9%
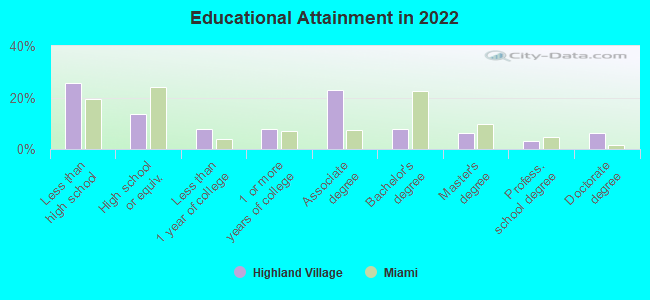
Education in this neighborhood (subdivision or community):
- Percentage of people 3 years and older in K-12 schools:
Highland Village: 51.9% Miami: 10.9%
- Percentage of people 3 years and older in undergraduate colleges:
Highland Village: 16.7% Miami: 3.3%
- Percentage of people 3 years and older in grad. or professional schools:
Highland Village: 5.6% Miami: 1.7%
- Percentage of students K-12 enrolled in private schools:
Highland Village: 10.7% Miami: 13.3%
Percentage of population below poverty level:
| Highland Village: | 20.8% |
| Miami: | 18.7% |
Median year owner moved in (as recorded in 2022):
Median year renter moved in (as recorded in 2022):
| Highland Village: | 2017 |
| Miami: | 2013 |
Median year renter moved in (as recorded in 2022):
| Highland Village: | 2016 |
| Miami: | 2019 |
Percentage of married-couple families with both working:
| Highland Village: | 68.1% |
| Miami: | 62.1% |
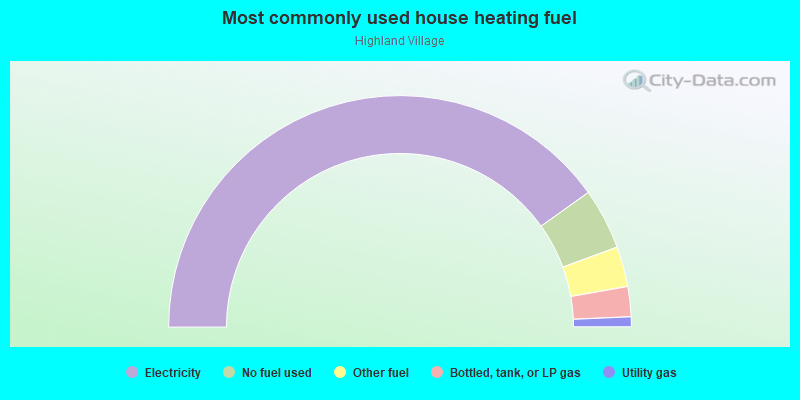
- 80.2%Electricity
- 8.5%No fuel used
- 5.6%Other fuel
- 4.2%Bottled, tank, or LP gas
- 1.4%Utility gas
Roads and streets:
NE 135th Ter
Length: 0.55 miles
Direction: E-W
Address range: 2000 to 2502
Direction: E-W
Address range: 2000 to 2502
NE 137th St
Length: 0.53 miles
Direction: E-W
Address range: 2000 to 2599
Direction: E-W
Address range: 2000 to 2599
NE 135th Ln
Length: 0.45 miles
Direction: E-W
Address range: 2059 to 2499
Direction: E-W
Address range: 2059 to 2499
NE 136th Ter
Length: 0.45 miles
Direction: E-W
Address range: 2050 to 2499
Direction: E-W
Address range: 2050 to 2499
NE 136th St
Length: 0.41 miles
Direction: E-W
Address range: 2200 to 2499
Direction: E-W
Address range: 2200 to 2499
NE 136th Ln
Length: 0.41 miles
Direction: E-W
Address range: 2200 to 2499
Direction: E-W
Address range: 2200 to 2499
NE 25th Ave
Length: 0.12 miles
Directions: E-W, N-S, SW-NE
Address range: 13500 to 13699
Directions: E-W, N-S, SW-NE
Address range: 13500 to 13699
Highlands Dr
Length: 0.10 miles
Direction: N-S
Address range: 13500 to 13699
Direction: N-S
Address range: 13500 to 13699
NE 24th Ave
Length: 0.10 miles
Direction: N-S
Address range: 13500 to 13699
Direction: N-S
Address range: 13500 to 13699
NE 22nd Ave
Length: 0.10 miles
Direction: N-S
Address range: 13500 to 13699
Direction: N-S
Address range: 13500 to 13699
NE 23rd Ave
Length: 0.10 miles
Direction: N-S
Address range: 13500 to 13699
Direction: N-S
Address range: 13500 to 13699
Lake Dr
Length: 0.10 miles
Directions: N-S, SE-NW
Address range: 13500 to 13699
Directions: N-S, SE-NW
Address range: 13500 to 13699
NE 20th Ct
Length: 0.10 miles
Direction: N-S
Address range: 13516 to 13699
Direction: N-S
Address range: 13516 to 13699
NE 20th Ave
Length: 0.10 miles
Direction: N-S
Address range: 13501 to 13699
Direction: N-S
Address range: 13501 to 13699
NE 20th Ln
Length: 0.01 miles
Directions: N-S, SE-NW
Directions: N-S, SE-NW