Cypress Park neighborhood in Los Angeles, California (CA), 90065 detailed profile
Settings
X

Business Search - 14 Million verified businesses
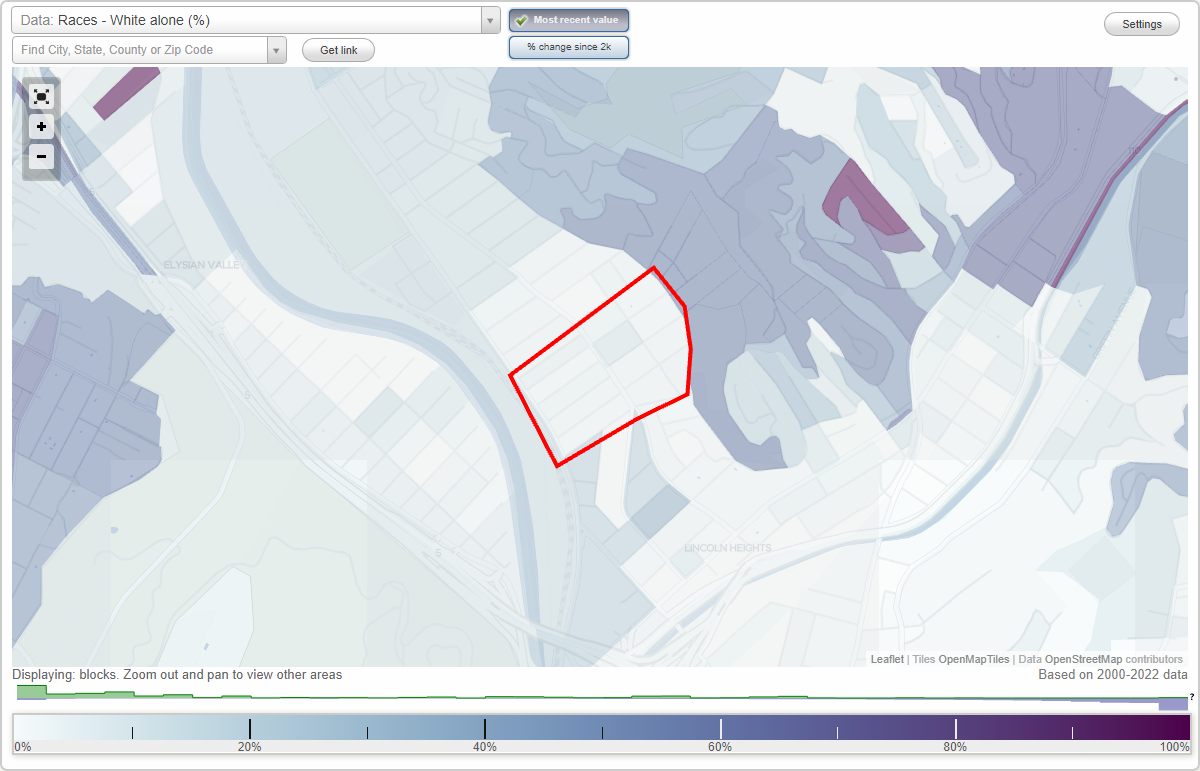
Area: 0.120 square miles
Population: 2,338
Population density:
| Cypress Park: | 19,552 people per square mile |
| Los Angeles: | 8,148 people per square mile |

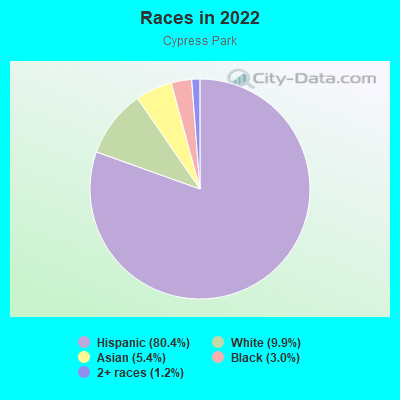
- 1,92480.4%Hispanic or Latino
- 2389.9%White
- 1305.4%Asian
- 723.0%Black
- 291.2%Two or more races
Median household income in 2022:
| Cypress Park: | $68,578 |
| Los Angeles: | $76,135 |
Distribution of median household income
![Distribution of median household income]()
- 27Less than $10,000
- 72$10,000 to $19,999
- 75$20,000 to $29,999
- 50$30,000 to $39,999
- 72$40,000 to $49,999
- 56$50,000 to $59,999
- 74$60,000 to $74,999
- 92$75,000 to $99,999
- 87$100,000 to $124,999
- 55$125,000 to $149,999
- 65$150,000 to $199,999
- 47$200,000 or more

Distribution of owner-occupied house/condo value
![Distribution of owner-occupied house/condo value]()
- 13$50,000 to $99,999
- 19$150,000 to $199,999
- 12$300,000 to $399,999
- 28$400,000 to $499,999
- 142$500,000 to $749,999
- 99$750,000 to $999,999
- 72$1,000,000 or more

Distribution of rent paid by renters
![Distribution of rent paid by renters]()
- 36$300 to $399
- 8$500 to $599
- 77$600 to $699
- 51$700 to $799
- 55$800 to $899
- 19$900 to $999
- 90$1,000 to $1,249
- 49$1,250 to $1,499
- 73$1,500 to $1,999
- 84$2,000 or more

Median rent in 2022:
| Cypress Park: | $1,216 |
| Los Angeles: | $1,648 |
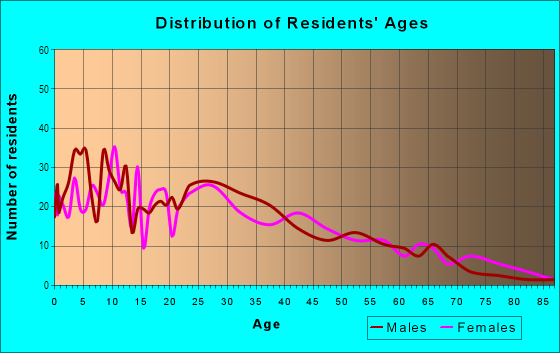
| Males: | 1,271 |
| Females: | 1,067 |
Males:
| This neighborhood: | 36.0 years |
| Whole city: | 36.5 years |
| This neighborhood: | 40.9 years |
| Whole city: | 37.9 years |
Average household size:
| Cypress Park: | 12.4 people |
| Los Angeles: | 2.6 people |
Percentage of family households:
| Cypress Park: | 42.5% |
| Los Angeles: | 40.1% |
| Here: | 38.3% |
| Los Angeles: | 36.7% |
Percentage of married-couple families with children (among all households):
| Cypress Park: | 17.0% |
| Los Angeles: | 24.3% |
Percentage of single-mother households (among all households):
| Cypress Park: | 10.7% |
| Los Angeles: | 9.9% |
Percentage of never married males 15 years old and over:
Percentage of never married females 15 years old and over:
| Cypress Park: | 32.9% |
| Los Angeles: | 24.7% |
Percentage of never married females 15 years old and over:
| Cypress Park: | 18.6% |
| city: | 22.0% |
Percentage of people that speak English not well or not at all:
| Cypress Park: | 19.8% |
| Los Angeles: | 13.8% |
Percentage of people born in this state:
Percentage of people born in another U.S. state:
Percentage of native residents but born outside the U.S.:
Percentage of foreign born residents:
| Here: | 52.5% |
| Los Angeles: | 46.9% |
Percentage of people born in another U.S. state:
| Cypress Park: | 8.2% |
| Los Angeles: | 15.7% |
Percentage of native residents but born outside the U.S.:
| Here: | 1.7% |
| city: | 1.6% |
Percentage of foreign born residents:
| Here: | 37.6% |
| Los Angeles: | 35.7% |
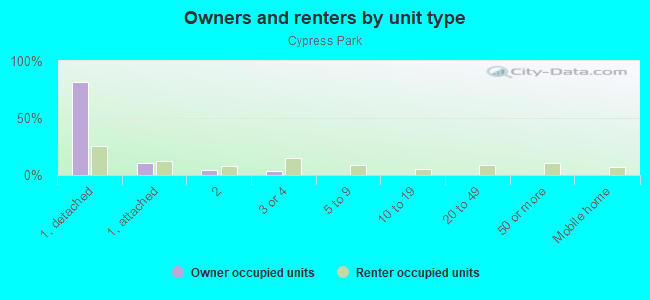
Owner-occupied
Renter-occupied

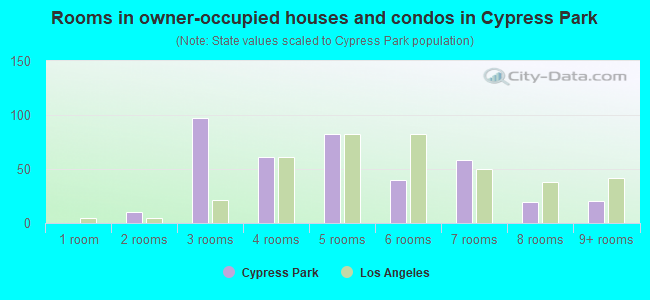
- Rooms in owner-occupied houses and condos in Cypress Park
- 01 room
- 102 rooms
- 973 rooms
- 614 rooms
- 825 rooms
- 406 rooms
- 587 rooms
- 198 rooms
- 209+ rooms
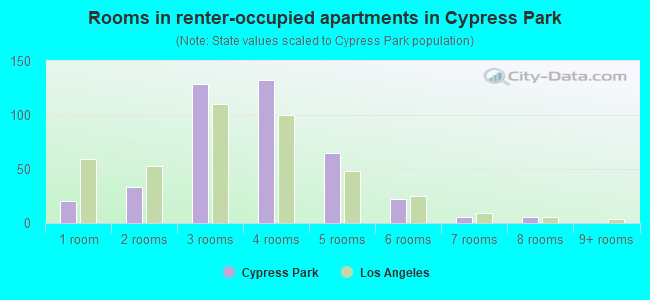
- Rooms in renter-occupied apartments in Cypress Park
- 201 room
- 332 rooms
- 1293 rooms
- 1324 rooms
- 655 rooms
- 226 rooms
- 67 rooms
- 68 rooms
- 09+ rooms
Owner-occupied
Renter-occupied
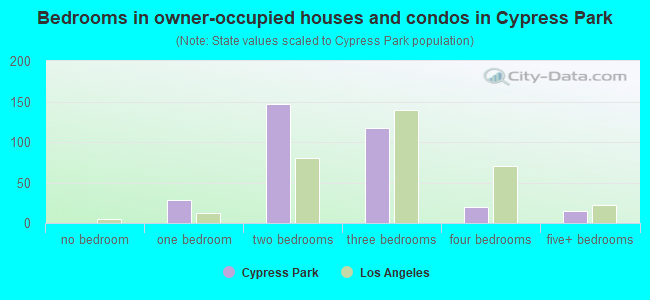
- Bedrooms in owner-occupied houses and condos in Cypress Park
- 0no bedroom
- 281 bedroom
- 1472 bedrooms
- 1173 bedrooms
- 204 bedrooms
- 155+ bedrooms
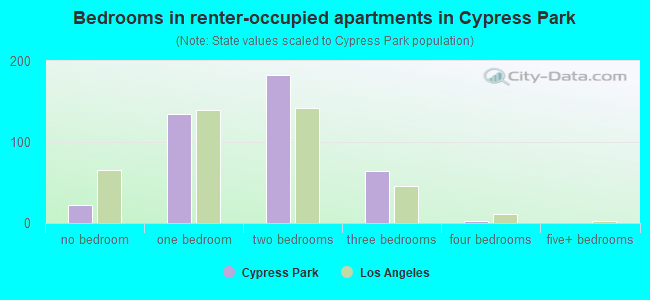
- Bedrooms in renter-occupied apartments in Cypress Park
- 22no bedroom
- 1351 bedroom
- 1832 bedrooms
- 643 bedrooms
- 34 bedrooms
- 05+ bedrooms
Average number of cars or other vehicles available in houses/condos:
Average number of cars or other vehicles available in apartments:
| This neighborhood: | 2.4 |
| Los Angeles: | 2.1 |
Average number of cars or other vehicles available in apartments:
| Here: | 1.6 |
| city: | 1.3 |
Percentage of units with a mortgage:
| Cypress Park: | 63.7% |
| Los Angeles: | 68.9% |
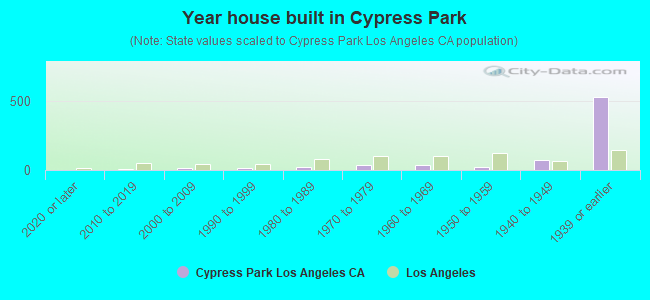
- Year house built in Cypress Park
- 02020 or later
- 72010 to 2019
- 122000 to 2009
- 181990 to 1999
- 251980 to 1989
- 391970 to 1979
- 371960 to 1969
- 251950 to 1959
- 761940 to 1949
- 5291939 or earlier
City-data.com crime index for city in 2020 (higher means more crime):
| City: | 327.4 |
| U.S. average: | 219.5 |
Travel time to work (commute)
![Travel time to work (commute)]()
- 13Less than 5 minutes
- 475 to 9 minutes
- 9310 to 14 minutes
- 14415 to 19 minutes
- 12620 to 24 minutes
- 6425 to 29 minutes
- 20730 to 34 minutes
- 2635 to 39 minutes
- 3140 to 44 minutes
- 16045 to 59 minutes
- 14260 to 89 minutes
- 3490 or more minutes

Means of transportation to work
![Means of transportation to work]()
- 74.6%874Drove a car alone
- 13.7%160Carpooled
- 4.6%54Bus
- 1.5%18Subway or elevated rail
- 1.5%17Long-distance train or commuter rail
- 2.4%28Light rail, streetcar or trolley
- 0.5%6Motorcycle
- 1.1%13Bicycle
- 0.5%6Walked
- 5.1%60Other means
- 4.4%51Worked at home

Time leaving home to go to work
![Time leaving home to go to work]()
- 4712:00 a.m. to 4:59 a.m.
- 975:00 a.m. to 5:29 a.m.
- 605:30 a.m. to 5:59 a.m.
- 456:00 a.m. to 6:29 a.m.
- 456:30 a.m. to 6:59 a.m.
- 2077:00 a.m. to 7:29 a.m.
- 877:30 a.m. to 7:59 a.m.
- 1908:00 a.m. to 8:29 a.m.
- 228:30 a.m. to 8:59 a.m.
- 679:00 a.m. to 9:59 a.m.
- 8610:00 a.m. to 10:59 a.m.
- 1111:00 a.m. to 11:59 a.m.
- 8912:00 p.m. to 3:59 p.m.
- 254:00 p.m. to 11:59 p.m.

Occupations of males:
- Percentage of males in management occupations (except farmers):
Here: 6.4% city: 10.6%
- Percentage of males in business and financial operations occupations:
Here: 5.8% city: 5.0%
- Percentage of males in computer and mathematical occupations:
Here: 3.8% city: 3.6%
- Percentage of males in education, training, and library occupations:
Here: 4.6% city: 3.2%
- Percentage of males in arts, design, entertainment, sports, and media occupations:
Here: 6.9% city: 8.0%
- Percentage of males in healthcare practitioners and technical occupations:
Here: 1.2% city: 2.9%
- Percentage of males in service occupations:
Here: 12.0% city: 16.2%
- Percentage of males in sales and office occupations:
Here: 16.0% city: 15.1%
- Percentage of males in construction, extraction, and maintenance occupations:
Here: 17.2% city: 9.6%
- Percentage of males in production occupations:
Here: 11.7% city: 5.9%
- Percentage of males in transportation occupations:
Here: 6.0% city: 5.6%
- Percentage of males in material moving occupations:
Here: 2.3% city: 4.4%
Occupations of females:
- Percentage of females in management occupations (except farmers):
Here: 5.9% city: 10.5%
- Percentage of females in business and financial operations occupations:
Here: 7.4% city: 6.5%
- Percentage of females in architecture and engineering occupations:
Here: 1.0% city: 0.7%
- Percentage of females in life, physical, and social science occupations:
Here: 2.2% city: 1.2%
- Percentage of females in community and social services occupations:
Here: 6.1% city: 2.3%
- Percentage of females in legal occupations:
Here: 1.7% city: 2.1%
- Percentage of females in education, training, and library occupations:
Here: 5.6% city: 7.1%
- Percentage of females in arts, design, entertainment, sports, and media occupations:
Here: 1.4% city: 6.3%
- Percentage of females in healthcare practitioners and technical occupations:
Here: 2.3% city: 6.5%
- Percentage of females in service occupations:
Here: 32.7% city: 23.6%
- Percentage of females in sales and office occupations:
Here: 23.1% city: 24.7%
- Percentage of females in production occupations:
Here: 6.1% city: 3.5%
- Percentage of females in material moving occupations:
Here: 1.7% city: 2.0%
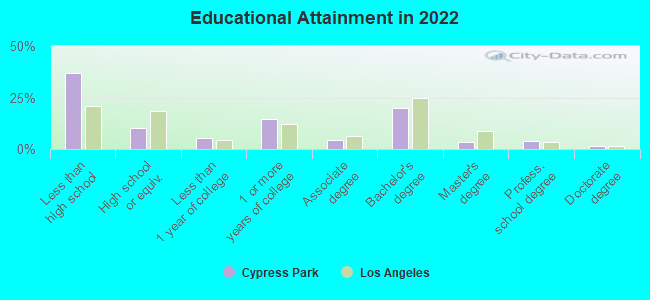
Education in this neighborhood (subdivision or community):
- Percentage of people 3 years and older in K-12 schools:
Cypress Park: 17.5% Los Angeles: 14.4%
- Percentage of people 3 years and older in undergraduate colleges:
Cypress Park: 6.6% Los Angeles: 6.0%
- Percentage of people 3 years and older in grad. or professional schools:
Cypress Park: 1.3% Los Angeles: 2.1%
- Percentage of students K-12 enrolled in private schools:
Cypress Park: 32.8% Los Angeles: 12.1%
Percentage of population below poverty level:
| Cypress Park: | 20.3% |
| Los Angeles: | 16.8% |
Median year owner moved in (as recorded in 2022):
Median year renter moved in (as recorded in 2022):
| Cypress Park: | 1994 |
| Los Angeles: | 2007 |
Median year renter moved in (as recorded in 2022):
| Cypress Park: | 2011 |
| Los Angeles: | 2018 |
Percentage of married-couple families with both working:
| Cypress Park: | 62.1% |
| Los Angeles: | 63.8% |
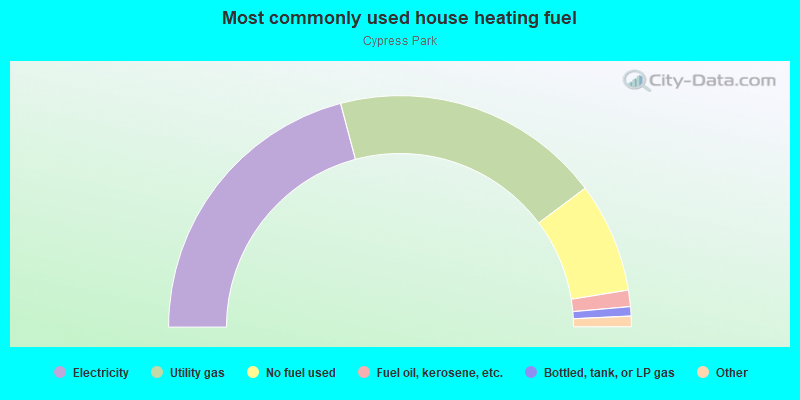
- 41.8%Electricity
- 37.8%Utility gas
- 15.4%No fuel used
- 2.3%Fuel oil, kerosene, etc.
- 1.3%Bottled, tank, or LP gas
- 0.8%Other fuel
- 0.6%Solar energy
Highways in this neighborhood:
I- 5 Bus (N San Fernando Rd)
Length: 0.24 miles
Direction: SE-NW
Address range: 700 to 1045
Direction: SE-NW
Address range: 700 to 1045
Roads and streets:
Maceo St
Length: 0.49 miles
Directions: E-W, SW-NE
Address range: 2600 to 3499
Directions: E-W, SW-NE
Address range: 2600 to 3499
Thorpe Ave
Length: 0.48 miles
Direction: SW-NE
Address range: 2600 to 3499
Direction: SW-NE
Address range: 2600 to 3499
Merced St
Length: 0.47 miles
Direction: SW-NE
Address range: 2600 to 3499
Direction: SW-NE
Address range: 2600 to 3499
Pepper Ave
Length: 0.38 miles
Directions: E-W, SW-NE
Address range: 2600 to 3399
Directions: E-W, SW-NE
Address range: 2600 to 3399
Cypress Ave
Length: 0.26 miles
Direction: SE-NW
Address range: 688 to 1049
Direction: SE-NW
Address range: 688 to 1049
Aragon Ave
Length: 0.25 miles
Direction: SE-NW
Address range: 700 to 999
Direction: SE-NW
Address range: 700 to 999
Loosmore St
Length: 0.23 miles
Direction: SW-NE
Address range: 2600 to 2699
Direction: SW-NE
Address range: 2600 to 2699
Carleton Ave
Length: 0.23 miles
Direction: SW-NE
Address range: 2600 to 2699
Direction: SW-NE
Address range: 2600 to 2699
Isabel St
Length: 0.18 miles
Directions: N-S, SE-NW
Address range: 800 to 1048
Directions: N-S, SE-NW
Address range: 800 to 1048
W Ave 28
Length: 0.01 miles
Direction: N-S
Address range: 695 to 699
Direction: N-S
Address range: 695 to 699