Burbank North Estates neighborhood in Burbank, California (CA), 91501, 91504 detailed profile
Settings
X

Business Search - 14 Million verified businesses
Area: 0.604 square miles
Population: 1,430
Population density:
| Burbank North Estates: | 2,367 people per square mile |
| Burbank: | 5,990 people per square mile |

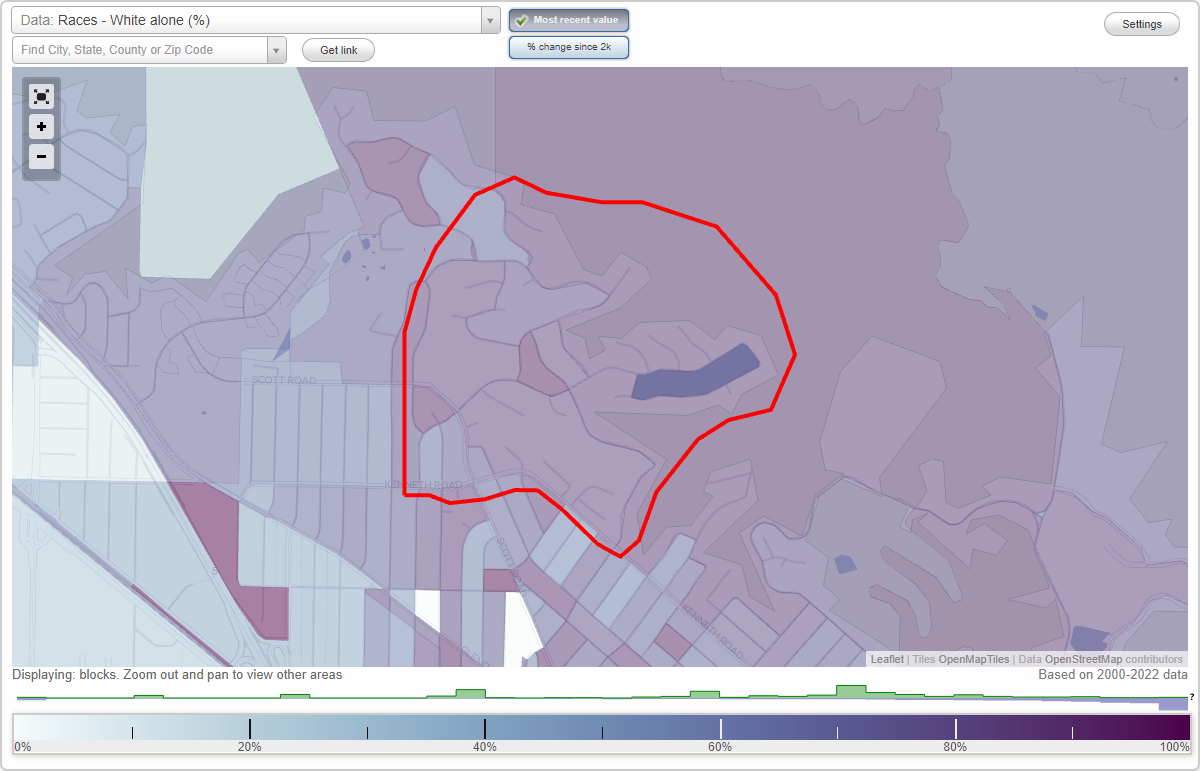
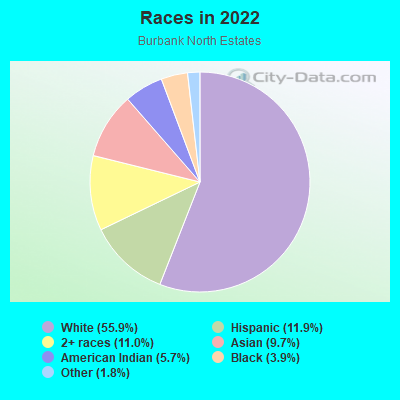
- 94155.9%White
- 20111.9%Hispanic or Latino
- 18511.0%Two or more races
- 1649.7%Asian
- 965.7%American Indian
- 663.9%Black
- 301.8%Some other race
Median household income in 2022:
| Burbank North Estates: | $146,206 |
| Burbank: | $92,581 |
Distribution of median household income
![Distribution of median household income]()
- 145Less than $10,000
- 28$10,000 to $19,999
- 232$20,000 to $29,999
- 63$30,000 to $39,999
- 40$40,000 to $49,999
- 40$50,000 to $59,999
- 9$60,000 to $74,999
- 111$75,000 to $99,999
- 4$100,000 to $124,999
- 60$125,000 to $149,999
- 55$150,000 to $199,999
- 166$200,000 or more

Distribution of owner-occupied house/condo value
![Distribution of owner-occupied house/condo value]()
- 25Less than $50,000
- 20$50,000 to $99,999
- 113$100,000 to $149,999
- 39$150,000 to $199,999
- 54$250,000 to $299,999
- 26$300,000 to $399,999
- 60$400,000 to $499,999
- 24$500,000 to $749,999
- 80$750,000 to $999,999
- 309$1,000,000 or more

Distribution of rent paid by renters
![Distribution of rent paid by renters]()
- 28$800 to $899
- 4$900 to $999
- 92$1,000 to $1,249
- 149$1,250 to $1,499
- 149$1,500 to $1,999
- 365$2,000 or more

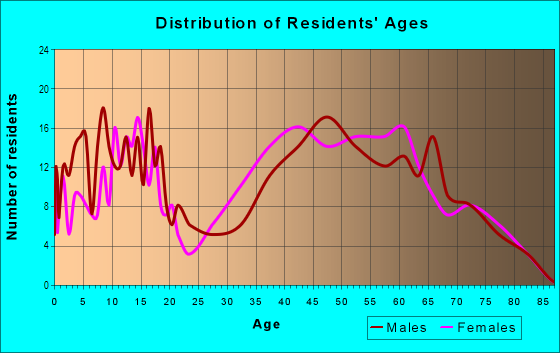
| Males: | 633 |
| Females: | 797 |
Males:
| This neighborhood: | 47.0 years |
| Whole city: | 36.7 years |
| This neighborhood: | 52.7 years |
| Whole city: | 42.1 years |
Average household size:
| Burbank North Estates: | 2.8 people |
| Burbank: | 2.4 people |
Percentage of family households:
| Burbank North Estates: | 29.5% |
| Burbank: | 43.5% |
| Here: | 80.4% |
| Burbank: | 40.3% |
Percentage of married-couple families with children (among all households):
| Burbank North Estates: | 31.6% |
| Burbank: | 32.8% |
Percentage of single-mother households (among all households):
| Burbank North Estates: | 2.7% |
| Burbank: | 7.0% |
Percentage of never married males 15 years old and over:
Percentage of never married females 15 years old and over:
| Burbank North Estates: | 4.8% |
| Burbank: | 20.3% |
Percentage of never married females 15 years old and over:
| Burbank North Estates: | 16.8% |
| city: | 18.6% |
Percentage of people that speak English not well or not at all:
| Burbank North Estates: | 3.6% |
| Burbank: | 5.9% |
Percentage of people born in this state:
Percentage of people born in another U.S. state:
Percentage of native residents but born outside the U.S.:
Percentage of foreign born residents:
| Here: | 48.4% |
| Burbank: | 50.1% |
Percentage of people born in another U.S. state:
| Burbank North Estates: | 18.5% |
| Burbank: | 21.2% |
Percentage of native residents but born outside the U.S.:
| Here: | 1.5% |
| city: | 1.2% |
Percentage of foreign born residents:
| Here: | 31.6% |
| Burbank: | 27.4% |
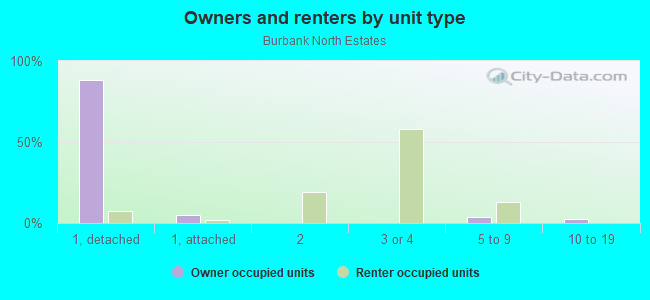
Owner-occupied
Renter-occupied

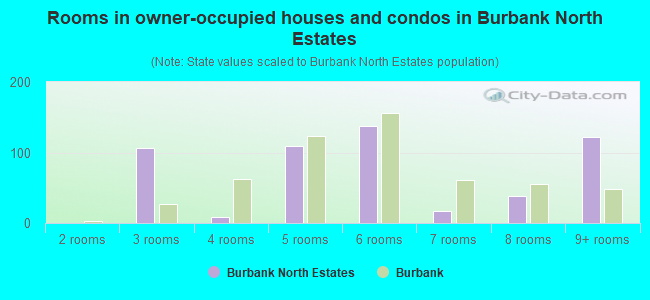
- Rooms in owner-occupied houses and condos in Burbank North Estates
- 01 room
- 02 rooms
- 1073 rooms
- 84 rooms
- 1095 rooms
- 1386 rooms
- 177 rooms
- 388 rooms
- 1229+ rooms
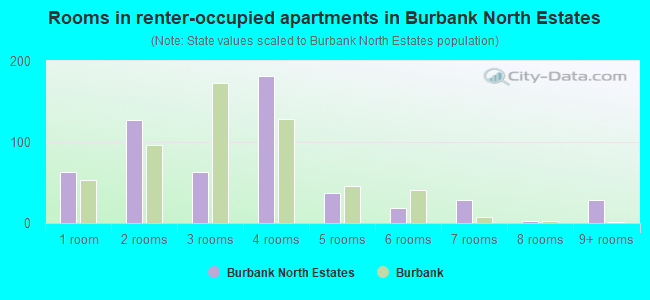
- Rooms in renter-occupied apartments in Burbank North Estates
- 631 room
- 1272 rooms
- 633 rooms
- 1824 rooms
- 375 rooms
- 196 rooms
- 287 rooms
- 28 rooms
- 289+ rooms
Owner-occupied
Renter-occupied
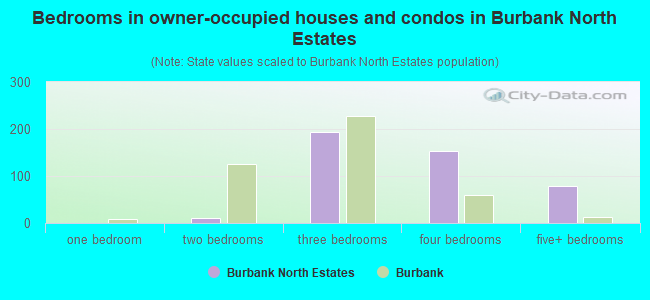
- Bedrooms in owner-occupied houses and condos in Burbank North Estates
- 0no bedroom
- 01 bedroom
- 112 bedrooms
- 1933 bedrooms
- 1534 bedrooms
- 785+ bedrooms
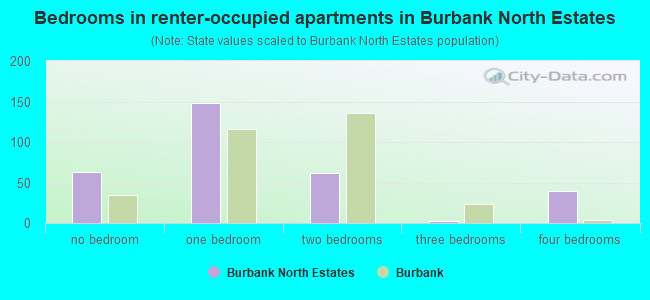
- Bedrooms in renter-occupied apartments in Burbank North Estates
- 63no bedroom
- 1481 bedroom
- 622 bedrooms
- 33 bedrooms
- 404 bedrooms
- 05+ bedrooms
Average number of cars or other vehicles available in houses/condos:
Average number of cars or other vehicles available in apartments:
| This neighborhood: | 0.4 |
| Burbank: | 2.1 |
Average number of cars or other vehicles available in apartments:
| Here: | |
| city: |
Percentage of units with a mortgage:
| Burbank North Estates: | 71.0% |
| Burbank: | 73.7% |
Average estimated value of detached houses in 2022 (97.6% of all units):
| Burbank North Estates: | $1,448,356 |
| Burbank: | $1,253,446 |
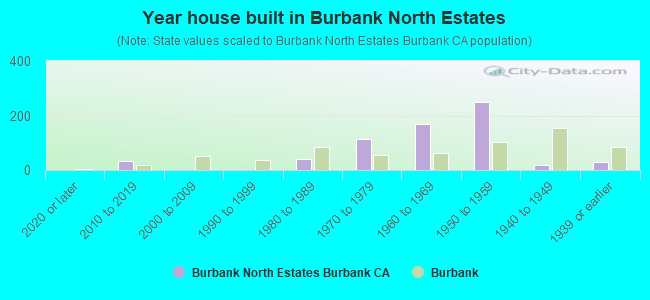
- Year house built in Burbank North Estates
- 02020 or later
- 332010 to 2019
- 02000 to 2009
- 11990 to 1999
- 401980 to 1989
- 1151970 to 1979
- 1681960 to 1969
- 2481950 to 1959
- 201940 to 1949
- 291939 or earlier
City-data.com crime index for city in 2020 (higher means more crime):
| City: | 164.4 |
| U.S. average: | 219.5 |
Travel time to work (commute)
![Travel time to work (commute)]()
- 2Less than 5 minutes
- 105 to 9 minutes
- 4710 to 14 minutes
- 8315 to 19 minutes
- 10120 to 24 minutes
- 1925 to 29 minutes
- 6730 to 34 minutes
- 1835 to 39 minutes
- 2140 to 44 minutes
- 6345 to 59 minutes
- 5960 to 89 minutes
- 290 or more minutes

Means of transportation to work
![Means of transportation to work]()
- 56.4%361Drove a car alone
- 4.4%28Carpooled
- 3.7%24Bus
- 5.6%36Long-distance train or commuter rail
- 2.5%16Bicycle
- 3.7%24Walked
- 0.3%2Other means
- 36.5%234Worked at home

Time leaving home to go to work
![Time leaving home to go to work]()
- 7312:00 a.m. to 4:59 a.m.
- 105:00 a.m. to 5:29 a.m.
- 435:30 a.m. to 5:59 a.m.
- 366:00 a.m. to 6:29 a.m.
- 136:30 a.m. to 6:59 a.m.
- 517:00 a.m. to 7:29 a.m.
- 837:30 a.m. to 7:59 a.m.
- 1208:00 a.m. to 8:29 a.m.
- 818:30 a.m. to 8:59 a.m.
- 419:00 a.m. to 9:59 a.m.
- 2010:00 a.m. to 10:59 a.m.
- 15711:00 a.m. to 11:59 a.m.
- 912:00 p.m. to 3:59 p.m.
- 294:00 p.m. to 11:59 p.m.

Occupations of males:
- Percentage of males in management occupations (except farmers):
Here: 27.5% city: 12.9%
- Percentage of males in business and financial operations occupations:
Here: 9.0% city: 6.1%
- Percentage of males in architecture and engineering occupations:
Here: 9.6% city: 3.3%
- Percentage of males in legal occupations:
Here: 19.4% city: 1.7%
- Percentage of males in arts, design, entertainment, sports, and media occupations:
Here: 1.6% city: 18.9%
- Percentage of males in healthcare practitioners and technical occupations:
Here: 2.4% city: 3.0%
- Percentage of males in service occupations:
Here: 12.9% city: 11.2%
- Percentage of males in sales and office occupations:
Here: 10.0% city: 14.1%
- Percentage of males in production occupations:
Here: 1.2% city: 4.8%
- Percentage of males in transportation occupations:
Here: 5.9% city: 4.5%
Occupations of females:
- Percentage of females in management occupations (except farmers):
Here: 9.4% city: 13.3%
- Percentage of females in business and financial operations occupations:
Here: 42.0% city: 8.3%
- Percentage of females in computer and mathematical occupations:
Here: 5.8% city: 1.8%
- Percentage of females in community and social services occupations:
Here: 3.1% city: 2.2%
- Percentage of females in education, training, and library occupations:
Here: 12.2% city: 7.5%
- Percentage of females in arts, design, entertainment, sports, and media occupations:
Here: 5.4% city: 11.3%
- Percentage of females in healthcare practitioners and technical occupations:
Here: 5.1% city: 7.1%
- Percentage of females in service occupations:
Here: 7.6% city: 17.4%
- Percentage of females in sales and office occupations:
Here: 5.2% city: 24.6%
- Percentage of females in production occupations:
Here: 3.3% city: 1.7%
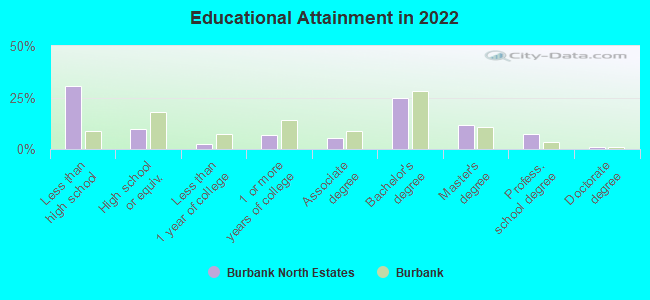
Education in this neighborhood (subdivision or community):
- Percentage of people 3 years and older in K-12 schools:
Burbank North Estates: 22.7% Burbank: 13.3%
- Percentage of people 3 years and older in undergraduate colleges:
Burbank North Estates: 1.5% Burbank: 5.8%
- Percentage of people 3 years and older in grad. or professional schools:
Burbank North Estates: 7.2% Burbank: 2.1%
- Percentage of students K-12 enrolled in private schools:
Burbank North Estates: 48.8% Burbank: 10.0%
Percentage of population below poverty level:
| Burbank North Estates: | 11.3% |
| Burbank: | 9.5% |
Median year owner moved in (as recorded in 2022):
| Burbank North Estates: | 1999 |
| Burbank: | 2005 |
Percentage of married-couple families with both working:
| Burbank North Estates: | 120.0% |
| Burbank: | 68.2% |
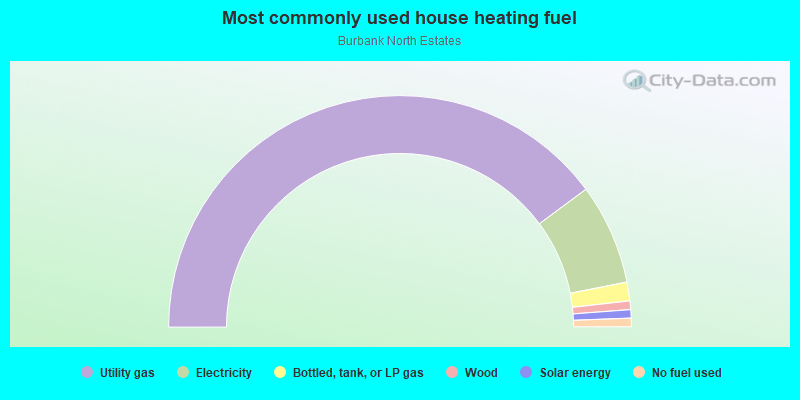
- 79.8%Utility gas
- 14.1%Electricity
- 2.6%Bottled, tank, or LP gas
- 1.2%Wood
- 1.2%Solar energy
- 1.2%No fuel used
Roads and streets:
N Lamer St
Length: 1.14 miles
Directions: E-W, N-S, SE-NW, SW-NE
Address range: 2600 to 3399
Directions: E-W, N-S, SE-NW, SW-NE
Address range: 2600 to 3399
Haven Way
Length: 1.10 miles
Directions: E-W, N-S, SE-NW, SW-NE
Address range: 2600 to 3699
Directions: E-W, N-S, SE-NW, SW-NE
Address range: 2600 to 3699
N Kenneth Rd
Length: 0.64 miles
Directions: E-W, SE-NW
Address range: 2400 to 2999
Directions: E-W, SE-NW
Address range: 2400 to 2999
Joaquin Dr
Length: 0.56 miles
Directions: E-W, N-S, SE-NW, SW-NE
Address range: 2600 to 3099
Directions: E-W, N-S, SE-NW, SW-NE
Address range: 2600 to 3099
Viewcrest Dr
Length: 0.51 miles
Directions: E-W, N-S, SW-NE
Address range: 3300 to 3699
Directions: E-W, N-S, SW-NE
Address range: 3300 to 3699
Brace Canyon Rd
Length: 0.48 miles
Directions: E-W, N-S, SW-NE
Address range: 2900 to 3499
Directions: E-W, N-S, SW-NE
Address range: 2900 to 3499
Scott Rd
Length: 0.34 miles
Directions: E-W, N-S, SE-NW
Address range: 3000 to 3298
Directions: E-W, N-S, SE-NW
Address range: 3000 to 3298
Irving Dr
Length: 0.22 miles
Directions: N-S, SW-NE
Address range: 800 to 999
Directions: N-S, SW-NE
Address range: 800 to 999
N Parish Pl
Length: 0.20 miles
Directions: N-S, SE-NW
Address range: 2600 to 2799
Directions: N-S, SE-NW
Address range: 2600 to 2799
Crest Ridge Dr
Length: 0.19 miles
Directions: E-W, N-S, SE-NW
Address range: 2900 to 2999
Directions: E-W, N-S, SE-NW
Address range: 2900 to 2999
Rolling Ridge Dr
Length: 0.18 miles
Directions: N-S, SE-NW
Address range: 2900 to 3099
Directions: N-S, SE-NW
Address range: 2900 to 3099
Mesa Verde Dr
Length: 0.16 miles
Direction: E-W
Address range: 3000 to 3199
Direction: E-W
Address range: 3000 to 3199
Brown Dr
Length: 0.15 miles
Directions: E-W, SW-NE
Address range: 800 to 899
Directions: E-W, SW-NE
Address range: 800 to 899
Kingsway Dr
Length: 0.14 miles
Directions: SE-NW, SW-NE
Address range: 800 to 2799
Directions: SE-NW, SW-NE
Address range: 800 to 2799
Amigos Dr
Length: 0.14 miles
Direction: SE-NW
Address range: 3000 to 3199
Direction: SE-NW
Address range: 3000 to 3199
Remy Pl
Length: 0.13 miles
Directions: E-W, N-S, SE-NW
Address range: 2900 to 2999
Directions: E-W, N-S, SE-NW
Address range: 2900 to 2999
Mystic View Pl
Length: 0.13 miles
Directions: E-W, N-S, SE-NW
Address range: 2900 to 2999
Directions: E-W, N-S, SE-NW
Address range: 2900 to 2999
Olney Pl
Length: 0.13 miles
Direction: SE-NW
Address range: 2900 to 2999
Direction: SE-NW
Address range: 2900 to 2999
Jolley Dr
Length: 0.13 miles
Directions: E-W, SE-NW
Address range: 3100 to 3199
Directions: E-W, SE-NW
Address range: 3100 to 3199
Adornos Way
Length: 0.13 miles
Directions: N-S, SW-NE
Address range: 3000 to 3099
Directions: N-S, SW-NE
Address range: 3000 to 3099
Highland View Dr
Length: 0.11 miles
Direction: E-W
Address range: 3100 to 3199
Direction: E-W
Address range: 3100 to 3199
Woodstock Ln
Length: 0.09 miles
Direction: SE-NW
Address range: 2600 to 2699
Direction: SE-NW
Address range: 2600 to 2699
Mansfield Dr
Length: 0.08 miles
Directions: N-S, SE-NW
Address range: 2800 to 2899
Directions: N-S, SE-NW
Address range: 2800 to 2899
Antigua Dr
Length: 0.07 miles
Directions: E-W, N-S, SE-NW
Address range: 2800 to 2899
Directions: E-W, N-S, SE-NW
Address range: 2800 to 2899
Reynolds Dr
Length: 0.06 miles
Directions: N-S, SW-NE
Directions: N-S, SW-NE
Harold Cir
Length: 0.04 miles
Direction: E-W
Direction: E-W
Whitney Ln
Length: 0.04 miles
Direction: SW-NE
Address range: 3200 to 3299
Direction: SW-NE
Address range: 3200 to 3299
Purvis Dr
Length: 0.03 miles
Direction: N-S
Address range: 2500 to 2599
Direction: N-S
Address range: 2500 to 2599
Howard Ct
Length: 0.03 miles
Direction: SE-NW
Address range: 2600 to 3699
Direction: SE-NW
Address range: 2600 to 3699