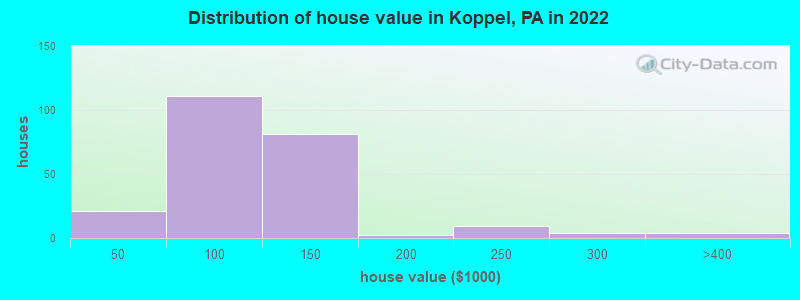
Estimated median house or condo value in 2022: $95,832 (it was $54,200 in 2000)
Koppel:
$95,832
PA:
$245,500
Mean prices in 2022:all housing units: $215,749; detached houses: $222,667; townhouses or other attached units: $237,132; in 2-unit structures: $110,714; in 3-to-4-unit structures: $213,239; in 5-or-more-unit structures: $101,003; mobile homes: $64,283
Median gross rent in 2022: $1,000.
March 2022 cost of living index in Koppel: 89.4 (less than average, U.S. average is 100)
According to our research of Pennsylvania and other state lists, there was 1 registered sex offender living in Koppel, Pennsylvania as of May 23, 2024. The ratio of all residents to sex offenders in Koppel is 714 to 1. The ratio of registered sex offenders to all residents in this city is near the state average.
Crime rates in Koppel by year
Type
2009
2010
2011
2012
2013
2014
2015
2016
2017
2018
2019
2020
Murders (per 100,000)
0 (0.0)
0 (0.0)
0 (0.0)
0 (0.0)
0 (0.0)
0 (0.0)
0 (0.0)
0 (0.0)
0 (0.0)
0 (0.0)
0 (0.0)
0 (0.0)
Rapes (per 100,000)
0 (0.0)
0 (0.0)
1 (130.9)
0 (0.0)
0 (0.0)
0 (0.0)
0 (0.0)
0 (0.0)
0 (0.0)
1 (138.3)
1 (140.3)
0 (0.0)
Robberies (per 100,000)
1 (130.5)
0 (0.0)
0 (0.0)
1 (131.2)
0 (0.0)
0 (0.0)
0 (0.0)
0 (0.0)
0 (0.0)
0 (0.0)
1 (140.3)
1 (139.5)
Assaults (per 100,000)
1 (130.5)
0 (0.0)
4 (523.6)
5 (656.2)
5 (663.1)
7 (929.6)
3 (403.8)
0 (0.0)
3 (409.8)
3 (414.9)
3 (420.8)
1 (139.5)
Burglaries (per 100,000)
7 (913.8)
1 (131.2)
12 (1,571)
6 (787.4)
3 (397.9)
2 (265.6)
0 (0.0)
3 (406.0)
0 (0.0)
0 (0.0)
1 (140.3)
3 (418.4)
Thefts (per 100,000)
20 (2,611)
5 (656.2)
12 (1,571)
21 (2,756)
17 (2,255)
22 (2,922)
15 (2,019)
11 (1,488)
8 (1,093)
3 (414.9)
0 (0.0)
6 (836.8)
Auto thefts (per 100,000)
1 (130.5)
0 (0.0)
3 (392.7)
2 (262.5)
3 (397.9)
0 (0.0)
3 (403.8)
2 (270.6)
1 (136.6)
0 (0.0)
1 (140.3)
1 (139.5)
Arson (per 100,000)
0 (0.0)
0 (0.0)
0 (0.0)
0 (0.0)
0 (0.0)
0 (0.0)
1 (134.6)
0 (0.0)
0 (0.0)
0 (0.0)
0 (0.0)
0 (0.0)
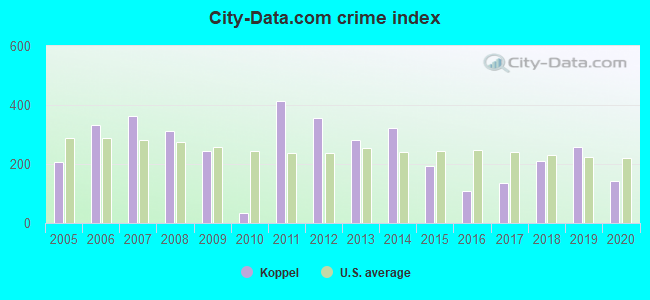
City-Data.com crime index
244.1
35.4
413.6
357.0
282.5
321.4
193.8
109.6
136.6
210.2
259.5
143.7
The City-Data.com crime index weighs serious crimes and violent crimes more heavily. Higher means more crime, U.S. average is 246.1. It adjusts for the number of visitors and daily workers commuting into cities.
Latest news from Koppel, PA collected exclusively by city-data.com from local newspapers, TV, and radio stations
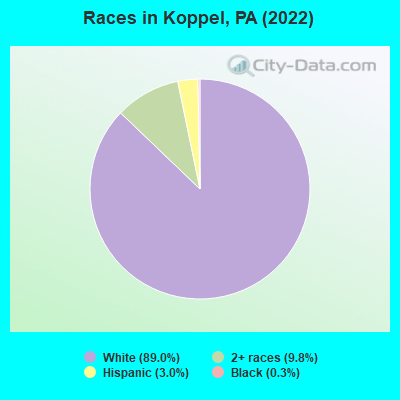
Ancestries: Italian (30.3%), German (25.1%), Polish (8.2%), English (7.5%), Scandinavian (4.9%), American (3.7%).
Current Local Time: EST time zone
Incorporated on since 1910
Elevation: 960 feet
Land area: 0.53 square miles.
Population density: 1,322 people per square mile (low).
10 residents are foreign born
This borough:
1.2%
Pennsylvania:
4.1%
Median real estate property taxes paid for housing units with mortgages in 2022: $2,178 (2.2%) Median real estate property taxes paid for housing units with no mortgage in 2022: $1,423 (1.5%)
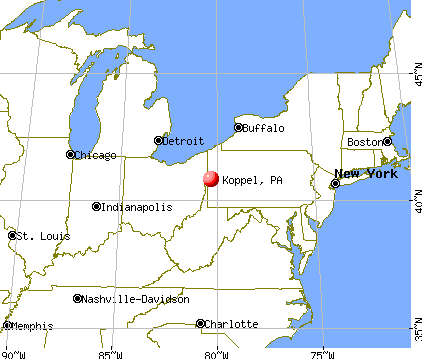
Nearest city with pop. 50,000+: Youngstown, OH (24.9 miles , pop. 82,026).
Nearest city with pop. 200,000+: Pittsburgh, PA (32.6 miles , pop. 334,563).
Nearest city with pop. 1,000,000+: Philadelphia, PA (278.7 miles , pop. 1,517,550).
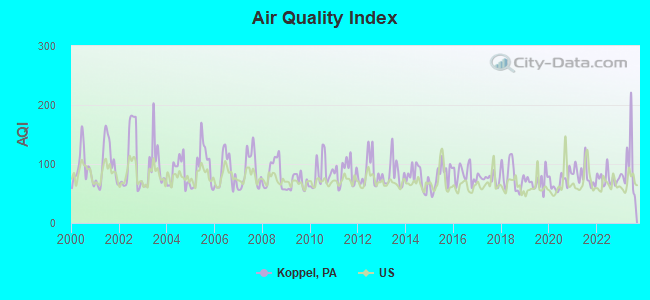
Air Quality Index (AQI) level in 2023 was 96.2. This is worse than average.
City:
96.2
U.S.:
72.6
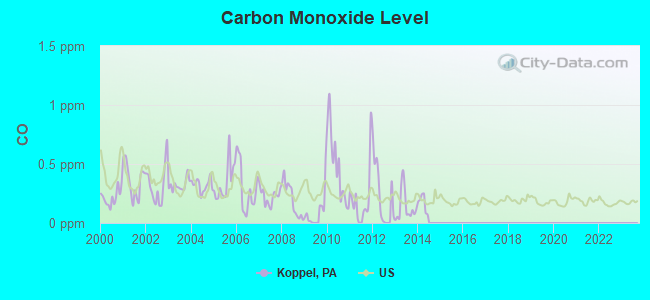
Carbon Monoxide (CO) [ppm] level in 2013 was 0.139. This is significantly better than average.Closest monitor was 5.9 miles away from the city center.
City:
0.139
U.S.:
0.251
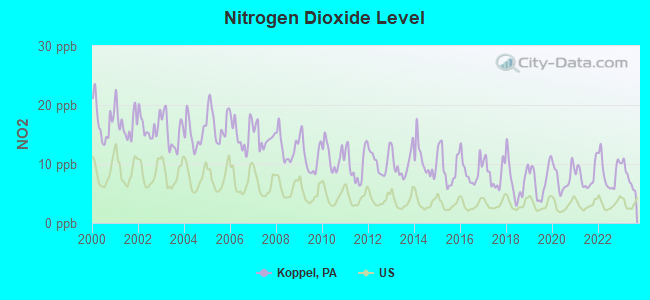
Nitrogen Dioxide (NO2) [ppb] level in 2023 was 7.85. This is significantly worse than average.Closest monitor was 5.9 miles away from the city center.
City:
7.85
U.S.:
5.11
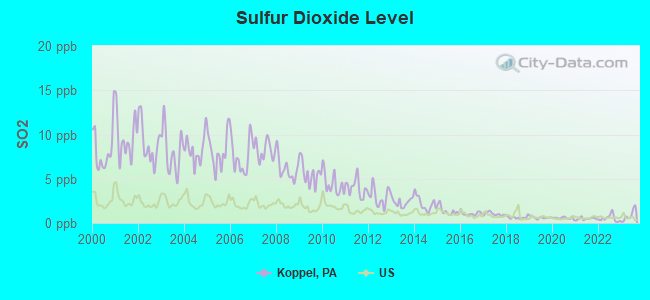
Sulfur Dioxide (SO2) [ppb] level in 2023 was 0.840. This is significantly better than average.Closest monitor was 5.9 miles away from the city center.
City:
0.840
U.S.:
1.515
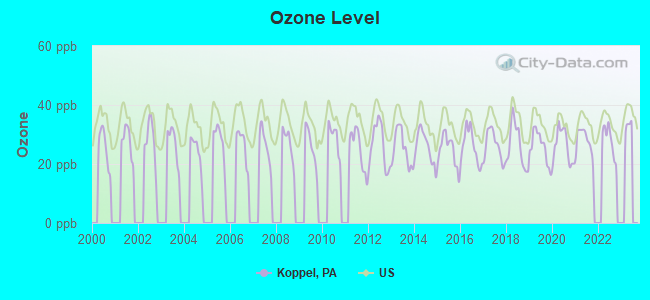
Ozone [ppb] level in 2022 was 28.1. This is about average.Closest monitor was 5.9 miles away from the city center.
City:
28.1
U.S.:
33.3
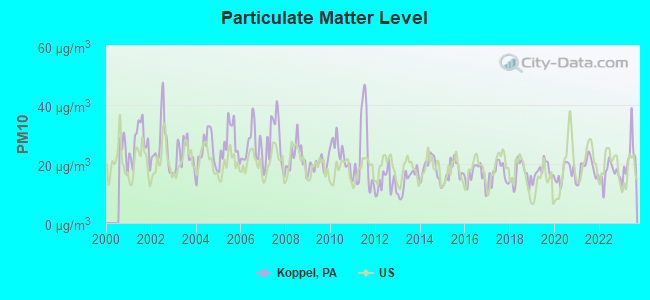
Particulate Matter (PM10) [µg/m3] level in 2023 was 22.2. This is about average.Closest monitor was 4.7 miles away from the city center.
City:
22.2
U.S.:
19.2
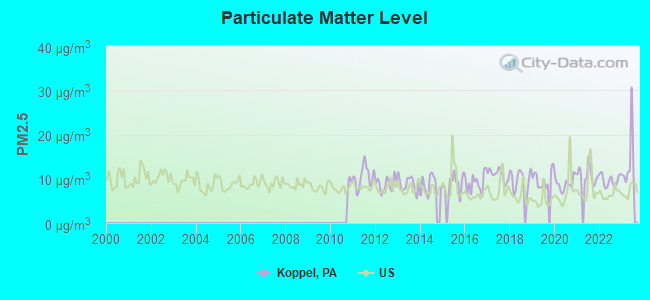
Particulate Matter (PM2.5) [µg/m3] level in 2023 was 13.7. This is significantly worse than average.Closest monitor was 5.9 miles away from the city center.
City:
13.7
U.S.:
8.1
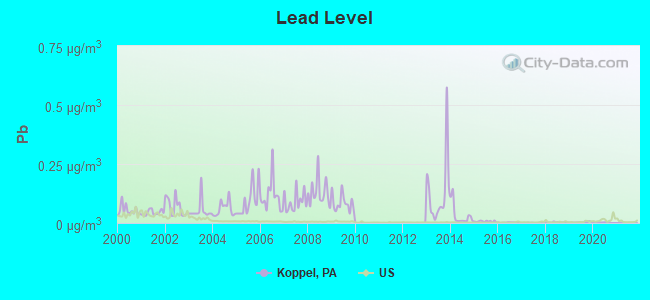
Lead (Pb) [µg/m3] level in 2020 was 0.00256. This is significantly better than average.Closest monitor was 2.5 miles away from the city center.
City:
0.00256
U.S.:
0.00931
Tornado activity:
Koppel-area historical tornado activity is slightly above Pennsylvania state average. It is 1% smaller than the overall U.S. average.
On 5/31/1985, a category F5 (max. wind speeds 261-318 mph) tornado 26.9 miles away from the Koppel borough center killed 18 peopleand injured 310 peopleand causedbetween $50,000,000 and $500,000,000 in damages.
On 5/31/1985, a category F3 (max. wind speeds 158-206 mph) tornado 7.7 miles away from the borough center killed 9 peopleand injured 120 peopleand causedbetween $5,000,000 and $50,000,000 in damages.
Earthquake activity:
Koppel-area historical earthquake activity is significantly above Pennsylvania state average. It is 55% smaller than the overall U.S. average.
On 9/25/1998 at 19:52:52, a magnitude 5.2 (4.8 MB, 4.3 MS, 5.2 LG, 4.5 MW, Depth: 3.1 mi, Class: Moderate, Intensity: VI - VII) earthquake occurred 45.6 miles away from the city center On 1/31/1986 at 16:46:43, a magnitude 5.0 (5.0 MB) earthquake occurred 68.7 miles away from Koppel center On 8/23/2011 at 17:51:04, a magnitude 5.8 (5.8 MW, Depth: 3.7 mi) earthquake occurred 239.1 miles away from Koppel center On 7/27/1980 at 18:52:21, a magnitude 5.2 (5.1 MB, 4.7 MS, 5.0 UK, 5.2 UK) earthquake occurred 265.2 miles away from the city center On 12/31/2011 at 20:05:01, a magnitude 4.0 (4.0 ML, Depth: 3.1 mi, Class: Light, Intensity: IV - V) earthquake occurred 27.4 miles away from Koppel center On 6/10/2019 at 14:50:45, a magnitude 4.0 (4.0 MB, Depth: 1.2 mi) earthquake occurred 83.0 miles away from Koppel center Magnitude types: regional Lg-wave magnitude (LG), body-wave magnitude (MB), local magnitude (ML), surface-wave magnitude (MS), moment magnitude (MW)
Natural disasters:
The number of natural disasters in Beaver County (14) is near the US average (15). Major Disasters (Presidential) Declared: 10 Emergencies Declared: 4
Causes of natural disasters: Floods: 4, Storms: 4, Winter Storms: 3, Hurricanes: 2, Snowstorms: 2, Tornadoes: 2, Tropical Depressions: 2, Snowfall: 1, Tropical Storm: 1, Wind: 1, Other: 1 (Note: some incidents may be assigned to more than one category).
Hospitals and medical centers near Koppel:
BLAIR NURSING HOME INC (Nursing Home, about 3 miles away; BEAVER FALLS, PA)
ELLWOOD CITY HOSPITAL HHA (Home Health Center, about 4 miles away; ELLWOOD CITY, PA)
ELLWOOD CITY HOSPITAL Acute Care Hospitals (about 4 miles away; ELLWOOD CITY, PA)
MARY EVANS EXTENDED CARE CTR (Nursing Home, about 4 miles away; ELLWOOD CITY, PA)
FRESENIUS MEDICAL CARE ELLWOOD CITY (Dialysis Facility, about 5 miles away; ELLWOOD CITY, PA)
DCI OF BEAVER FALLS / CHIPPEWA (Dialysis Facility, about 5 miles away; BEAVER FALLS, PA)
LIBERTY DIALYSIS - CHIPPEWA (Dialysis Facility, about 6 miles away; BEAVER FALLS, PA)
Operable nuclear power plants near Koppel:
16 miles: Beaver Valley 1 and 2 in Shippingport, PA.
Colleges/universities with over 2000 students nearest to Koppel:
Slippery Rock University of Pennsylvania (about 22 miles; Slippery Rock, PA; Full-time enrollment: 8,424)
Butler County Community College (about 22 miles; Butler, PA; FT enrollment: 2,518)
Robert Morris University (about 23 miles; Moon Township, PA; FT enrollment: 4,823)
Youngstown State University (about 26 miles; Youngstown, OH; FT enrollment: 11,575)
Grove City College (about 26 miles; Grove City, PA; FT enrollment: 2,560)
Pittsburgh Technical Institute (about 30 miles; Oakdale, PA; FT enrollment: 2,805)
Community College of Allegheny County (about 31 miles; Pittsburgh, PA; FT enrollment: 13,486)
Beaver County has a predicted average indoor radon screening level greater than 4 pCi/L (pico curies per liter) - Highest Potential
Average household size:
This borough:
2.2 people
Pennsylvania:
2.5 people
Percentage of family households:
This borough:
56.2%
Whole state:
65.0%
Percentage of households with unmarried partners:
This borough:
7.4%
Whole state:
6.6%
Likely homosexual households (counted as self-reported same-sex unmarried-partner households)
Lesbian couples: 0.3% of all households
Gay men: 0.0% of all households
Banks with branches in Koppel (2011 data):
First National Bank of Pennsylvania: Koppel Branch at 5413 Fifth Ave, branch established on 1973/12/03. Info updated 2012/01/10: Bank assets: $9,581.0 mil, Deposits: $7,462.2 mil, headquarters in Greenville, PA, positive income, Commercial Lending Specialization, 291 total offices, Holding Company: F.N.b. Corporation
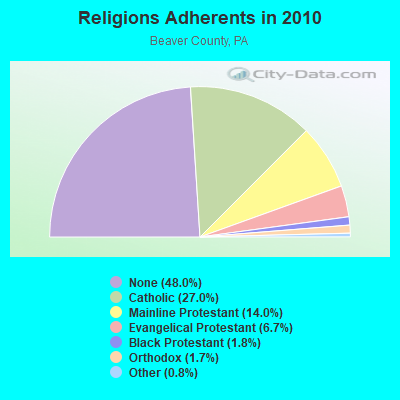
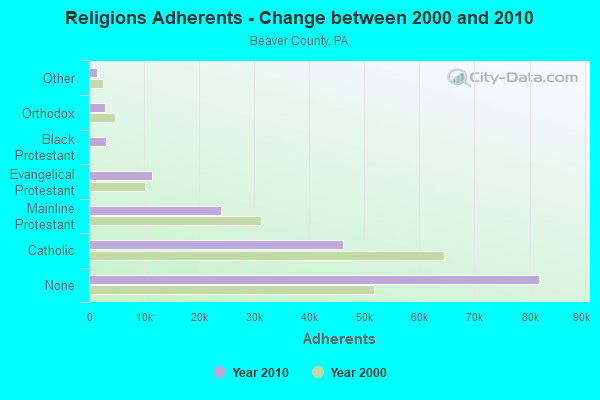
Religion statistics for Koppel, PA (based on Beaver County data)
Religion
Adherents
Congregations
Catholic
46,096
22
Mainline Protestant
23,930
86
Evangelical Protestant
11,390
92
Black Protestant
3,117
15
Orthodox
2,834
9
Other
1,367
8
None
81,805
-
Source: Clifford Grammich, Kirk Hadaway, Richard Houseal, Dale E.Jones, Alexei Krindatch, Richie Stanley and Richard H.Taylor. 2012. 2010 U.S.Religion Census: Religious Congregations & Membership Study. Association of Statisticians of American Religious Bodies. Jones, Dale E., et al. 2002. Congregations and Membership in the United States 2000. Nashville, TN: Glenmary Research Center. Graphs represent county-level data
Call Sign: WB3EPE, Licensee ID: L00174943, Grant Date: 08/30/1995, Expiration Date: 08/30/2005, Cancellation Date: 08/31/2007, Registrant: Robert E Blythe, 244 Mount St Box 235, Koppel, PA 16136
Call Sign: KB3EVQ, Licensee ID: L00232403, Grant Date: 04/25/2000, Expiration Date: 04/25/2010, Cancellation Date: 08/31/2002, Certifier: William D Quick, Registrant: William D Quick, 2424 Second Ave, Koppel, PA 16136
Call Sign: KB3UAJ, Licensee ID: L01549547, Grant Date: 02/23/2010, Expiration Date: 02/23/2020, Cancellation Date: 02/24/2022, Certifier: Jack N Sanner Jr, Registrant: Jack N Sanner Jr, Koppel, PA 16136
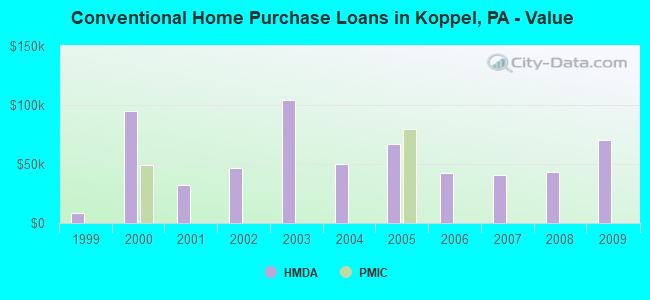
Home Mortgage Disclosure Act Aggregated Statistics For Year 2009 (Based on 1 full tract)
A) FHA, FSA/RHS & VA Home Purchase Loans
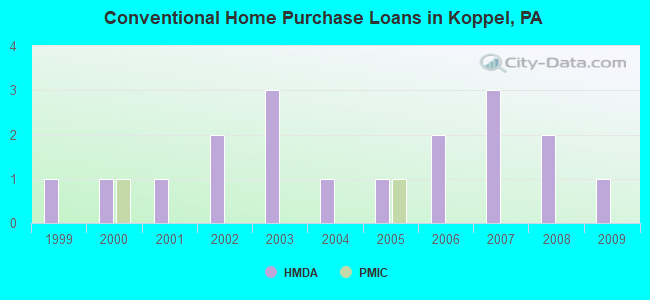
B) Conventional Home Purchase Loans
C) Refinancings
F) Non-occupant Loans on < 5 Family Dwellings (A B C & D)
Number
Average Value
Number
Average Value
Number
Average Value
Number
Average Value
LOANS ORIGINATED
2
$71,000
1
$70,000
4
$42,000
1
$56,000
APPLICATIONS APPROVED, NOT ACCEPTED
0
$0
0
$0
0
$0
0
$0
APPLICATIONS DENIED
0
$0
0
$0
1
$60,000
0
$0
APPLICATIONS WITHDRAWN
0
$0
0
$0
2
$34,000
1
$53,000
FILES CLOSED FOR INCOMPLETENESS
0
$0
0
$0
0
$0
0
$0
Aggregated Statistics For Year 2008 (Based on 1 full tract)
B) Conventional Home Purchase Loans
C) Refinancings
D) Home Improvement Loans
Number
Average Value
Number
Average Value
Number
Average Value
LOANS ORIGINATED
2
$43,000
2
$78,000
1
$22,000
APPLICATIONS APPROVED, NOT ACCEPTED
0
$0
0
$0
0
$0
APPLICATIONS DENIED
0
$0
1
$70,000
0
$0
APPLICATIONS WITHDRAWN
0
$0
0
$0
0
$0
FILES CLOSED FOR INCOMPLETENESS
0
$0
0
$0
0
$0
Aggregated Statistics For Year 2007 (Based on 1 full tract)
A) FHA, FSA/RHS & VA Home Purchase Loans
B) Conventional Home Purchase Loans
C) Refinancings
D) Home Improvement Loans
F) Non-occupant Loans on < 5 Family Dwellings (A B C & D)
G) Loans On Manufactured Home Dwelling (A B C & D)
Number
Average Value
Number
Average Value
Number
Average Value
Number
Average Value
Number
Average Value
Number
Average Value
LOANS ORIGINATED
1
$63,000
3
$40,667
1
$40,000
0
$0
1
$40,000
0
$0
APPLICATIONS APPROVED, NOT ACCEPTED
0
$0
1
$72,000
1
$47,000
0
$0
0
$0
0
$0
APPLICATIONS DENIED
1
$95,000
4
$51,750
4
$78,250
3
$10,667
0
$0
1
$17,000
APPLICATIONS WITHDRAWN
0
$0
1
$72,000
0
$0
0
$0
0
$0
0
$0
FILES CLOSED FOR INCOMPLETENESS
0
$0
0
$0
0
$0
0
$0
0
$0
0
$0
Aggregated Statistics For Year 2006 (Based on 1 full tract)
A) FHA, FSA/RHS & VA Home Purchase Loans
B) Conventional Home Purchase Loans
C) Refinancings
D) Home Improvement Loans
F) Non-occupant Loans on < 5 Family Dwellings (A B C & D)
G) Loans On Manufactured Home Dwelling (A B C & D)
Number
Average Value
Number
Average Value
Number
Average Value
Number
Average Value
Number
Average Value
Number
Average Value
LOANS ORIGINATED
1
$59,000
2
$42,500
6
$36,667
2
$23,000
2
$23,000
1
$32,000
APPLICATIONS APPROVED, NOT ACCEPTED
0
$0
0
$0
2
$20,000
0
$0
0
$0
0
$0
APPLICATIONS DENIED
0
$0
1
$29,000
1
$112,000
1
$58,000
0
$0
0
$0
APPLICATIONS WITHDRAWN
0
$0
0
$0
0
$0
0
$0
0
$0
0
$0
FILES CLOSED FOR INCOMPLETENESS
0
$0
0
$0
0
$0
0
$0
0
$0
0
$0
Aggregated Statistics For Year 2005 (Based on 1 full tract)
B) Conventional Home Purchase Loans
C) Refinancings
D) Home Improvement Loans
F) Non-occupant Loans on < 5 Family Dwellings (A B C & D)
Number
Average Value
Number
Average Value
Number
Average Value
Number
Average Value
LOANS ORIGINATED
1
$67,000
2
$75,500
1
$5,000
0
$0
APPLICATIONS APPROVED, NOT ACCEPTED
0
$0
1
$74,000
0
$0
0
$0
APPLICATIONS DENIED
0
$0
10
$73,800
1
$158,000
0
$0
APPLICATIONS WITHDRAWN
1
$68,000
2
$92,000
0
$0
1
$68,000
FILES CLOSED FOR INCOMPLETENESS
0
$0
0
$0
0
$0
0
$0
Aggregated Statistics For Year 2004 (Based on 1 full tract)
A) FHA, FSA/RHS & VA Home Purchase Loans
B) Conventional Home Purchase Loans
C) Refinancings
D) Home Improvement Loans
E) Loans on Dwellings For 5+ Families
F) Non-occupant Loans on < 5 Family Dwellings (A B C & D)
Number
Average Value
Number
Average Value
Number
Average Value
Number
Average Value
Number
Average Value
Number
Average Value
LOANS ORIGINATED
1
$48,000
1
$50,000
4
$73,750
2
$52,500
1
$1,092,000
3
$75,667
APPLICATIONS APPROVED, NOT ACCEPTED
0
$0
2
$27,500
0
$0
0
$0
0
$0
0
$0
APPLICATIONS DENIED
0
$0
0
$0
4
$97,750
1
$71,000
0
$0
1
$71,000
APPLICATIONS WITHDRAWN
0
$0
0
$0
1
$80,000
1
$52,000
0
$0
1
$52,000
FILES CLOSED FOR INCOMPLETENESS
0
$0
0
$0
2
$73,500
0
$0
0
$0
0
$0
Aggregated Statistics For Year 2003 (Based on 1 full tract)
B) Conventional Home Purchase Loans
C) Refinancings
D) Home Improvement Loans
Number
Average Value
Number
Average Value
Number
Average Value
LOANS ORIGINATED
3
$104,333
10
$63,500
0
$0
APPLICATIONS APPROVED, NOT ACCEPTED
0
$0
0
$0
0
$0
APPLICATIONS DENIED
1
$67,000
3
$81,667
1
$8,000
APPLICATIONS WITHDRAWN
2
$70,000
2
$82,000
1
$30,000
FILES CLOSED FOR INCOMPLETENESS
0
$0
0
$0
0
$0
Aggregated Statistics For Year 2002 (Based on 1 full tract)
B) Conventional Home Purchase Loans
C) Refinancings
D) Home Improvement Loans
F) Non-occupant Loans on < 5 Family Dwellings (A B C & D)
Number
Average Value
Number
Average Value
Number
Average Value
Number
Average Value
LOANS ORIGINATED
2
$47,000
3
$41,333
1
$39,000
1
$40,000
APPLICATIONS APPROVED, NOT ACCEPTED
0
$0
0
$0
0
$0
0
$0
APPLICATIONS DENIED
0
$0
3
$78,333
1
$29,000
0
$0
APPLICATIONS WITHDRAWN
0
$0
1
$90,000
0
$0
0
$0
FILES CLOSED FOR INCOMPLETENESS
0
$0
0
$0
0
$0
0
$0
Aggregated Statistics For Year 2001 (Based on 1 full tract)
B) Conventional Home Purchase Loans
C) Refinancings
D) Home Improvement Loans
Number
Average Value
Number
Average Value
Number
Average Value
LOANS ORIGINATED
1
$32,000
5
$62,800
0
$0
APPLICATIONS APPROVED, NOT ACCEPTED
0
$0
0
$0
2
$27,500
APPLICATIONS DENIED
0
$0
5
$55,200
1
$9,000
APPLICATIONS WITHDRAWN
1
$46,000
1
$68,000
0
$0
FILES CLOSED FOR INCOMPLETENESS
0
$0
0
$0
0
$0
Aggregated Statistics For Year 2000 (Based on 1 full tract)
A) FHA, FSA/RHS & VA Home Purchase Loans
B) Conventional Home Purchase Loans
C) Refinancings
D) Home Improvement Loans
F) Non-occupant Loans on < 5 Family Dwellings (A B C & D)
Number
Average Value
Number
Average Value
Number
Average Value
Number
Average Value
Number
Average Value
LOANS ORIGINATED
1
$53,000
1
$95,000
2
$74,000
4
$12,750
1
$88,000
APPLICATIONS APPROVED, NOT ACCEPTED
0
$0
0
$0
0
$0
1
$16,000
0
$0
APPLICATIONS DENIED
0
$0
0
$0
2
$42,000
4
$36,250
0
$0
APPLICATIONS WITHDRAWN
0
$0
0
$0
0
$0
0
$0
0
$0
FILES CLOSED FOR INCOMPLETENESS
0
$0
0
$0
0
$0
0
$0
0
$0
Aggregated Statistics For Year 1999 (Based on 1 full tract)
Detailed PMIC statistics for the following Tracts:6004.00
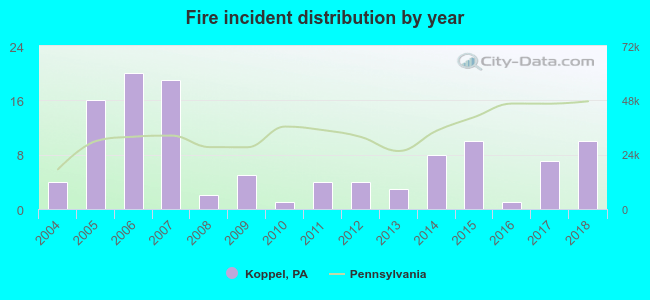
2004 - 2018 National Fire Incident Reporting System (NFIRS) incidents
Based on the data from the years 2004 - 2018 the average number of fire incidents per year is 8. The highest number of fire incidents - 20 took place in 2006, and the least - 1 in 2010. The data has an increasing trend.
When looking into fire subcategories, the most reports belonged to: Structure Fires (52.6%), and Mobile Property/Vehicle Fires (23.7%).
Fire incident types reported to NFIRS in Koppel, PA


 Recent articles from our blog. Our writers, many of them Ph.D. graduates or candidates, create easy-to-read articles on a wide variety of topics.

 (24.9 miles


 Based on the data from the years 2004 - 2018 the average number of fire incidents per year is 8. The highest number of fire incidents - 20 took place in 2006, and the least - 1 in 2010. The data has an increasing trend.
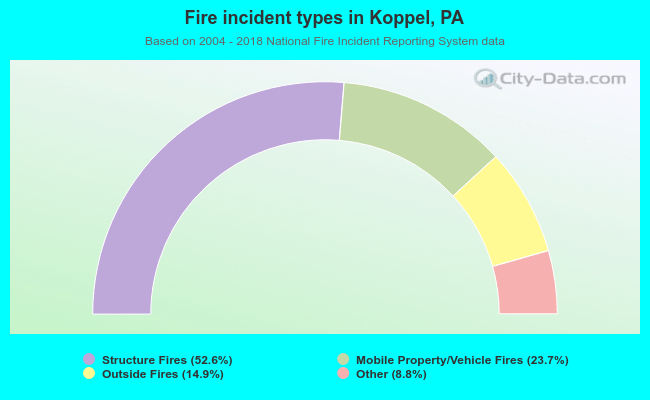 When looking into fire subcategories, the most reports belonged to: Structure Fires (52.6%), and Mobile Property/Vehicle Fires (23.7%).