Jupiter, Florida
Jupiter: Pasha the Golden Retriever in the golden sunrise trail
Jupiter: Jupiter's Sunrise
Jupiter: Golden Retriever body surfing at Jupiter Dog Beach
Jupiter: Blue Heron Blues - Two pelicans reviewing the men who "might" catch them dinner today
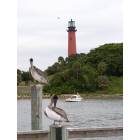
Jupiter: Jupiter Lighthouse
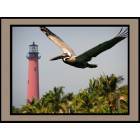
Jupiter: Jupiter Lighthouse
Jupiter: State Rd A1A Beach
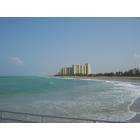
Jupiter: Beach front
Jupiter: Sunset at Jupiter, Florida
Jupiter: Sea Foam
Jupiter: Jupiter Beach
- see
30
more - add
your
Submit your own pictures of this town and show them to the world
- OSM Map
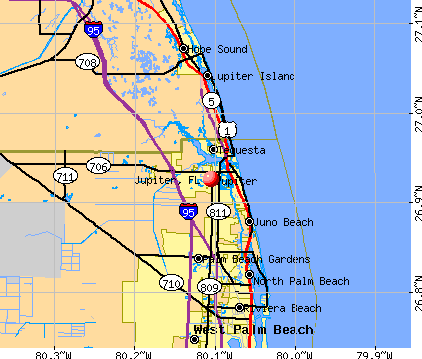
- General Map
- Google Map
- MSN Map
Population change since 2000: +55.4%
| Males: 30,168 | |
| Females: 30,958 |
| Median resident age: | 47.4 years |
| Florida median age: | 42.7 years |
Zip codes: 33418, 33458, 33469, 33478.
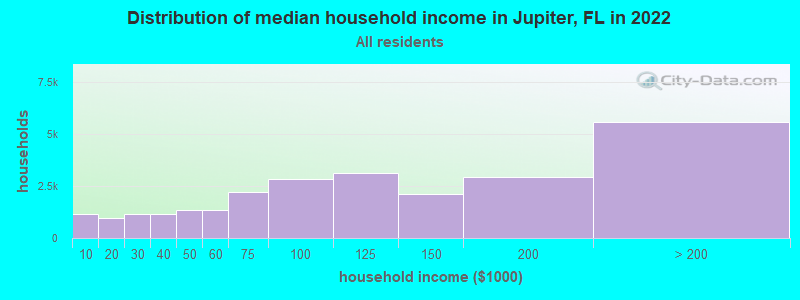
Jupiter Zip Code Map| Jupiter: | $106,142 |
| FL: | $69,303 |
Estimated per capita income in 2022: $70,370 (it was $35,088 in 2000)
Jupiter town income, earnings, and wages data
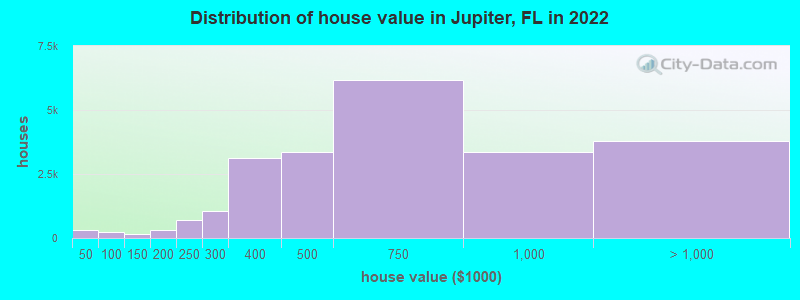
Estimated median house or condo value in 2022: $584,236 (it was $140,700 in 2000)
| Jupiter: | $584,236 |
| FL: | $354,100 |
Mean prices in 2022: all housing units: $839,927; detached houses: over $1,000,000; townhouses or other attached units: $495,489; in 2-unit structures: $954,533; in 3-to-4-unit structures: $429,935; in 5-or-more-unit structures: $514,926; mobile homes: $246,416
Median gross rent in 2022: $2,059.
(6.5% for White Non-Hispanic residents, 3.1% for Black residents, 17.2% for Hispanic or Latino residents, 12.2% for other race residents, 9.5% for two or more races residents)
Detailed information about poverty and poor residents in Jupiter, FL


Compare current foreclosures in Jupiter, FL:
| Photo | Address | Area | Beds / Baths | Price | Details |
|---|---|---|---|---|---|

|
#1
Felter St
Jupiter, FL 33458
|
1,352 sq. feet
|
2 baths 3 beds |
show details | |

|
#2
133rd Dr N
Jupiter, FL 33478
|
1,822 sq. feet
|
2 baths 3 beds |
show details | |

|
#3
Bay St
Jupiter, FL 33477
|
1,824 sq. feet
|
2 baths 2 beds |
show details | |

|
#4
W Community Dr
Jupiter, FL 33458
|
2,947 sq. feet
|
3 baths 5 beds |
show details | |

|
#5
7th St
Jupiter, FL 33458
|
1,008 sq. feet
|
1 baths 2 beds |
show details | |

|
#6
SE Bryant Dr
Jupiter, FL 33469
|
1,692 sq. feet
|
2 baths 3 beds |
show details | |

|
#7
Dania St
Jupiter, FL 33458
|
1,373 sq. feet
|
2 baths 4 beds |
show details | |

|
#8
Lakewood Dr Apt 12c
Jupiter, FL 33458
|
1,284 sq. feet
|
2 baths 2 beds |
show details | |

|
#9
128th Trl N
Jupiter, FL 33478
|
2,077 sq. feet
|
2 baths 4 beds |
show details | |

|
#10
Waterway Rd Apt 208
Jupiter, FL 33469
|
1,283 sq. feet
|
2 baths 2 beds |
show details |
| Photo | Address | Area | Beds / Baths | Price | Details |
|---|---|---|---|---|---|

|
#11
Owl Pointe Cir
Jupiter, FL 33458
|
1,990 sq. feet
|
2 baths 3 beds |
show details | |

|
#12
Ungerer St
Jupiter, FL 33458
|
1,942 sq. feet
|
2 baths 4 beds |
show details | |

|
#13
Lakewood Dr Apt 11c
Jupiter, FL 33458
|
1,314 sq. feet
|
2 baths 3 beds |
show details | |

|
#14
Center St Apt 30c
Jupiter, FL 33458
|
1,482 sq. feet
|
2 baths 2 beds |
show details | |

|
#15
N Cypress Dr Apt 6e
Jupiter, FL 33469
|
1,152 sq. feet
|
1 baths 2 beds |
show details | |

|
#16
Windsor Rd W
Jupiter, FL 33469
|
1,324 sq. feet
|
2 baths 4 beds |
show details | |

|
#17
150th Ct N
Jupiter, FL 33478
|
1,972 sq. feet
|
2 baths 5 beds |
show details | |

|
#18
Laurel Oaks Way
Jupiter, FL 33458
|
1,400 sq. feet
|
2 baths 3 beds |
show details | |

|
#19
Frederick Small Rd
Jupiter, FL 33458
|
1,310 sq. feet
|
2 baths 3 beds |
show details | |

|
#20
Palmetto Ct
Jupiter, FL 33458
|
1,049 sq. feet
|
2 baths 2 beds |
show details |
| Photo | Address | Area | Beds / Baths | Price | Details |
|---|---|---|---|---|---|

|
#21
Splitrail Cir
Jupiter, FL 33469
|
1,821 sq. feet
|
2 baths 3 beds |
show details | |

|
#22
Riverwalk Ln Unit 2
Jupiter, FL 33458
|
1,630 sq. feet
|
2 baths 3 beds |
show details | |

|
#23
Ridge Rd
Jupiter, FL 33477
|
1,889 sq. feet
|
2 baths 3 beds |
show details | |

|
#24
Sweet Bay Cir
Jupiter, FL 33458
|
1,962 sq. feet
|
2 baths 3 beds |
show details | |

|
#25
Chapel Ct
Jupiter, FL 33469
|
1,856 sq. feet
|
2 baths 3 beds |
show details | |

|
#26
Center St Apt 4d
Jupiter, FL 33458
|
1,482 sq. feet
|
2 baths 2 beds |
show details | |

|
#27
SE Deerberry Pl
Jupiter, FL 33469
|
1,825 sq. feet
|
2 baths 3 beds |
show details | |

|
#28
96th St N
Jupiter, FL 33478
|
1,800 sq. feet
|
2 baths 3 beds |
show details | |

|
#29
Seagrape Dr Apt 108
Jupiter, FL 33458
|
2,062 sq. feet
|
2 baths 3 beds |
show details | |

|
#30
SE Island Dr
Jupiter, FL 33469
|
3,018 sq. feet
|
3 baths 4 beds |
show details |
| Photo | Address | Area | Beds / Baths | Price | Details |
|---|---|---|---|---|---|

|
#31
164th Ct N
Jupiter, FL 33478
|
2,609 sq. feet
|
3 baths 4 beds |
show details | |

|
#32
24th Ct
Jupiter, FL 33477
|
1,236 sq. feet
|
2 baths 2 beds |
show details | |

|
#33
Locustberry Ln Apt 107
Jupiter, FL 33458
|
2,068 sq. feet
|
2 baths 3 beds |
show details | |

|
#34
Pawnee St
Jupiter, FL 33458
|
1,232 sq. feet
|
2 baths 3 beds |
show details | |

|
#35
175th Rd N
Jupiter, FL 33478
|
576 sq. feet
|
3 baths 4 beds |
show details | |

|
#36
Riverwalk Ln Unit 5
Jupiter, FL 33458
|
1,300 sq. feet
|
2 baths 2 beds |
show details | |

|
#37
Foster St
Jupiter, FL 33458
|
1,780 sq. feet
|
2 baths 3 beds |
show details | |

|
#38
Heights Blvd
Jupiter, FL 33458
|
2,329 sq. feet
|
3 baths - beds |
show details | |

|
#39
SE Federal Hwy
Jupiter, FL 33469
|
5,701 sq. feet
|
4 baths - beds |
show details | |

|
#40
Village Cir
Jupiter, FL 33458
|
1,792 sq. feet
|
2 baths - beds |
show details |
| Photo | Address | Area | Beds / Baths | Price | Details |
|---|---|---|---|---|---|

|
#41
Washington Way
Jupiter, FL 33458
|
1,218 sq. feet
|
2 baths - beds |
show details | |

|
#42
Set N Sun Pl
Jupiter, FL 33458
|
1,995 sq. feet
|
2 baths - beds |
show details | |

|
#43
171st Ln N
Jupiter, FL 33478
|
2,554 sq. feet
|
2 baths - beds |
show details | |

|
#44
91st Ter N
Jupiter, FL 33478
|
1,182 sq. feet
|
1 baths - beds |
show details | |

|
#45
Foster St
Jupiter, FL 33458
|
1,714 sq. feet
|
2 baths - beds |
show details | |

|
#46
Brookstone Ct
Jupiter, FL 33458
|
1,152 sq. feet
|
1 baths - beds |
show details | |

|
#47
Greentree Cir
Jupiter, FL 33458
|
1,190 sq. feet
|
2 baths - beds |
show details | |

|
#48
Mallards Cove Rd Apt 46g
Jupiter, FL 33458
|
- sq. feet
|
- baths - beds |
show details | |

|
#49
S Us Highway 1 Apt 17b
Jupiter, FL 33477
|
- sq. feet
|
- baths - beds |
show details | |

|
Check over 1 million property listings on Foreclosure.com!
|
browse all offers | |||


- 46,08674.5%White alone
- 10,26616.6%Hispanic
- 2,6774.3%Two or more races
- 1,0511.7%Asian alone
- 7561.2%Black alone
- 3260.5%Other race alone
- 1500.2%American Indian alone
- 440.07%Native Hawaiian and Other
Pacific Islander alone
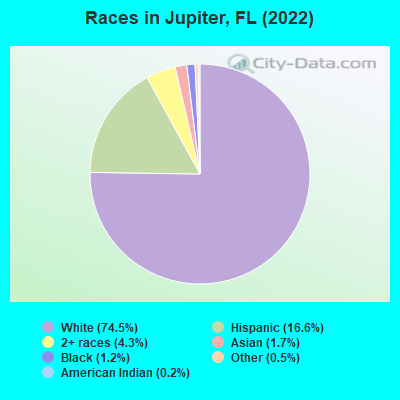
Races in Jupiter detailed stats: ancestries, foreign born residents, place of birth
According to our research of Florida and other state lists, there were 17 registered sex offenders living in Jupiter, Florida as of May 23, 2024.
The ratio of all residents to sex offenders in Jupiter is 3,679 to 1.
The ratio of registered sex offenders to all residents in this city is much lower than the state average.
The City-Data.com crime index weighs serious crimes and violent crimes more heavily. Higher means more crime, U.S. average is 246.1. It adjusts for the number of visitors and daily workers commuting into cities.
- means the value is smaller than the state average.- means the value is about the same as the state average.
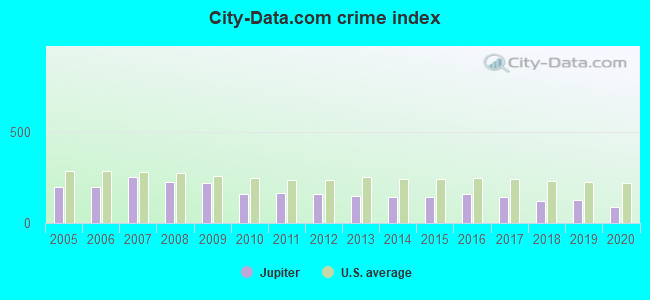
Crime rate in Jupiter detailed stats: murders, rapes, robberies, assaults, burglaries, thefts, arson
Full-time law enforcement employees in 2021, including police officers: 140 (114 officers - 97 male; 17 female).
| Officers per 1,000 residents here: | 1.70 |
| Florida average: | 2.33 |
 Recent articles from our blog. Our writers, many of them Ph.D. graduates or candidates, create easy-to-read articles on a wide variety of topics.


Latest news from Jupiter, FL collected exclusively by city-data.com from local newspapers, TV, and radio stations
Ancestries: Italian (10.9%), American (9.8%), Irish (9.8%), German (6.7%), English (6.5%), European (3.4%).
Current Local Time: EST time zone
Elevation: 8 feet
Land area: 20.0 square miles.
Population density: 3,057 people per square mile (average).
9,396 residents are foreign born (8.9% Latin America, 3.2% Europe, 1.5% Asia).
| This town: | 15.2% |
| Florida: | 21.1% |
Median real estate property taxes paid for housing units with mortgages in 2022: $4,938 (0.8%)
Median real estate property taxes paid for housing units with no mortgage in 2022: $4,722 (0.8%)
Nearest city with pop. 50,000+: Royal Palm Beach-West Jupiter, FL (13.3 miles  , pop. 74,157).
Nearest city with pop. 200,000+: Hialeah, FL (74.6 miles , pop. 226,419).
Nearest city with pop. 1,000,000+: Philadelphia, PA (947.9 miles , pop. 1,517,550).
Nearest cities:
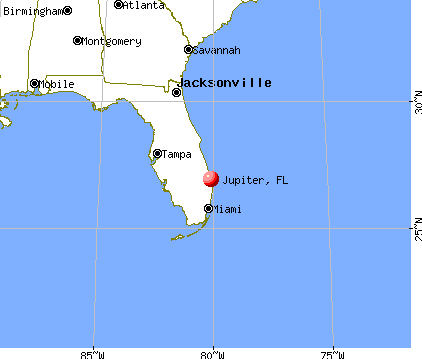
), ), ), ), )Latitude: 26.93 N, Longitude: 80.10 W
Daytime population change due to commuting: +6,521 (+10.5%)
Workers who live and work in this town: 13,654 (44.7%)
Area code: 561
Property values in Jupiter, FL

Jupiter tourist attractions:
Jupiter, Florida accommodation & food services, waste management - Economy and Business Data
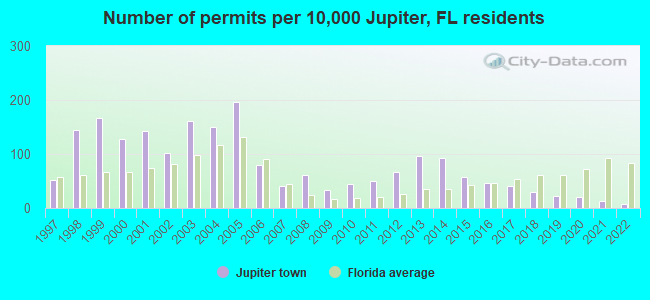
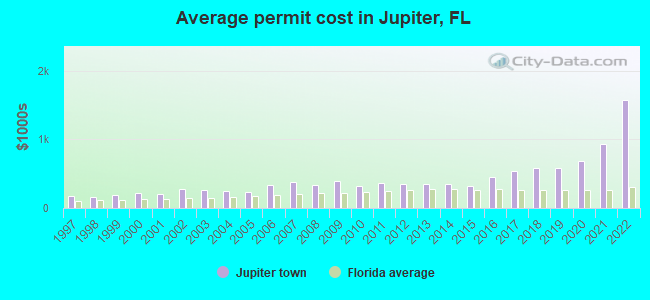
Single-family new house construction building permits:
- 2022: 33 buildings, average cost: $1,576,900
- 2021: 50 buildings, average cost: $939,500
- 2020: 80 buildings, average cost: $686,200
- 2019: 86 buildings, average cost: $579,400
- 2018: 114 buildings, average cost: $582,500
- 2017: 157 buildings, average cost: $534,900
- 2016: 185 buildings, average cost: $451,200
- 2015: 223 buildings, average cost: $320,000
- 2014: 364 buildings, average cost: $352,300
- 2013: 378 buildings, average cost: $346,800
- 2012: 262 buildings, average cost: $344,800
- 2011: 196 buildings, average cost: $358,400
- 2010: 176 buildings, average cost: $320,000
- 2009: 134 buildings, average cost: $387,200
- 2008: 245 buildings, average cost: $336,900
- 2007: 162 buildings, average cost: $375,300
- 2006: 313 buildings, average cost: $333,500
- 2005: 772 buildings, average cost: $230,400
- 2004: 591 buildings, average cost: $241,900
- 2003: 634 buildings, average cost: $263,100
- 2002: 397 buildings, average cost: $276,300
- 2001: 560 buildings, average cost: $201,700
- 2000: 503 buildings, average cost: $221,200
- 1999: 653 buildings, average cost: $189,600
- 1998: 566 buildings, average cost: $156,300
- 1997: 201 buildings, average cost: $171,200
| Here: | 2.5% |
| Florida: | 2.9% |
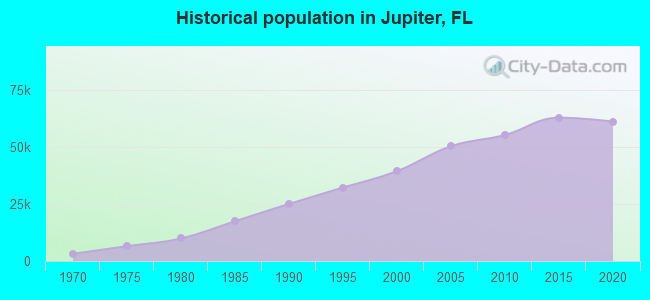

Population change in the 1990s: +11,053 (+39.1%).
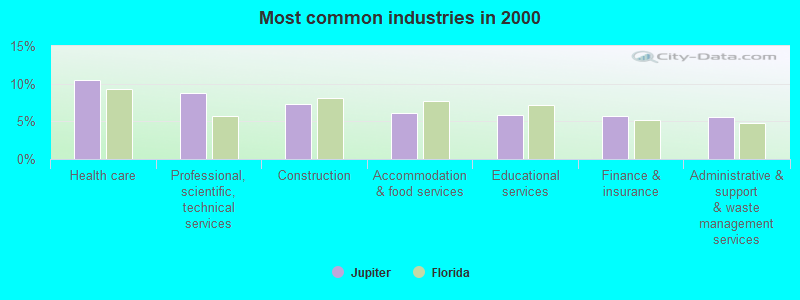
- Health care (10.5%)
- Professional, scientific, technical services (8.8%)
- Construction (7.2%)
- Accommodation & food services (6.1%)
- Educational services (5.8%)
- Finance & insurance (5.7%)
- Administrative & support & waste management services (5.6%)
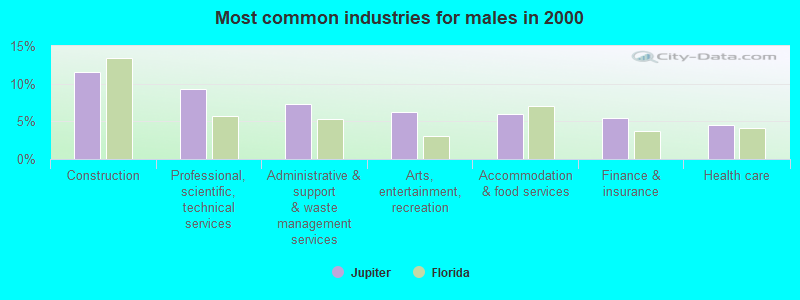
- Construction (11.5%)
- Professional, scientific, technical services (9.2%)
- Administrative & support & waste management services (7.4%)
- Arts, entertainment, recreation (6.2%)
- Accommodation & food services (6.0%)
- Finance & insurance (5.5%)
- Health care (4.5%)
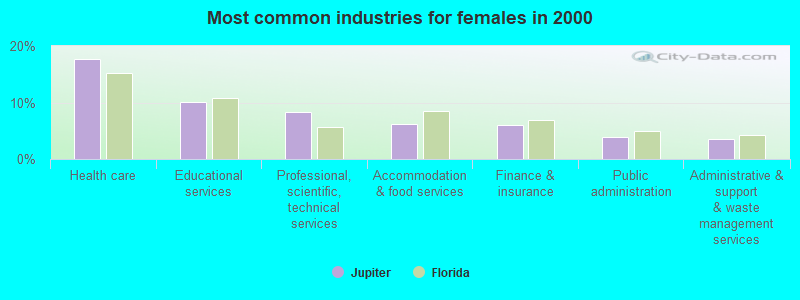
- Health care (17.8%)
- Educational services (10.0%)
- Professional, scientific, technical services (8.3%)
- Accommodation & food services (6.1%)
- Finance & insurance (6.0%)
- Public administration (3.8%)
- Administrative & support & waste management services (3.6%)
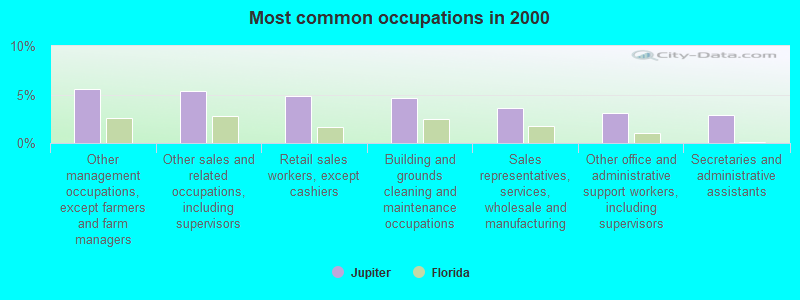
- Other management occupations, except farmers and farm managers (5.5%)
- Other sales and related occupations, including supervisors (5.4%)
- Retail sales workers, except cashiers (4.9%)
- Building and grounds cleaning and maintenance occupations (4.6%)
- Sales representatives, services, wholesale and manufacturing (3.6%)
- Other office and administrative support workers, including supervisors (3.0%)
- Secretaries and administrative assistants (2.9%)
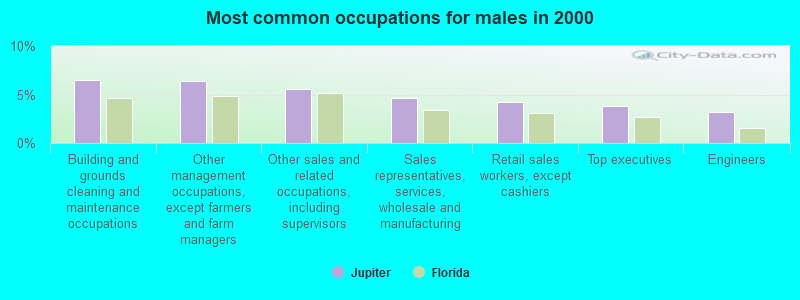
- Building and grounds cleaning and maintenance occupations (6.5%)
- Other management occupations, except farmers and farm managers (6.4%)
- Other sales and related occupations, including supervisors (5.5%)
- Sales representatives, services, wholesale and manufacturing (4.7%)
- Retail sales workers, except cashiers (4.2%)
- Top executives (3.8%)
- Engineers (3.2%)
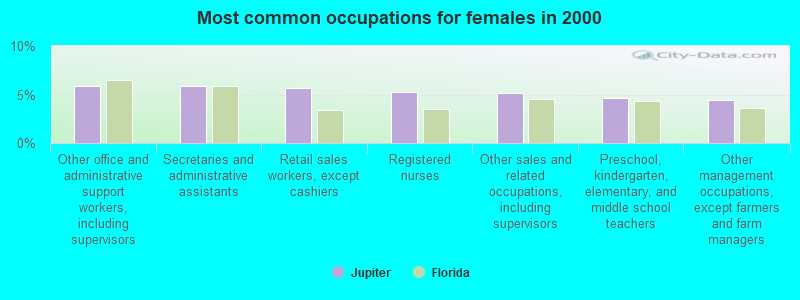
- Other office and administrative support workers, including supervisors (5.9%)
- Secretaries and administrative assistants (5.9%)
- Retail sales workers, except cashiers (5.7%)
- Registered nurses (5.2%)
- Other sales and related occupations, including supervisors (5.2%)
- Preschool, kindergarten, elementary, and middle school teachers (4.7%)
- Other management occupations, except farmers and farm managers (4.5%)
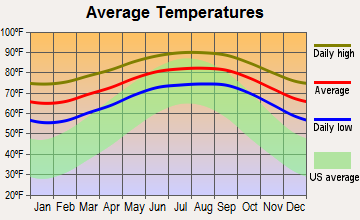
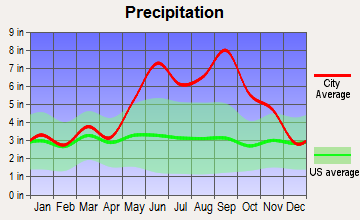
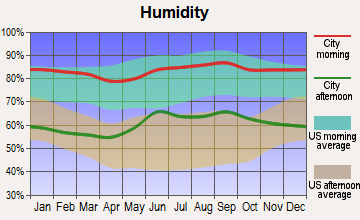
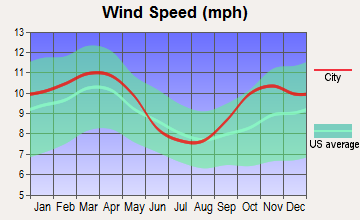
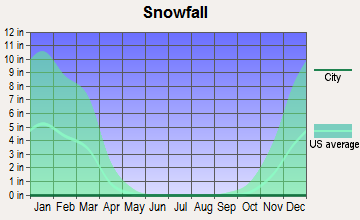
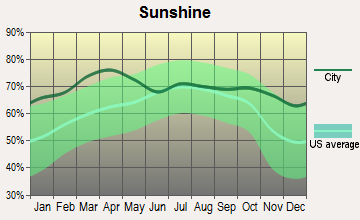
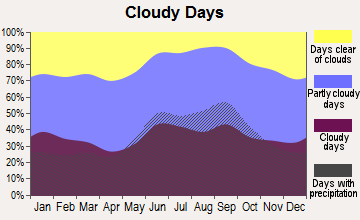
Average climate in Jupiter, Florida
Based on data reported by over 4,000 weather stations
|
|


(lower is better)
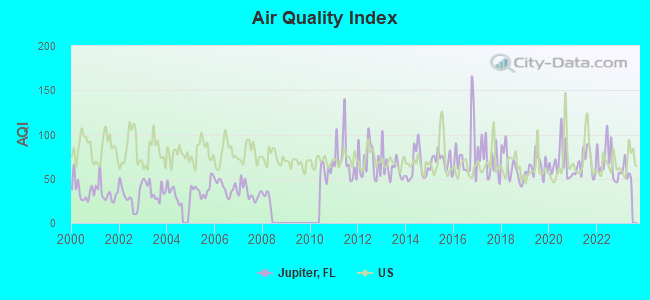
Air Quality Index (AQI) level in 2022 was 68.8. This is about average.
| City: | 68.8 |
| U.S.: | 72.6 |
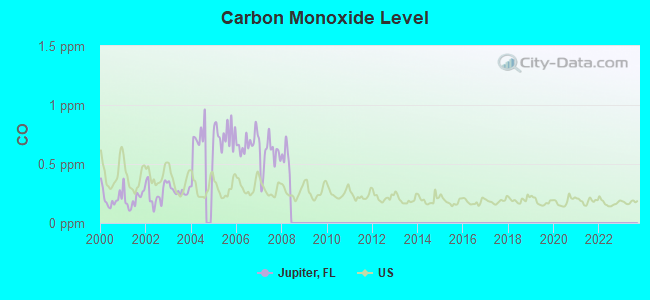
Carbon Monoxide (CO) [ppm] level in 2007 was 0.574. This is significantly worse than average. Closest monitor was 14.8 miles away from the city center.
| City: | 0.574 |
| U.S.: | 0.251 |
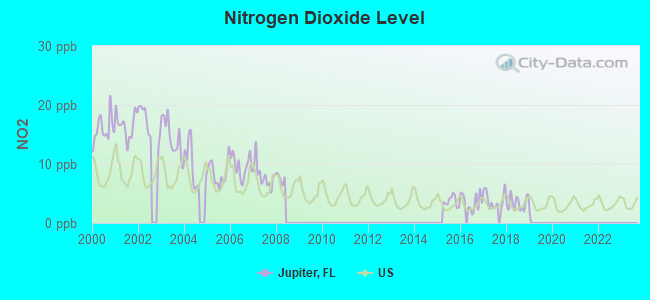
Nitrogen Dioxide (NO2) [ppb] level in 2018 was 3.39. This is significantly better than average. Closest monitor was 8.4 miles away from the city center.
| City: | 3.39 |
| U.S.: | 5.11 |
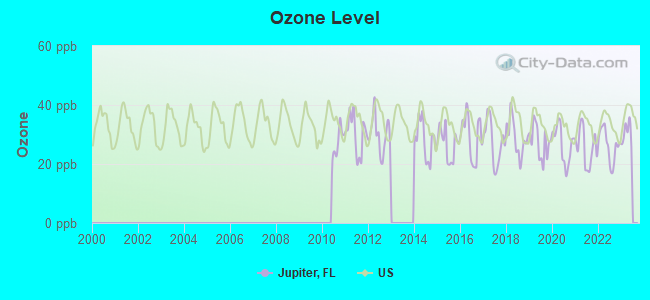
Ozone [ppb] level in 2022 was 26.4. This is better than average. Closest monitor was 14.8 miles away from the city center.
| City: | 26.4 |
| U.S.: | 33.3 |
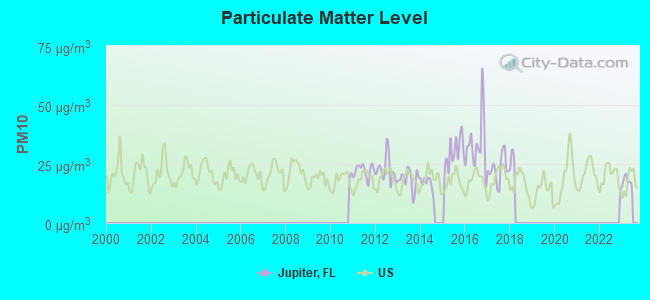
Particulate Matter (PM10) [µg/m3] level in 2017 was 22.9. This is about average. Closest monitor was 15.1 miles away from the city center.
| City: | 22.9 |
| U.S.: | 19.2 |
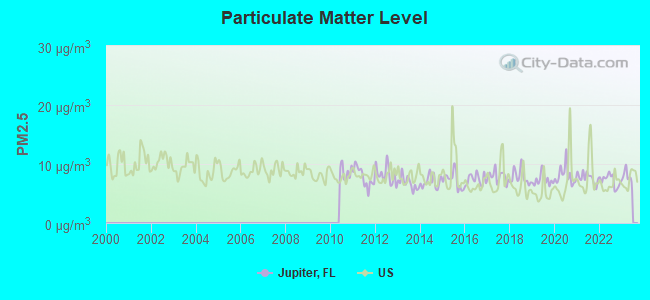
Particulate Matter (PM2.5) [µg/m3] level in 2022 was 7.21. This is about average. Closest monitor was 15.7 miles away from the city center.
| City: | 7.21 |
| U.S.: | 8.11 |
Tornado activity:
Jupiter-area historical tornado activity is below Florida state average. It is 33% smaller than the overall U.S. average.
On 10/19/1958, a category F3 (max. wind speeds 158-206 mph) tornado 22.5 miles away from the Jupiter town center killed one person and injured 24 people and caused between $50,000 and $500,000 in damages.
On 3/26/1970, a category F2 (max. wind speeds 113-157 mph) tornado 0.4 miles away from the town center caused between $500 and $5000 in damages.
Earthquake activity:
Jupiter-area historical earthquake activity is above Florida state average. It is 94% smaller than the overall U.S. average.On 9/10/2006 at 14:56:08, a magnitude 5.9 (5.9 MB, 5.5 MS, 5.8 MW, Class: Moderate, Intensity: VI - VII) earthquake occurred 406.2 miles away from Jupiter center
On 2/22/1992 at 04:21:34, a magnitude 3.2 (3.2 MB, Depth: 6.2 mi, Class: Light, Intensity: II - III) earthquake occurred 84.9 miles away from Jupiter center
On 6/23/2016 at 17:20:29, a magnitude 3.8 (3.8 ML) earthquake occurred 216.0 miles away from the city center
On 7/16/2016 at 20:00:10, a magnitude 3.7 (3.7 MB) earthquake occurred 200.6 miles away from the city center
On 9/21/2016 at 16:30:52, a magnitude 3.8 (3.8 ML) earthquake occurred 220.8 miles away from the city center
On 9/4/2016 at 18:29:29, a magnitude 3.8 (3.8 ML) earthquake occurred 221.9 miles away from the city center
Magnitude types: body-wave magnitude (MB), local magnitude (ML), surface-wave magnitude (MS), moment magnitude (MW)
Natural disasters:
The number of natural disasters in Palm Beach County (27) is a lot greater than the US average (15).Major Disasters (Presidential) Declared: 15
Emergencies Declared: 8
Causes of natural disasters: Hurricanes: 17, Tropical Storms: 4, Fires: 3, Flood: 1, Freeze: 1, Storm: 1, Other: 2 (Note: some incidents may be assigned to more than one category).

Hospitals and medical centers in Jupiter:
- JUPITER MEDICAL CENTER (Voluntary non-profit - Private, provides emergency services, 1210 S OLD DIXIE HWY)
- COURTYARD GARDENS REHABILITATION CENTER LLC (17781 THELMA AVENUE)
- JUPITER MEDICAL CENTER PAVILION INC (1230 SOUTH OLD DIXIE HWY)
- JUPITER KIDNEY CENTER LLC (1701 MILITARY TRAIL #140)
- AUTUMN HOME CARE (400 TONEY PENNA DRIVE SUITE C-1)
- PROGRESSIVE HOME HEALTH CARE, INC. (312 S OLD DIXIE HWY STE 101)
Airports and heliports located in Jupiter:
- Br Ranch Airport (82FL) (Runways: 1)
- Tailwinds Airport (FD15) (Runways: 1)
- William P Gwinn Airport (06FA) (Runways: 1)
- Flying H Heliport (81FD)
- Jupiter Medical Center Heliport (60FL)
Amtrak station near Jupiter:
Colleges/universities with over 2000 students nearest to Jupiter:
- Palm Beach Atlantic University (about 16 miles; West Palm Beach, FL; Full-time enrollment: 2,868)
- Palm Beach State College (about 22 miles; Lake Worth, FL; FT enrollment: 19,938)
- Lynn University (about 38 miles; Boca Raton, FL; FT enrollment: 2,151)
- Indian River State College (about 38 miles; Fort Pierce, FL; FT enrollment: 12,211)
- Florida Atlantic University (about 39 miles; Boca Raton, FL; FT enrollment: 24,403)
- Everest University-Pompano Beach (about 48 miles; Pompano Beach, FL; FT enrollment: 2,316)
- Keiser University-Ft Lauderdale (about 52 miles; Fort Lauderdale, FL; FT enrollment: 18,270)
Public high school in Jupiter:
- JUPITER HIGH SCHOOL (Students: 534, Location: 500 MILITARY TRL, Grades: 9-12)
Private high school in Jupiter:
Public elementary/middle schools in Jupiter:
- INDEPENDENCE MIDDLE SCHOOL (Students: 1,291, Location: 4001 GREENWAY DR, Grades: 6-8)
- BEACON COVE INTERMEDIATE SCHOOL (Students: 870, Location: 150 SCHOOLHOUSE RD, Grades: 3-5)
- LIMESTONE CREEK ELEMENTARY SCHOOL (Students: 708, Location: 6701 CHURCH ST, Grades: PK-6)
- JUPITER ELEMENTARY SCHOOL (Students: 609, Location: 200 S LOXAHATCHEE DR, Grades: PK-5)
- JERRY THOMAS ELEMENTARY SCHOOL (Students: 465, Location: 800 MAPLEWOOD DR, Grades: PK-5)
- JUPITER FARMS ELEMENTARY SCHOOL (Students: 459, Location: 17400 HAYNIE LN, Grades: PK-5)
- LIGHTHOUSE ELEMENTARY SCHOOL (Students: 291, Location: 4750 DAKOTA DR, Grades: PK-2)
- JUPITER MIDDLE SCHOOL (Students: 266, Location: 15245 MILITARY TRL, Grades: 6-8)
Private elementary/middle schools in Jupiter:
User-submitted facts and corrections:
- Jupiter Academy 125 S. Pennock Lane Jupiter, FL 33458 Private school for PK3 through Eighth Grade
- Jupiter is one of the most historically significant communities in the State of Florida. Flags of five foreign countries have flown over the area. It's the starting for Jonathan Dickinson and his party's 230 mile odyssey in the fall of 1696 when they were shipwrecked off the Jupiter Inlet. It's the site of a pivotal battle in the Seminole Indian Wars. The Jupiter Lighthouse, constructed in 1860, is the oldest existing structure in Palm Beach County. added by A Casual Observer
Points of interest:
Notable locations in Jupiter: Hillcrest Golf and Country Club (A), Highlands Reserve Golf Club (B), WJTS (C), Gallery Square North and South (D), Tequesta Plaza (E), Palm Beach County Library System Jupiter Branch (F), Hibel Museum of Art (G), Fire Station Number 19 (H), Palm Beach County Fire Rescue Station 16 (I), Palm Beach County Fire Rescue Station 18 (J), Palm Beach County Fire Rescue Station 19 (K), Jupiter Police Department (L). Display/hide their locations on the map
Shopping Centers: Calle Vieja Shopping Center (1), Concourse Village Shopping Center (2). Display/hide their locations on the map
Church in Jupiter: Church of God (A). Display/hide its location on the map
Lake: Lake Worth Creek (A). Display/hide its location on the map
River: North Fork Loxahatchee River (A). Display/hide its location on the map
Parks in Jupiter include: Loxahatchee River Bend Park (1), Jupiter Island Park (2), Carlin Park (3). Display/hide their locations on the map
Tourist attractions: Dubois Pioneer Home (Museums; Du Bois Park) (1), Burt Reynold's Museum (100 North US Highway 1) (2), Busch Wildlife Sanctuary (Recreation Areas; 2500 Jupiter Park Drive) (3), A 1 A Palm Beach Dive Charters (Tours & Charters; 11339 159th Court North) (4). Display/hide their approximate locations on the map
Hotels: Best Western Intracoastal Inn (810 South US Highway 1) (1), Comfort Inn & Suites (6752 West Indiantown Road) (2). Display/hide their approximate locations on the map
Birthplace of: Clifford Sweet - Lawyer, Drew Garrett - Child actor, Matt Bosher - Football player, Alex Kaklamanos - College basketball player (Georgia Southern Eagles), Craig Page - College football player, Drew Helm - Soccer player, Jason Rudakas - College basketball player (Wagner Seahawks), Miles Mikolas - Baseball player.
Drinking water stations with addresses in Jupiter and their reported violations in the past:
IGLESIA DE ADORACION FAMILIAR (Population served: 275, Groundwater):Past monitoring violations:PALM BEACH INTERNATIONAL RACEWAY (Population served: 250, Groundwater):
- Monitoring, Source Water (GWR) - In JUN-01-2014, Contaminant: E. COLI
Past monitoring violations:WEST JUPITER CAMPGROUND(RV-PK) (Address: 17801 130TH AVE. NORTH , Population served: 140, Groundwater):
- Failure to Conduct Assessment Monitoring - Between OCT-2012 and DEC-2012, Contaminant: E. COLI
- 5 routine major monitoring violations
- 2 minor monitoring violations
- One regular monitoring violation
Past monitoring violations:BLAIR ROAD APARTMENTS (Population served: 120, Groundwater):
- 4 routine major monitoring violations
- 2 regular monitoring violations
Past monitoring violations:JOURNEY CHURCH A/K/A JUP. FARMS COMMUNI (Population served: 45, Groundwater):
- Monitoring and Reporting (DBP) - Between JAN-2008 and MAR-2008, Contaminant: Total Haloacetic Acids (HAA5). Follow-up actions: St Public Notif requested (JUN-20-2008), St Public Notif received (JUL-09-2008), St Compliance achieved (AUG-11-2008)
- Monitoring and Reporting (DBP) - Between JAN-2008 and MAR-2008, Contaminant: TTHM. Follow-up actions: St Public Notif requested (JUN-20-2008), St Public Notif received (JUL-09-2008), St Compliance achieved (AUG-11-2008)
- 3 routine major monitoring violations
Past monitoring violations:TRI-GAS INC.,MATHESON (Population served: 29, Groundwater):
- 2 routine major monitoring violations
- One minor monitoring violation
Past monitoring violations:THE VALMARON CENTER (EQUESTRIAN GRILL) (Population served: 25, Groundwater):
- 4 routine major monitoring violations
Past monitoring violations:
- 2 routine major monitoring violations
- 2 regular monitoring violations
Drinking water stations with addresses in Jupiter that have no violations reported:
- OLD TRAIL CLUBHOUSE (Population served: 400, Primary Water Source Type: Groundwater)
- JUPITER SEVENTH DAY ADVENTIST CHURCH (Population served: 302, Primary Water Source Type: Groundwater)
| This town: | 2.3 people |
| Florida: | 2.5 people |
| This town: | 62.8% |
| Whole state: | 65.2% |
| This town: | 6.2% |
| Whole state: | 7.3% |
Likely homosexual households (counted as self-reported same-sex unmarried-partner households)
- Lesbian couples: 0.4% of all households
- Gay men: 0.3% of all households
131 people in nursing facilities/skilled-nursing facilities in 2010
70 people in nursing homes in 2000
21 people in other group homes in 2000
Banks with most branches in Jupiter (2011 data):
- Wells Fargo Bank, National Association: Jupiter Branch, Jupiter West Branch, Jupiter East Branch, Admiral Cove Branch, Jupiter Pb Branch, Abacoa Branch. Info updated 2011/04/05: Bank assets: $1,161,490.0 mil, Deposits: $905,653.0 mil, headquarters in Sioux Falls, SD, positive income, 6395 total offices, Holding Company: Wells Fargo & Company
- PNC Bank, National Association: Jupiter Branch, Military Trail @ Frederick Small Bra, Jupiter Farms Branch, Abacoa Branch. Info updated 2012/03/20: Bank assets: $263,309.6 mil, Deposits: $197,343.0 mil, headquarters in Wilmington, DE, positive income, Commercial Lending Specialization, 3085 total offices, Holding Company: Pnc Financial Services Group, Inc., The
- SunTrust Bank: Jupiter Branch, South Jupiter Branch, Sea Plum Town Center Branch, Jupiter Abacoa Branch. Info updated 2010/05/27: Bank assets: $171,291.7 mil, Deposits: $129,833.2 mil, headquarters in Atlanta, GA, positive income, Commercial Lending Specialization, 1716 total offices, Holding Company: Suntrust Banks, Inc.
- BankAtlantic: Abacoa Branch, Maplewood Branch, Toney Penna Branch, Bluffs Branch. Info updated 2011/07/21: Bank assets: $3,648.1 mil, Deposits: $3,293.2 mil, headquarters in Fort Lauderdale, FL, negative income in the last year, Commercial Lending Specialization, 78 total offices
- Bank of America, National Association: Jupiter Square Branch, Abacoa Plaza, Chasewood Plaza Branch. Info updated 2009/11/18: Bank assets: $1,451,969.3 mil, Deposits: $1,077,176.8 mil, headquarters in Charlotte, NC, positive income, 5782 total offices, Holding Company: Bank Of America Corporation
- Stonegate Bank: Jupiter Lpo at 3535 Military Trail, branch established on 2006/06/15; Jupiter Branch at 3555 Military Trail, branch established on 2006/09/27. Info updated 2011/06/20: Bank assets: $855.0 mil, Deposits: $674.1 mil, headquarters in Fort Lauderdale, FL, positive income, Commercial Lending Specialization, 10 total offices
- JPMorgan Chase Bank, National Association: Indiantown & Palm Roads Banking Cent at 2425 West Indiantown Road, branch established on 2012/02/06; North Us Highway Branch at 101 North Us Highway 1, branch established on 1937/08/10. Info updated 2011/11/10: Bank assets: $1,811,678.0 mil, Deposits: $1,190,738.0 mil, headquarters in Columbus, OH, positive income, International Specialization, 5577 total offices, Holding Company: Jpmorgan Chase & Co.
- Seacoast National Bank: Indiantown Road Branch at 585 West Indiantown Road, branch established on 2004/12/28. Info updated 2006/10/25: Bank assets: $2,135.8 mil, Deposits: $1,726.5 mil, headquarters in Stuart, FL, positive income, Commercial Lending Specialization, 42 total offices, Holding Company: Capgen Capital Group Iii Lp
- Gulfstream Business Bank: North Palm Branch at 250 Central Blvd #106, branch established on 2007/07/02. Info updated 2006/11/03: Bank assets: $545.9 mil, Deposits: $438.2 mil, headquarters in Stuart, FL, positive income, Commercial Lending Specialization, 4 total offices, Holding Company: Gulfstream Bancshares, Inc.
- 5 other banks with 5 local branches
For population 15 years and over in Jupiter:
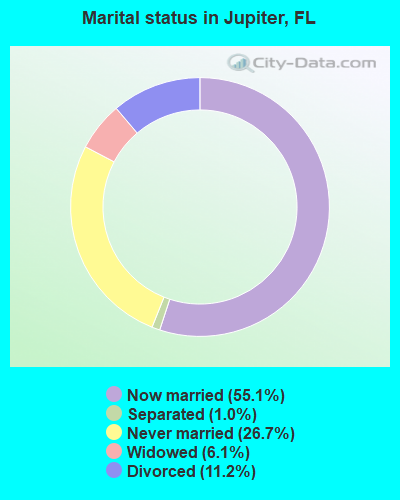
- Never married: 26.7%
- Now married: 55.1%
- Separated: 1.0%
- Widowed: 6.1%
- Divorced: 11.2%
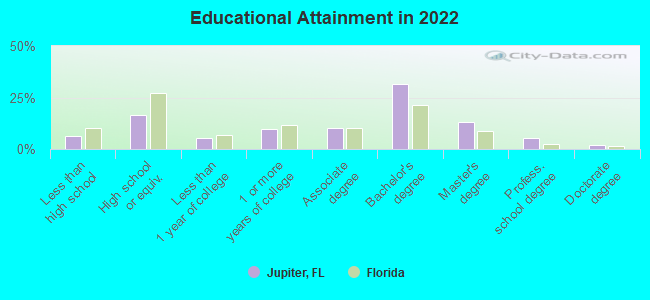
For population 25 years and over in Jupiter:
- High school or higher: 93.6%
- Bachelor's degree or higher: 49.9%
- Graduate or professional degree: 20.0%
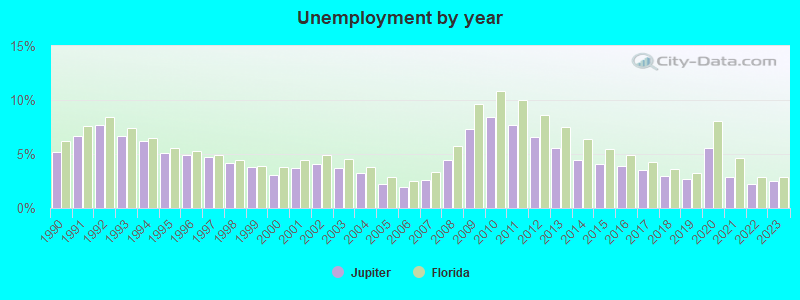
- Unemployed: 2.5%
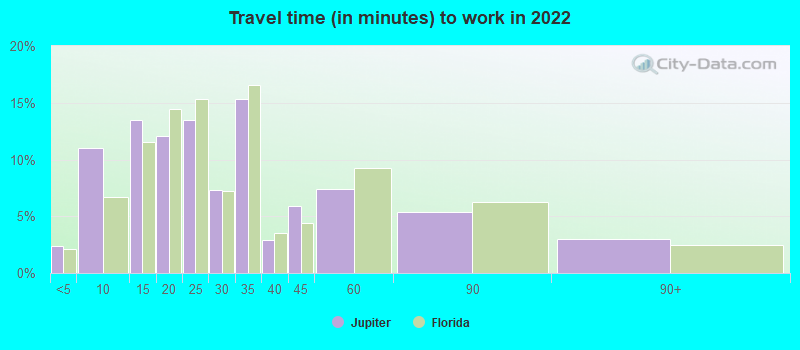
- Mean travel time to work (commute): 18.6 minutes
| Here: | 12.1 |
| Florida average: | 12.2 |
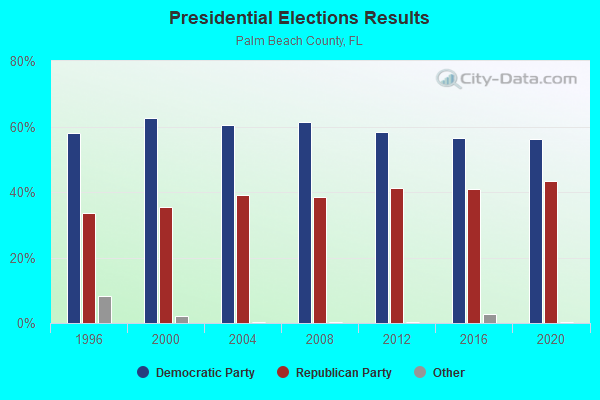

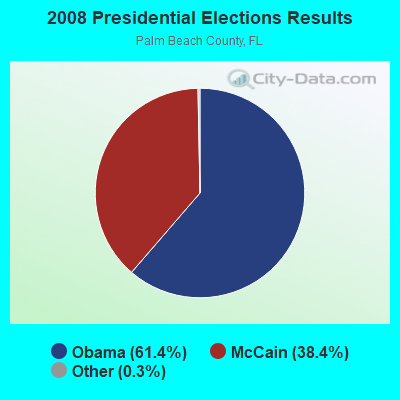
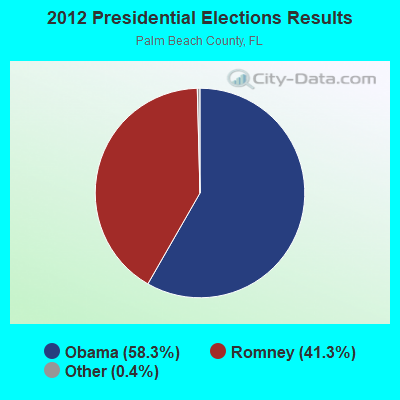
Graphs represent county-level data. Detailed 2008 Election Results
Neighborhoods in Jupiter:
(Jupiter, Florida Neighborhood Map)Religion statistics for Jupiter, FL (based on Palm Beach County data)
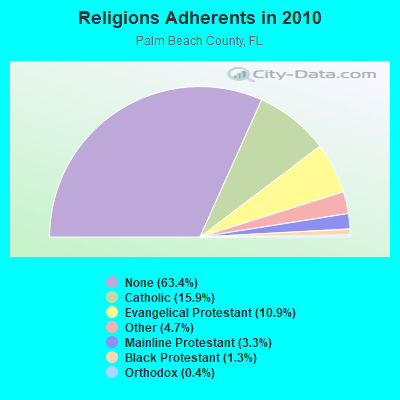
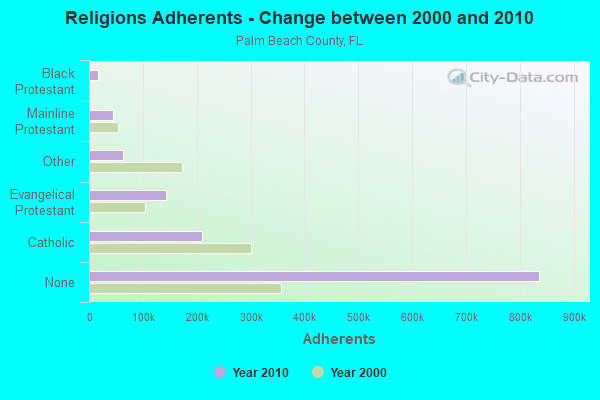
| Religion | Adherents | Congregations |
|---|---|---|
| Catholic | 210,006 | 36 |
| Evangelical Protestant | 143,738 | 477 |
| Other | 62,520 | 124 |
| Mainline Protestant | 44,223 | 83 |
| Black Protestant | 17,533 | 47 |
| Orthodox | 5,695 | 8 |
| None | 836,419 | - |
Food Environment Statistics:
| This county: | 2.05 / 10,000 pop. |
| State: | 2.04 / 10,000 pop. |
| Palm Beach County: | 0.10 / 10,000 pop. |
| Florida: | 0.11 / 10,000 pop. |
| This county: | 1.28 / 10,000 pop. |
| Florida: | 1.28 / 10,000 pop. |
| Palm Beach County: | 2.25 / 10,000 pop. |
| Florida: | 3.04 / 10,000 pop. |
| Palm Beach County: | 8.96 / 10,000 pop. |
| State: | 7.45 / 10,000 pop. |
| Here: | 8.7% |
| Florida: | 9.2% |
| Here: | 19.3% |
| Florida: | 23.7% |
| Here: | 17.3% |
| Florida: | 14.0% |
Health and Nutrition:
| Jupiter: | 54.3% |
| State: | 51.4% |
| Jupiter: | 53.0% |
| State: | 49.4% |
| Jupiter: | 28.2 |
| Florida: | 28.6 |
| Jupiter: | 18.7% |
| Florida: | 19.5% |
| This city: | 8.1% |
| Florida: | 10.7% |
| This city: | 6.9 |
| State: | 6.9 |
| Jupiter: | 35.3% |
| Florida: | 34.7% |
| Jupiter: | 59.8% |
| Florida: | 57.0% |
| Here: | 78.8% |
| Florida: | 79.2% |
More about Health and Nutrition of Jupiter, FL Residents
| Local government employment and payroll (March 2022) | |||||
| Function | Full-time employees | Monthly full-time payroll | Average yearly full-time wage | Part-time employees | Monthly part-time payroll |
|---|---|---|---|---|---|
| Police Protection - Officers | 115 | $1,109,871 | $115,813 | 0 | $0 |
| Other and Unallocable | 70 | $437,076 | $74,927 | 1 | $6,247 |
| Water Supply | 50 | $311,406 | $74,737 | 0 | $0 |
| Parks and Recreation | 42 | $210,448 | $60,128 | 1 | $1,831 |
| Police - Other | 28 | $153,815 | $65,921 | 0 | $0 |
| Other Government Administration | 22 | $140,201 | $76,473 | 0 | $0 |
| Financial Administration | 20 | $147,460 | $88,476 | 0 | $0 |
| Streets and Highways | 15 | $147,053 | $117,642 | 0 | $0 |
| Natural Resources | 2 | $12,796 | $76,776 | 0 | $0 |
| Totals for Government | 364 | $2,670,127 | $88,026 | 2 | $8,078 |
Jupiter government finances - Expenditure in 2021 (per resident):
- Construction - General - Other: $16,564,000 ($270.98)
Regular Highways: $2,301,000 ($37.64)
- Current Operations - Police Protection: $23,688,000 ($387.53)
Water Utilities: $22,605,000 ($369.81)
Regular Highways: $8,157,000 ($133.45)
Protective Inspection and Regulation - Other: $5,056,000 ($82.71)
Financial Administration: $4,361,000 ($71.34)
Central Staff Services: $4,272,000 ($69.89)
Natural Resources - Other: $2,813,000 ($46.02)
Parks and Recreation: $2,707,000 ($44.29)
Judicial and Legal Services: $388,000 ($6.35)
- General - Interest on Debt: $680,000 ($11.12)
- Other Capital Outlay - Parks and Recreation: $296,000 ($4.84)
Police Protection: $43,000 ($0.70)
Protective Inspection and Regulation - Other: $22,000 ($0.36)
- Water Utilities - Interest on Debt: $455,000 ($7.44)
Jupiter government finances - Revenue in 2021 (per resident):
- Charges - Solid Waste Management: $3,792,000 ($62.04)
Other: $3,750,000 ($61.35)
Natural Resources - Other: $3,193,000 ($52.24)
Parks and Recreation: $229,000 ($3.75)
Regular Highways: $97,000 ($1.59)
- Federal Intergovernmental - Other: $2,793,000 ($45.69)
- Local Intergovernmental - General Local Government Support: $159,000 ($2.60)
Other: $3,000 ($0.05)
- Miscellaneous - Interest Earnings: $2,497,000 ($40.85)
General Revenue - Other: $2,141,000 ($35.03)
Fines and Forfeits: $253,000 ($4.14)
Special Assessments: $158,000 ($2.58)
Donations From Private Sources: $72,000 ($1.18)
- Revenue - Water Utilities: $27,773,000 ($454.36)
- State Intergovernmental - General Local Government Support: $10,822,000 ($177.04)
Other: $860,000 ($14.07)
Highways: $29,000 ($0.47)
- Tax - Property: $30,708,000 ($502.37)
Public Utilities Sales: $7,698,000 ($125.94)
Occupation and Business License - Other: $5,159,000 ($84.40)
Other License: $4,400,000 ($71.98)
Motor Fuels Sales: $1,252,000 ($20.48)
Jupiter government finances - Debt in 2021 (per resident):
- Long Term Debt - Beginning Outstanding - Unspecified Public Purpose: $24,893,000 ($407.24)
Outstanding Unspecified Public Purpose: $20,856,000 ($341.20)
Retired Unspecified Public Purpose: $3,937,000 ($64.41)
Jupiter government finances - Cash and Securities in 2021 (per resident):
- Other Funds - Cash and Securities: $195,992,000 ($3206.36)
- Sinking Funds - Cash and Securities: $2,326,000 ($38.05)
7.12% of this county's 2021 resident taxpayers lived in other counties in 2020 ($242,201 average adjusted gross income)
| Here: | 7.12% |
| Florida average: | 8.80% |
0.02% of residents moved from foreign countries ($131 average AGI)
Palm Beach County: 0.02% Florida average: 0.05%
Top counties from which taxpayers relocated into this county between 2020 and 2021:
| from Broward County, FL | |
| from Miami-Dade County, FL | |
| from New York County, NY |
6.27% of this county's 2020 resident taxpayers moved to other counties in 2021 ($96,101 average adjusted gross income)
| Here: | 6.27% |
| Florida average: | 7.45% |
0.02% of residents moved to foreign countries ($206 average AGI)
Palm Beach County: 0.02% Florida average: 0.04%
Top counties to which taxpayers relocated from this county between 2020 and 2021:
| to Broward County, FL | |
| to St. Lucie County, FL | |
| to Miami-Dade County, FL |
| Businesses in Jupiter, FL | ||||
| Name | Count | Name | Count | |
|---|---|---|---|---|
| AT&T | 2 | McDonald's | 4 | |
| Advance Auto Parts | 1 | Nike | 5 | |
| Applebee's | 1 | Office Depot | 1 | |
| BMW | 1 | Outback | 1 | |
| Best Western | 1 | Outback Steakhouse | 1 | |
| Blockbuster | 2 | Panera Bread | 1 | |
| Burger King | 1 | Payless | 1 | |
| CVS | 2 | Penske | 1 | |
| Circle K | 4 | Pizza Hut | 1 | |
| Comfort Inn | 1 | Publix Super Markets | 7 | |
| Curves | 1 | RadioShack | 1 | |
| Dairy Queen | 1 | Shoe Carnival | 1 | |
| Domino's Pizza | 1 | Staples | 1 | |
| Dunkin Donuts | 2 | Starbucks | 3 | |
| FedEx | 22 | Subway | 3 | |
| GNC | 3 | T-Mobile | 2 | |
| GameStop | 1 | T.J.Maxx | 1 | |
| H&R Block | 3 | Taco Bell | 2 | |
| Home Depot | 1 | The Room Place | 1 | |
| IHOP | 1 | Tire Kingdom | 1 | |
| Jimmy John's | 1 | Toys"R"Us | 1 | |
| Jones New York | 4 | U-Haul | 3 | |
| KFC | 1 | UPS | 28 | |
| La Quinta | 1 | Vans | 1 | |
| Marriott | 1 | Walmart | 1 | |
Strongest AM radio stations in Jupiter:
- WJBW (1000 AM; 1 kW; JUPITER, FL; Owner: JAMES CRYSTAL JUPITER, INC.)
- WFTL (850 AM; 50 kW; WEST PALM BEACH, FL; Owner: JAMES CRYSTAL ENTERPRISES II, L.L.C.)
- WEFL (760 AM; 3 kW; TEQUESTA, FL; Owner: STAR OF THE PALM BEACHES, INC.)
- WJNO (1290 AM; 10 kW; WEST PALM BEACH, FL; Owner: CLEAR CHANNEL BROADCASTING LICENSES, INC.)
- WJNA (640 AM; 38 kW; ROYAL PALM BEACH, FL; Owner: SOUTH FLORIDA RADIO, INC.)
- WLVJ (1040 AM; 25 kW; BOYNTON BEACH, FL; Owner: JAMES CRYSTAL BOYNTON BEACH, INC.)
- WMNE (1600 AM; 5 kW; RIVIERA BEACH, FL; Owner: ABC, INC.)
- WAQI (710 AM; 50 kW; MIAMI, FL; Owner: LICENSE CORPORATION #1)
- WWNN (1470 AM; 50 kW; POMPANO BEACH, FL; Owner: WWNN LICENSE, LLC)
- WWFE (670 AM; 50 kW; MIAMI, FL; Owner: FENIX BROADCASTING CORP.)
- WRFX (940 AM; 50 kW; MIAMI, FL; Owner: CLEAR CHANNEL BROADCASTING LICENSES, INC.)
- WNMA (1210 AM; 49 kW; MIAMI SPRINGS, FL; Owner: RADIO UNICA OF MIAMI LICENSE CORP.)
- WQBA (1140 AM; 50 kW; MIAMI, FL; Owner: WQBA-AM LICENSE CORP.)
Strongest FM radio stations in Jupiter:
- WJBW-FM (106.3 FM; JUPITER, FL; Owner: INFINITY RADIO OPERATIONS INC.)
- WZZR (94.3 FM; RIVIERA BEACH, FL; Owner: CLEAR CHANNEL BROADCASTING LICENSES, INC.)
- WKGR (98.7 FM; FORT PIERCE, FL; Owner: CLEAR CHANNEL BROADCASTING LICENSES, INC.)
- WRMF (97.9 FM; PALM BEACH, FL; Owner: PBB LICENSES, LLC)
- WMBX (102.3 FM; JENSEN BEACH, FL; Owner: INFINITY RADIO OPERATIONS INC.)
- WPBZ (103.1 FM; INDIANTOWN, FL; Owner: INFINITY RADIO OPERATIONS INC.)
- WAYF (88.1 FM; WEST PALM BEACH, FL; Owner: WAY-FM MEDIA GROUP. INC.)
- WIRK-FM (107.9 FM; WEST PALM BEACH, FL; Owner: INFINITY RADIO OPERATIONS INC.)
- WOLL (105.5 FM; HOBE SOUND, FL; Owner: CLEAR CHANNEL BROADCASTING LICENSES, INC.)
- WWFR (91.7 FM; STUART, FL; Owner: FAMILY STATIONS, INC.)
- WRLX (92.1 FM; WEST PALM BEACH, FL; Owner: CAPSTAR TX LIMITED PARTNERSHIP)
- WEAT-FM (104.3 FM; WEST PALM BEACH, FL; Owner: INFINITY RADIO OPERATIONS INC.)
- WXEL (90.7 FM; WEST PALM BEACH, FL; Owner: BARRY TELECOMMUNICATIONS, INC.)
- WLDI (95.5 FM; FORT PIERCE, FL; Owner: CLEAR CHANNEL BROADCASTING LICENSES, INC.)
- WCNO (89.9 FM; PALM CITY, FL; Owner: NATIONAL CHRISTIAN NETWORK, INC.)
- W270AD (101.9 FM; WEST PALM BEACH, FL; Owner: TRINITY INTERNATIONAL FOUNDATION, INC.)
- WAVW (92.7 FM; STUART, FL; Owner: CAPSTAR TX LIMITED PARTNERSHIP)
- WRMB (89.3 FM; BOYNTON BEACH, FL; Owner: THE MOODY BIBLE INSTITUTE OF CHICAGO)
- W242AC (96.3 FM; PORT ST. LUCIE, FL; Owner: FRIENDS BROADCASTING, INC.)
TV broadcast stations around Jupiter:
- W53BS (Channel 53; JUPITER, FL; Owner: SPIRIT PRODUCTIONS, INC.)
- WPXP (Channel 67; LAKE WORTH, FL; Owner: PAXSON WEST PALM BEACH LICENSE, INC.)
- WTCN-CA (Channel 43; PALM BEACH, FL; Owner: WILLIAM H. BROTHERS)
- WWHB-CA (Channel 15; STUART, FL; Owner: AMERICAN NETCOM, INC.)
- WFGC (Channel 61; PALM BEACH, FL; Owner: CHRISTIAN TELEVISION OF PALM BEACH COUNTY, INC.)
- W47BG (Channel 47; WEST PALM BEACH, FL; Owner: JACKSONVILLE EDUCATORS B/CING., INC.)
- WTVX (Channel 34; FORT PIERCE, FL; Owner: C-34 FCC LICENSEE SUBSIDIARY, LLC)
- WPTV (Channel 5; WEST PALM BEACH, FL; Owner: SCRIPPS HOWARD BROADCASTING COMPANY)
- WPBF (Channel 25; TEQUESTA, FL; Owner: WPBF-TV COMPANY)
- WFLX (Channel 29; WEST PALM BEACH, FL; Owner: RAYCOM NATIONAL, INC.)
- WXEL-TV (Channel 42; WEST PALM BEACH, FL; Owner: BARRY TELECOMMUNICATIONS, INC.)
- WBWP-LP (Channel 57; WEST PALM BEACH, FL; Owner: H&R PRODUCTION GROUP, LLC)
- WPEC (Channel 12; WEST PALM BEACH, FL; Owner: FREEDOM BROADCASTING OF FLORIDA, INC)
- WTCE (Channel 21; FORT PIERCE, FL; Owner: JACKSONVILLE EDUCATORS B/CNG, INC.)
- National Bridge Inventory (NBI) Statistics
- 53Number of bridges
- 1,194ft / 364mTotal length
- 1,704,393Total average daily traffic
- 144,138Total average daily truck traffic
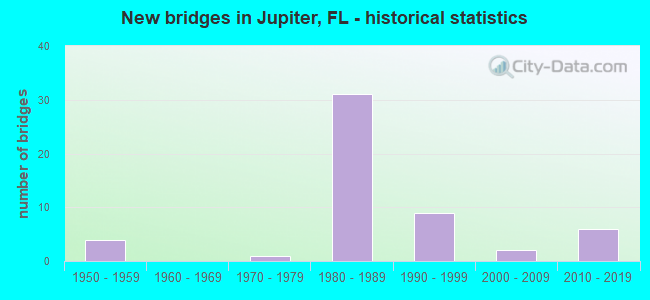
- New bridges - historical statistics
- 41950-1959
- 11970-1979
- 311980-1989
- 91990-1999
- 22000-2009
- 62010-2019
FCC Registered Antenna Towers: 109 (See the full list of FCC Registered Antenna Towers)
FCC Registered Private Land Mobile Towers: 12 (See the full list of FCC Registered Private Land Mobile Towers in Jupiter, FL)
FCC Registered Broadcast Land Mobile Towers: 77 (See the full list of FCC Registered Broadcast Land Mobile Towers)
FCC Registered Microwave Towers: 26 (See the full list of FCC Registered Microwave Towers in this town)
FCC Registered Paging Towers: 18 (See the full list of FCC Registered Paging Towers)
FCC Registered Maritime Coast & Aviation Ground Towers: 25 (See the full list of FCC Registered Maritime Coast & Aviation Ground Towers)
FCC Registered Amateur Radio Licenses: 488 (See the full list of FCC Registered Amateur Radio Licenses in Jupiter)
FAA Registered Aircraft Manufacturers and Dealers: 26 (See the full list of FAA Registered Manufacturers and Dealers in Jupiter)
FAA Registered Aircraft: 194 (See the full list of FAA Registered Aircraft)
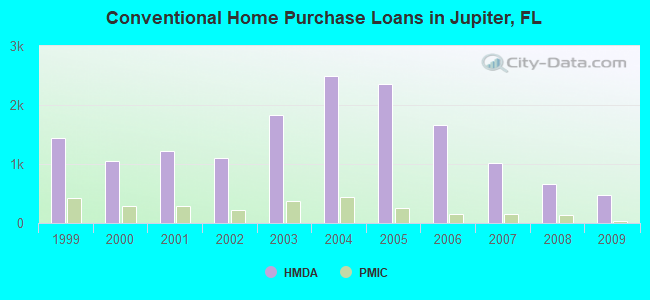
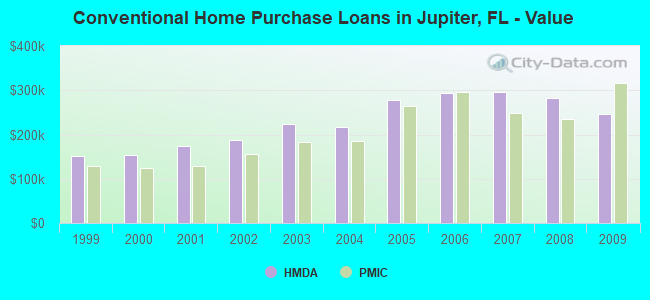
| Home Mortgage Disclosure Act Aggregated Statistics For Year 2009 (Based on 6 full and 7 partial tracts) | ||||||||||||
| A) FHA, FSA/RHS & VA Home Purchase Loans | B) Conventional Home Purchase Loans | C) Refinancings | D) Home Improvement Loans | F) Non-occupant Loans on < 5 Family Dwellings (A B C & D) | G) Loans On Manufactured Home Dwelling (A B C & D) | |||||||
|---|---|---|---|---|---|---|---|---|---|---|---|---|
| Number | Average Value | Number | Average Value | Number | Average Value | Number | Average Value | Number | Average Value | Number | Average Value | |
| LOANS ORIGINATED | 222 | $213,194 | 472 | $246,669 | 732 | $259,091 | 20 | $146,650 | 258 | $259,823 | 1 | $19,020 |
| APPLICATIONS APPROVED, NOT ACCEPTED | 16 | $228,511 | 56 | $223,579 | 108 | $246,298 | 3 | $90,583 | 26 | $188,664 | 0 | $0 |
| APPLICATIONS DENIED | 32 | $194,270 | 106 | $228,037 | 389 | $268,603 | 19 | $113,547 | 102 | $227,177 | 5 | $87,928 |
| APPLICATIONS WITHDRAWN | 27 | $210,400 | 60 | $283,416 | 181 | $254,980 | 7 | $128,943 | 42 | $259,966 | 1 | $144,580 |
| FILES CLOSED FOR INCOMPLETENESS | 6 | $188,905 | 13 | $186,184 | 60 | $265,830 | 2 | $130,660 | 7 | $192,553 | 0 | $0 |
Detailed mortgage data for all 13 tracts in Jupiter, FL
| Private Mortgage Insurance Companies Aggregated Statistics For Year 2009 (Based on 4 full and 6 partial tracts) | ||||||
| A) Conventional Home Purchase Loans | B) Refinancings | C) Non-occupant Loans on < 5 Family Dwellings (A & B) | ||||
|---|---|---|---|---|---|---|
| Number | Average Value | Number | Average Value | Number | Average Value | |
| LOANS ORIGINATED | 35 | $316,023 | 4 | $246,765 | 0 | $0 |
| APPLICATIONS APPROVED, NOT ACCEPTED | 17 | $300,076 | 1 | $533,620 | 1 | $129,190 |
| APPLICATIONS DENIED | 7 | $285,556 | 2 | $430,455 | 0 | $0 |
| APPLICATIONS WITHDRAWN | 1 | $218,350 | 0 | $0 | 0 | $0 |
| FILES CLOSED FOR INCOMPLETENESS | 5 | $222,998 | 1 | $385,640 | 0 | $0 |
2005 - 2018 National Fire Incident Reporting System (NFIRS) incidents
- Fire incident types reported to NFIRS in Jupiter, FL
- 37645.0%Outside Fires
- 26431.6%Structure Fires
- 17621.1%Mobile Property/Vehicle Fires
- 202.4%Other
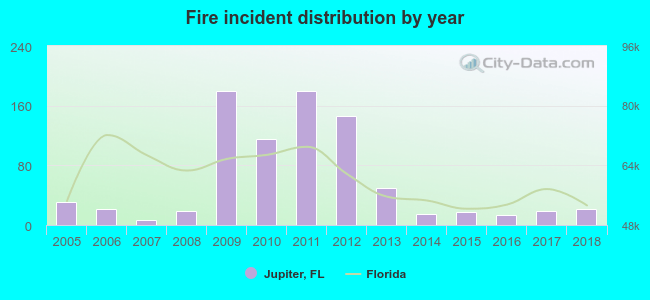 According to the data from the years 2005 - 2018 the average number of fire incidents per year is 60. The highest number of reported fire incidents - 180 took place in 2009, and the least - 7 in 2007. The data has a dropping trend.
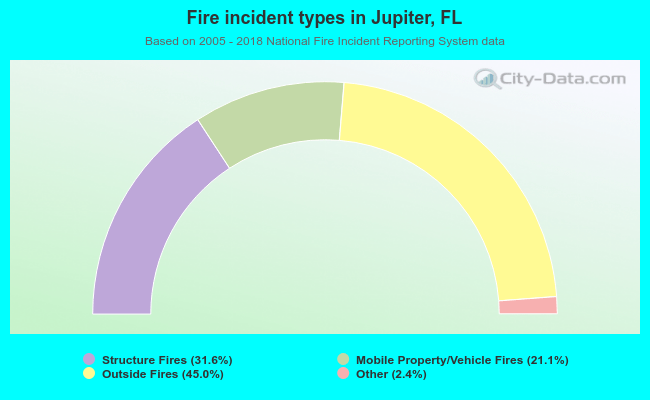 When looking into fire subcategories, the most reports belonged to: Outside Fires (45.0%), and Structure Fires (31.6%).
Fire-safe hotels and motels in Jupiter, Florida:
- Club Of Admirals Cove Hotel, 200 Admirals CV Blvd, Jupiter, Florida 33477
- Fairfield Inn & Suites Jupiter, 6748 W Indiantown Rd, Jupiter, Florida 33458 , Phone: (561) 748-5252, Fax: (561) 748-5251
- The Ritz-Carlton Jupiter, 106 Ritz Carlton Club Dr, Jupiter, Florida 33477 , Phone: (561) 626-8676, Fax: (561) 799-7887
- Comfort Inn & Suites, 6752 W Indiantown Rd, Jupiter, Florida 33477 , Phone: (561) 745-7997, Fax: (561) 768-0022
- Wyndham Grand Jupiter at Harbourside Place, 122 Soundings Ave, Jupiter, Florida 33477 , Phone: (561) 273-6666
| Most common first names in Jupiter, FL among deceased individuals | ||
| Name | Count | Lived (average) |
|---|---|---|
| John | 475 | 76.2 years |
| William | 371 | 76.5 years |
| Robert | 308 | 74.3 years |
| Mary | 306 | 80.7 years |
| James | 231 | 75.7 years |
| Joseph | 229 | 77.1 years |
| George | 205 | 77.4 years |
| Helen | 198 | 82.6 years |
| Charles | 181 | 77.2 years |
| Dorothy | 162 | 80.6 years |
| Most common last names in Jupiter, FL among deceased individuals | ||
| Last name | Count | Lived (average) |
|---|---|---|
| Smith | 105 | 77.3 years |
| Williams | 69 | 74.5 years |
| Johnson | 68 | 74.8 years |
| Brown | 59 | 73.8 years |
| Miller | 49 | 78.9 years |
| Jones | 37 | 75.6 years |
| Davis | 36 | 79.7 years |
| Wilson | 36 | 77.8 years |
| Taylor | 31 | 78.6 years |
| White | 31 | 76.6 years |
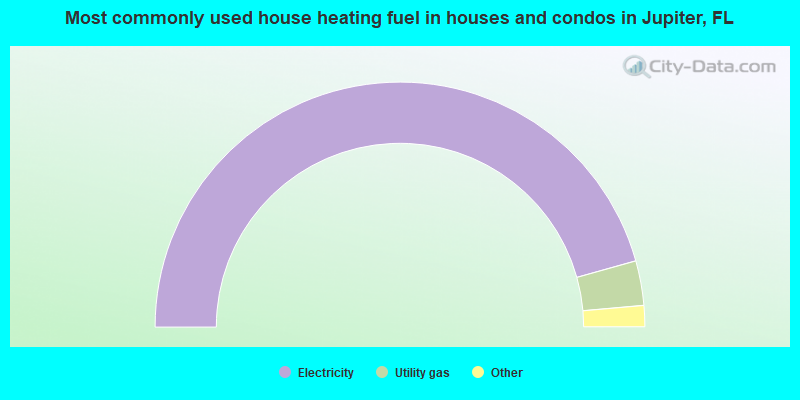
- 91.3%Electricity
- 5.9%Utility gas
- 2.1%No fuel used
- 0.4%Bottled, tank, or LP gas
- 0.2%Fuel oil, kerosene, etc.
- 0.2%Solar energy
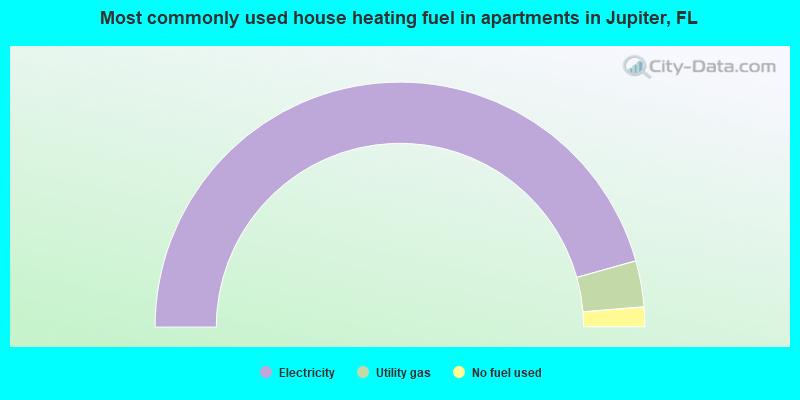
- 91.3%Electricity
- 6.1%Utility gas
- 2.6%No fuel used
Jupiter compared to Florida state average:
- Median household income above state average.
- Median house value above state average.
- Unemployed percentage significantly below state average.
- Black race population percentage significantly below state average.
- Median age above state average.
- Length of stay since moving in significantly above state average.
- Percentage of population with a bachelor's degree or higher above state average.
Jupiter on our top lists:
- #1 on the list of "Top 101 cities with largest percentage of females in industries: utilities (population 50,000+)"
- #7 on the list of "Top 101 cities with the most users submitting photos to our site per 10,000 residents (population 50,000+)"
- #23 on the list of "Top 101 cities with the most people born in other U.S. states (population 50,000+)"
- #27 on the list of "Top 100 cities with oldest residents (pop. 50,000+)"
- #36 on the list of "Top 101 cities with largest percentage of males in occupations: management occupations (population 50,000+)"
- #44 on the list of "Top 101 cities with the highest average temperatures (population 50,000+)"
- #44 on the list of "Top 101 cities with largest percentage of males in industries: arts, entertainment, and recreation (population 50,000+)"
- #47 on the list of "Top 101 cities with largest percentage of females in occupations: construction and extraction occupations (population 50,000+)"
- #48 on the list of "Top 101 cities with the smallest city-data.com crime index per police officer (population 50,000+)"
- #51 on the list of "Top 101 cities with the highest average yearly precipitation (population 50,000+)"
- #53 on the list of "Top 101 cities with the lowest number of murders per 100,000 residents (population 50,000+)"
- #55 on the list of "Top 101 cities with largest percentage of males in industries: utilities (population 50,000+)"
- #58 on the list of "Top 101 cities with the largest city-data.com crime index decrease from 2002 to 2012 (population 50,000+)"
- #59 on the list of "Top 101 cities with largest percentage of females in industries: real estate and rental and leasing (population 50,000+)"
- #62 on the list of "Top 101 cities with most building permits per 10,000 residents (population 50,000+)"
- #65 on the list of "Top 101 cities with the lowest number of auto thefts per 100,000 residents (population 50,000+)"
- #66 on the list of "Top 101 cities with largest percentage of females in occupations: health diagnosing and treating practitioners and other technical occupations (population 50,000+)"
- #70 on the list of "Top 101 cities with the highest cost per building permit(population 50,000+)"
- #72 on the list of "Top 101 cities with largest percentage of males in industries: accommodation and food services (population 50,000+)"
- #73 on the list of "Top 101 cities with largest percentage population increases in the 1990s) (population 50,000+)"
- #6 on the list of "Top 101 counties with the largest number of people without health insurance coverage in 2000 (pop. 50,000+)"
- #8 on the list of "Top 101 counties with the lowest average weight of females"
- #10 on the list of "Top 101 counties with the highest ground withdrawal of fresh water for public supply"
- #28 on the list of "Top 101 counties with the highest total withdrawal of fresh water for public supply"
- #35 on the list of "Top 101 counties with the most Evangelical Protestant congregations"

|
|
Total of 1223 patent applications in 2008-2024.