Percentage of residents living in poverty in 2022: 6.4%
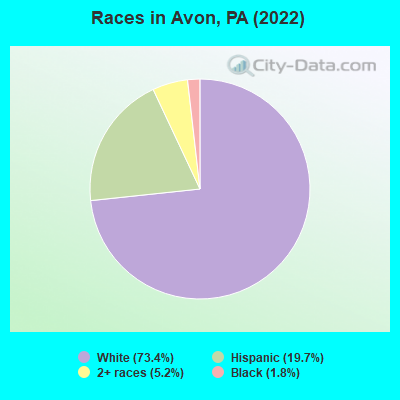
(4.0% for White Non-Hispanic residents, 17.9% for Black residents, 16.0% for Hispanic or Latino residents, 43.7% for other race residents)
Latest news from Avon, PA collected exclusively by city-data.com from local newspapers, TV, and radio stations
Ancestries: German (42.0%), American (18.4%), Irish (2.7%), Polish (2.7%), Pennsylvania German (2.6%), Slovak (2.5%).
Current Local Time: EST time zone
Elevation: 480 feet
Land area: 1.61 square miles.
Population density: 1,033 people per square mile (low).
24 residents are foreign born
This place:
1.7%
Pennsylvania:
7.3%
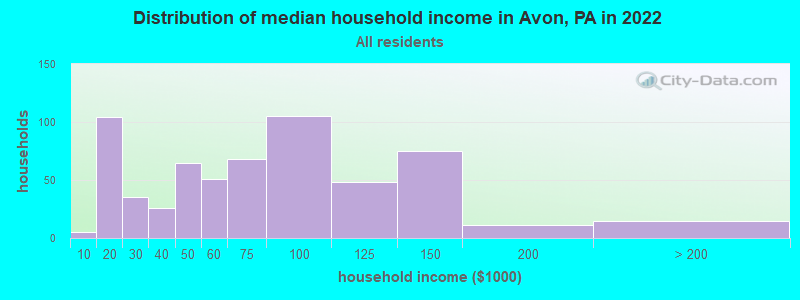
Median real estate property taxes paid for housing units with mortgages in 2022: $3,130 (1.5%) Median real estate property taxes paid for housing units with no mortgage in 2022: $2,341 (1.0%)
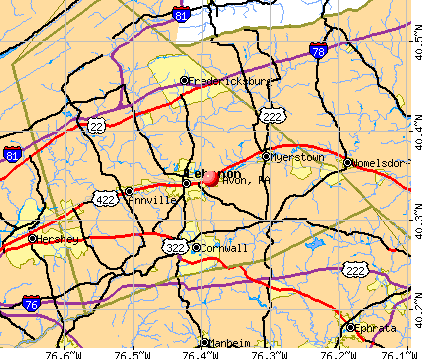
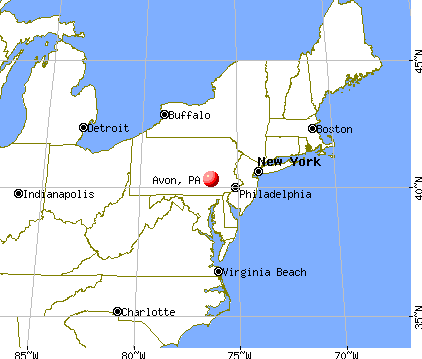
Nearest city with pop. 50,000+: Lancaster, PA (21.6 miles , pop. 56,348).
Nearest city with pop. 200,000+: Philadelphia, PA (69.9 miles , pop. 1,517,550).
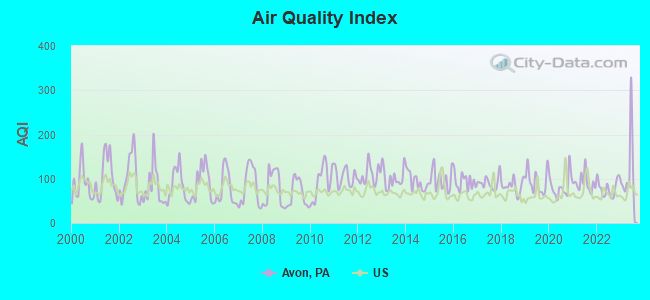
Air Quality Index (AQI) level in 2023 was 108. This is significantly worse than average.
City:
108
U.S.:
73
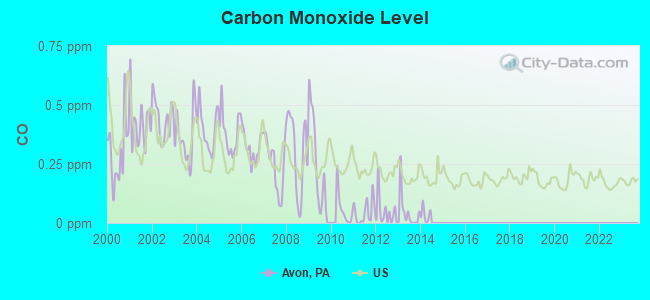
Carbon Monoxide (CO) [ppm] level in 2013 was 0.0450. This is significantly better than average.Closest monitor was 21.4 miles away from the city center.
City:
0.0450
U.S.:
0.2513
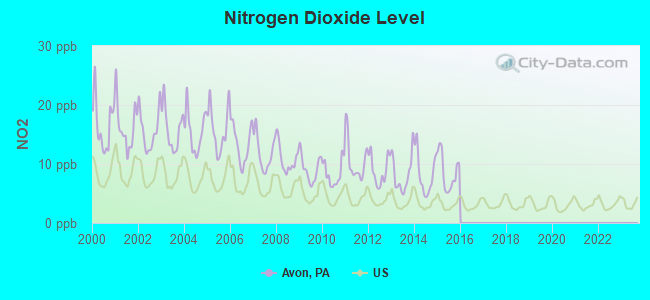
Nitrogen Dioxide (NO2) [ppb] level in 2015 was 8.57. This is significantly worse than average.Closest monitor was 21.4 miles away from the city center.
City:
8.57
U.S.:
5.11
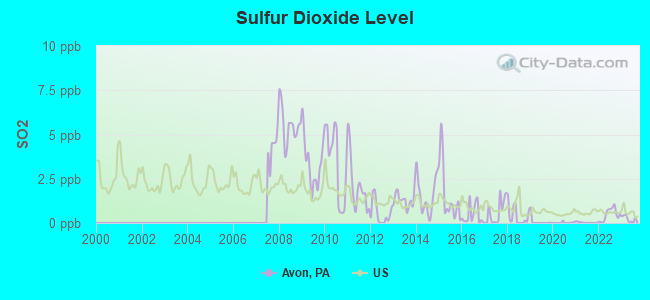
Sulfur Dioxide (SO2) [ppb] level in 2023 was 0.247. This is significantly better than average.Closest monitor was 16.4 miles away from the city center.
City:
0.247
U.S.:
1.515
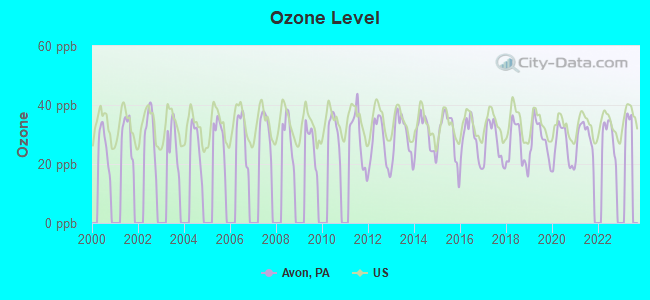
Ozone [ppb] level in 2022 was 29.9. This is about average.Closest monitor was 0.6 miles away from the city center.
City:
29.9
U.S.:
33.3
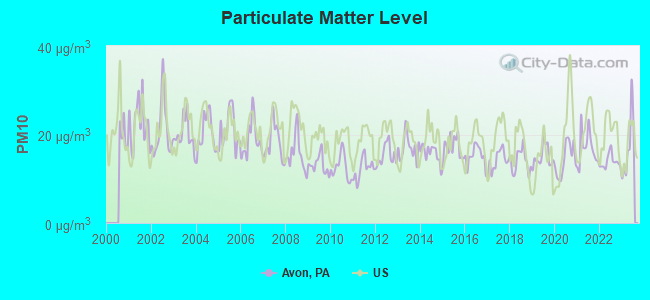
Particulate Matter (PM10) [µg/m3] level in 2023 was 17.3. This is about average.Closest monitor was 16.4 miles away from the city center.
City:
17.3
U.S.:
19.2
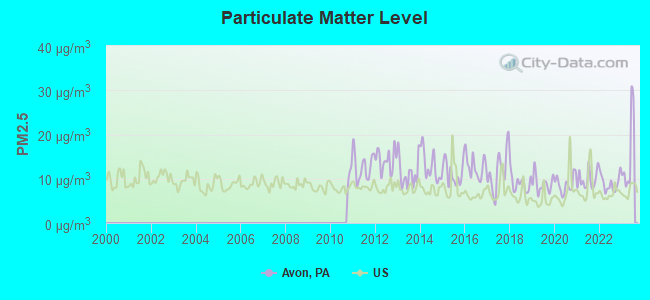
Particulate Matter (PM2.5) [µg/m3] level in 2023 was 15.4. This is significantly worse than average.Closest monitor was 0.6 miles away from the city center.
City:
15.4
U.S.:
8.1
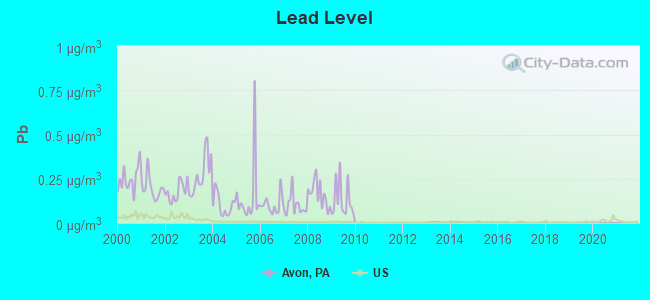
Lead (Pb) [µg/m3] level in 2016 was 0.00290. This is significantly better than average.Closest monitor was 12.5 miles away from the city center.
City:
0.00290
U.S.:
0.00931
Tornado activity:
Avon-area historical tornado activity is slightly above Pennsylvania state average. It is 14% greater than the overall U.S. average.
On 6/18/1970, a category F3 (max. wind speeds 158-206 mph) tornado 5.9 miles away from the Avon place center killed one personand injured 5 peopleand causedbetween $500,000 and $5,000,000 in damages.
On 7/14/2004, a category F3 tornado 11.2 miles away from the place center caused $18 million in damages.
Earthquake activity:
Avon-area historical earthquake activity is significantly above Pennsylvania state average. It is 64% smaller than the overall U.S. average.
On 8/23/2011 at 17:51:04, a magnitude 5.8 (5.8 MW, Depth: 3.7 mi, Class: Moderate, Intensity: VI - VII) earthquake occurred 187.9 miles away from Avon center On 1/16/1994 at 01:49:16, a magnitude 4.6 (4.6 MB, 4.6 LG, Depth: 3.1 mi, Class: Light, Intensity: IV - V) earthquake occurred 18.5 miles away from Avon center On 9/25/1998 at 19:52:52, a magnitude 5.2 (4.8 MB, 4.3 MS, 5.2 LG, 4.5 MW, Depth: 3.1 mi) earthquake occurred 224.0 miles away from Avon center On 1/16/1994 at 00:42:43, a magnitude 4.2 (4.2 MB, 4.0 LG, Depth: 3.1 mi) earthquake occurred 20.1 miles away from the city center On 10/7/1983 at 10:18:46, a magnitude 5.3 (5.1 MB, 5.3 LG, 5.1 ML) earthquake occurred 270.6 miles away from the city center On 1/31/1986 at 16:46:43, a magnitude 5.0 (5.0 MB) earthquake occurred 263.9 miles away from Avon center Magnitude types: regional Lg-wave magnitude (LG), body-wave magnitude (MB), local magnitude (ML), surface-wave magnitude (MS), moment magnitude (MW)
Natural disasters:
The number of natural disasters in Lebanon County (17) is near the US average (15). Major Disasters (Presidential) Declared: 13 Emergencies Declared: 4
Causes of natural disasters: Floods: 4, Storms: 4, Winter Storms: 4, Snowstorms: 3, Tropical Storms: 3, Hurricanes: 2, Blizzard: 1, Heavy Rain: 1, Mudslide: 1, Snowfall: 1, Tropical Depression: 1, Other: 1 (Note: some incidents may be assigned to more than one category).
Hospitals and medical centers near Avon:
RENOVA CENTER (Hospital, about 1 miles away; LEBANON, PA)
GSH DIALYSIS, INC. (Dialysis Facility, about 2 miles away; LEBANON, PA)
SPANG CREST MANOR (Nursing Home, about 3 miles away; LEBANON, PA)
MANORCARE HEALTH SERVICES-LEBANON (Nursing Home, about 3 miles away; LEBANON, PA)
LEBANON VA MEDICAL CENTER (Hospital, Acute Care - Veterans Administration, about 3 miles away; LEBANON, PA)
OAKVIEW (Nursing Home, about 3 miles away; LEBANON, PA)
VNA DEPT OF GOOD SAM HOSP (Home Health Center, about 3 miles away; LEBANON, PA)
Amtrak stations near Avon:
18 miles: MOUNT JOY (DELTA & HENRY STS.) . Services: public payphones, free short-term parking, call for taxi service, public transit connection.
19 miles: ELIZABETHTOWN (WILSON AVE.) . Services: public payphones, free short-term parking, free long-term parking, call for taxi service.
Colleges/universities with over 2000 students nearest to Avon:
Franklin and Marshall College (about 21 miles; Lancaster, PA; Full-time enrollment: 2,585)
Pennsylvania State University-Penn State Harrisburg (about 22 miles; Middletown, PA; FT enrollment: 3,797)
Pennsylvania State University-Penn State Berks (about 22 miles; Reading, PA; FT enrollment: 2,605)
Alvernia University (about 24 miles; Reading, PA; FT enrollment: 2,461)
Reading Area Community College (about 24 miles; Reading, PA; FT enrollment: 2,941)
Millersville University of Pennsylvania (about 25 miles; Millersville, PA; FT enrollment: 7,743)
McCann School of Business & Technology (about 25 miles; Pottsville, PA; FT enrollment: 3,412)
Biggest private elementary/middle schools in Avon:
PEQUEA CHRISTIAN SCHOOL (Students: 63, Location: 115 BLANK RD, Grades: 1-8)
SILVER HILL SCHOOL (Students: 38, Location: 1114 OAKLYN DR, Grades: 1-8)
LANDIS HILL SCHOOL (Students: 35, Location: 2225 VALLEY VIEW RD, Grades: KG-8)
MILL RUN SCHOOL (Students: 32, Location: 305 MILL RD, Grades: 1-8)
RED HILL PAROCHIAL SCHOOL (Students: 30, Location: 599 RED HILL RD, Grades: 1-8)
Notable locations in Avon: Lebanon County Home (A), Citizens Fire Company of Avon Station 27 (B), Hebron Hose Company 1 Station 26 (C). Display/hide their locations on the map
Lebanon County has a predicted average indoor radon screening level greater than 4 pCi/L (pico curies per liter) - Highest Potential
Average household size:
This place:
2.6 people
Pennsylvania:
2.5 people
Percentage of family households:
This place:
72.2%
Whole state:
65.0%
Percentage of households with unmarried partners:
This place:
6.4%
Whole state:
6.6%
Likely homosexual households (counted as self-reported same-sex unmarried-partner households)
Lesbian couples: 0.3% of all households
Gay men: 0.0% of all households
People in group quarters in Avon in 2000:
340 people in nursing homes
299 people in local jails and other confinement facilities (including police lockups)
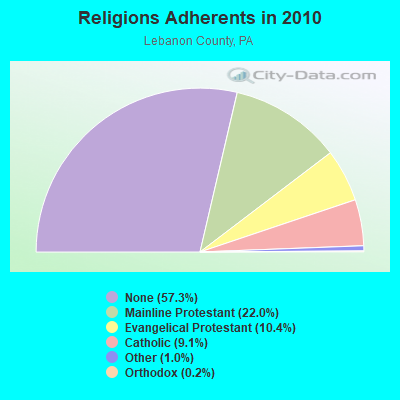
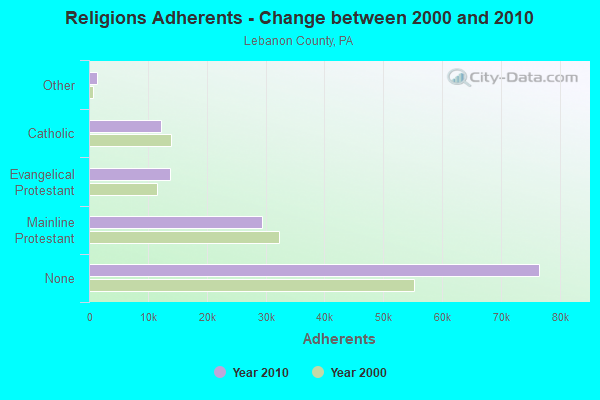
Religion statistics for Avon, PA (based on Lebanon County data)
Religion
Adherents
Congregations
Mainline Protestant
29,373
80
Evangelical Protestant
13,839
97
Catholic
12,218
8
Other
1,294
5
Orthodox
228
2
Black Protestant
55
1
None
76,561
-
Source: Clifford Grammich, Kirk Hadaway, Richard Houseal, Dale E.Jones, Alexei Krindatch, Richie Stanley and Richard H.Taylor. 2012. 2010 U.S.Religion Census: Religious Congregations & Membership Study. Association of Statisticians of American Religious Bodies. Jones, Dale E., et al. 2002. Congregations and Membership in the United States 2000. Nashville, TN: Glenmary Research Center. Graphs represent county-level data
AVONPA, 2 Mi Ene Of City Of (Lat: 40.348139 Lon: -76.378889), Type: Tower, Structure height: 61 m, Call Sign: WNEI981, Assigned Frequencies: 6286.19 MHz, 6256.54 MHz, Grant Date: 04/09/2020, Expiration Date: 06/21/2030, Certifier: J. D Roberts, Registrant: Norfolk Southern, 650 West Peachtree St Nw, Atlanta, GA 30308, Phone: (404) 582-6244, Email:
Home Mortgage Disclosure Act Aggregated Statistics For Year 2009 (Based on 1 full tract)
A) FHA, FSA/RHS & VA Home Purchase Loans
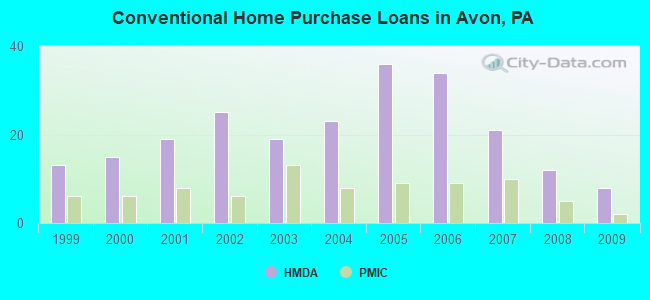
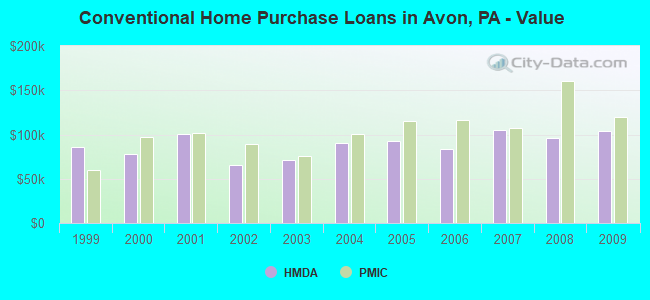
B) Conventional Home Purchase Loans
C) Refinancings
D) Home Improvement Loans
F) Non-occupant Loans on < 5 Family Dwellings (A B C & D)
Number
Average Value
Number
Average Value
Number
Average Value
Number
Average Value
Number
Average Value
LOANS ORIGINATED
15
$127,800
8
$103,500
38
$118,211
8
$28,000
4
$44,750
APPLICATIONS APPROVED, NOT ACCEPTED
0
$0
0
$0
2
$142,000
1
$15,000
0
$0
APPLICATIONS DENIED
0
$0
1
$111,000
10
$118,500
4
$19,250
0
$0
APPLICATIONS WITHDRAWN
0
$0
0
$0
8
$147,875
1
$20,000
0
$0
FILES CLOSED FOR INCOMPLETENESS
0
$0
0
$0
1
$76,000
0
$0
0
$0
Aggregated Statistics For Year 2008 (Based on 1 full tract)
A) FHA, FSA/RHS & VA Home Purchase Loans
B) Conventional Home Purchase Loans
C) Refinancings
D) Home Improvement Loans
F) Non-occupant Loans on < 5 Family Dwellings (A B C & D)
Number
Average Value
Number
Average Value
Number
Average Value
Number
Average Value
Number
Average Value
LOANS ORIGINATED
15
$124,800
12
$96,250
45
$116,600
6
$35,667
6
$85,833
APPLICATIONS APPROVED, NOT ACCEPTED
0
$0
1
$40,000
7
$93,429
1
$120,000
1
$40,000
APPLICATIONS DENIED
0
$0
3
$153,000
26
$128,577
8
$41,750
1
$100,000
APPLICATIONS WITHDRAWN
1
$172,000
5
$121,200
3
$56,333
0
$0
0
$0
FILES CLOSED FOR INCOMPLETENESS
0
$0
2
$138,500
0
$0
0
$0
0
$0
Aggregated Statistics For Year 2007 (Based on 1 full tract)
A) FHA, FSA/RHS & VA Home Purchase Loans
B) Conventional Home Purchase Loans
C) Refinancings
D) Home Improvement Loans
F) Non-occupant Loans on < 5 Family Dwellings (A B C & D)
G) Loans On Manufactured Home Dwelling (A B C & D)
Number
Average Value
Number
Average Value
Number
Average Value
Number
Average Value
Number
Average Value
Number
Average Value
LOANS ORIGINATED
4
$129,000
21
$105,238
40
$81,400
8
$37,375
6
$53,333
1
$115,000
APPLICATIONS APPROVED, NOT ACCEPTED
1
$98,000
2
$20,500
8
$100,500
1
$4,000
1
$67,000
1
$21,000
APPLICATIONS DENIED
1
$112,000
5
$76,200
42
$99,548
7
$14,143
1
$10,000
1
$53,000
APPLICATIONS WITHDRAWN
0
$0
3
$84,000
11
$91,273
1
$266,000
0
$0
0
$0
FILES CLOSED FOR INCOMPLETENESS
0
$0
1
$70,000
5
$102,800
0
$0
0
$0
0
$0
Aggregated Statistics For Year 2006 (Based on 1 full tract)
A) FHA, FSA/RHS & VA Home Purchase Loans
B) Conventional Home Purchase Loans
C) Refinancings
D) Home Improvement Loans
F) Non-occupant Loans on < 5 Family Dwellings (A B C & D)
G) Loans On Manufactured Home Dwelling (A B C & D)
Number
Average Value
Number
Average Value
Number
Average Value
Number
Average Value
Number
Average Value
Number
Average Value
LOANS ORIGINATED
4
$119,250
34
$83,706
46
$78,565
17
$33,647
8
$47,500
1
$83,000
APPLICATIONS APPROVED, NOT ACCEPTED
0
$0
4
$98,750
9
$87,000
0
$0
1
$180,000
0
$0
APPLICATIONS DENIED
0
$0
7
$86,000
35
$83,114
8
$30,500
1
$48,000
2
$14,500
APPLICATIONS WITHDRAWN
0
$0
3
$91,000
14
$91,857
0
$0
0
$0
0
$0
FILES CLOSED FOR INCOMPLETENESS
0
$0
0
$0
2
$136,500
0
$0
0
$0
0
$0
Aggregated Statistics For Year 2005 (Based on 1 full tract)
A) FHA, FSA/RHS & VA Home Purchase Loans
B) Conventional Home Purchase Loans
C) Refinancings
D) Home Improvement Loans
F) Non-occupant Loans on < 5 Family Dwellings (A B C & D)
Number
Average Value
Number
Average Value
Number
Average Value
Number
Average Value
Number
Average Value
LOANS ORIGINATED
2
$77,000
36
$92,306
44
$90,295
20
$29,000
4
$77,750
APPLICATIONS APPROVED, NOT ACCEPTED
0
$0
5
$89,800
12
$117,750
0
$0
0
$0
APPLICATIONS DENIED
0
$0
4
$102,500
38
$92,842
5
$22,000
1
$19,000
APPLICATIONS WITHDRAWN
0
$0
1
$170,000
31
$78,581
2
$61,000
0
$0
FILES CLOSED FOR INCOMPLETENESS
0
$0
0
$0
3
$54,333
0
$0
0
$0
Aggregated Statistics For Year 2004 (Based on 1 full tract)
A) FHA, FSA/RHS & VA Home Purchase Loans
B) Conventional Home Purchase Loans
C) Refinancings
D) Home Improvement Loans
F) Non-occupant Loans on < 5 Family Dwellings (A B C & D)
G) Loans On Manufactured Home Dwelling (A B C & D)
Number
Average Value
Number
Average Value
Number
Average Value
Number
Average Value
Number
Average Value
Number
Average Value
LOANS ORIGINATED
2
$82,000
23
$90,739
49
$79,347
10
$26,400
1
$110,000
0
$0
APPLICATIONS APPROVED, NOT ACCEPTED
0
$0
3
$103,333
6
$84,667
3
$37,333
0
$0
1
$65,000
APPLICATIONS DENIED
0
$0
4
$76,750
66
$75,076
5
$43,000
2
$48,000
1
$60,000
APPLICATIONS WITHDRAWN
0
$0
3
$92,667
28
$92,857
4
$44,500
0
$0
1
$75,000
FILES CLOSED FOR INCOMPLETENESS
0
$0
0
$0
7
$108,286
0
$0
0
$0
0
$0
Aggregated Statistics For Year 2003 (Based on 1 full tract)
A) FHA, FSA/RHS & VA Home Purchase Loans
B) Conventional Home Purchase Loans
C) Refinancings
D) Home Improvement Loans
F) Non-occupant Loans on < 5 Family Dwellings (A B C & D)
Number
Average Value
Number
Average Value
Number
Average Value
Number
Average Value
Number
Average Value
LOANS ORIGINATED
1
$112,000
19
$71,526
67
$79,806
4
$33,750
2
$34,000
APPLICATIONS APPROVED, NOT ACCEPTED
0
$0
0
$0
16
$74,375
0
$0
0
$0
APPLICATIONS DENIED
0
$0
2
$72,500
40
$88,600
6
$19,333
1
$75,000
APPLICATIONS WITHDRAWN
0
$0
3
$72,667
21
$82,381
3
$28,333
1
$54,000
FILES CLOSED FOR INCOMPLETENESS
0
$0
0
$0
1
$95,000
1
$17,000
0
$0
Aggregated Statistics For Year 2002 (Based on 1 full tract)
A) FHA, FSA/RHS & VA Home Purchase Loans
B) Conventional Home Purchase Loans
C) Refinancings
D) Home Improvement Loans
F) Non-occupant Loans on < 5 Family Dwellings (A B C & D)
Number
Average Value
Number
Average Value
Number
Average Value
Number
Average Value
Number
Average Value
LOANS ORIGINATED
6
$83,833
25
$66,000
54
$63,833
11
$28,364
6
$38,333
APPLICATIONS APPROVED, NOT ACCEPTED
1
$52,000
7
$67,857
7
$68,429
0
$0
1
$52,000
APPLICATIONS DENIED
0
$0
3
$51,667
28
$84,036
3
$52,333
2
$58,000
APPLICATIONS WITHDRAWN
1
$127,000
3
$42,000
29
$91,379
0
$0
0
$0
FILES CLOSED FOR INCOMPLETENESS
0
$0
0
$0
9
$68,444
0
$0
0
$0
Aggregated Statistics For Year 2001 (Based on 1 full tract)
A) FHA, FSA/RHS & VA Home Purchase Loans
B) Conventional Home Purchase Loans
C) Refinancings
D) Home Improvement Loans
F) Non-occupant Loans on < 5 Family Dwellings (A B C & D)
Number
Average Value
Number
Average Value
Number
Average Value
Number
Average Value
Number
Average Value
LOANS ORIGINATED
8
$71,000
19
$100,947
44
$68,727
9
$16,111
2
$56,000
APPLICATIONS APPROVED, NOT ACCEPTED
0
$0
4
$63,000
7
$63,714
1
$18,000
1
$32,000
APPLICATIONS DENIED
0
$0
5
$69,200
26
$96,077
2
$9,000
2
$74,000
APPLICATIONS WITHDRAWN
0
$0
2
$26,500
20
$84,800
2
$37,500
2
$104,000
FILES CLOSED FOR INCOMPLETENESS
0
$0
0
$0
2
$66,500
0
$0
0
$0
Aggregated Statistics For Year 2000 (Based on 1 full tract)
A) FHA, FSA/RHS & VA Home Purchase Loans
B) Conventional Home Purchase Loans
C) Refinancings
D) Home Improvement Loans
F) Non-occupant Loans on < 5 Family Dwellings (A B C & D)
Number
Average Value
Number
Average Value
Number
Average Value
Number
Average Value
Number
Average Value
LOANS ORIGINATED
7
$70,857
15
$77,600
29
$36,379
10
$24,100
4
$46,000
APPLICATIONS APPROVED, NOT ACCEPTED
0
$0
1
$86,000
8
$77,500
0
$0
0
$0
APPLICATIONS DENIED
1
$94,000
6
$46,500
24
$54,167
2
$20,500
1
$47,000
APPLICATIONS WITHDRAWN
0
$0
2
$95,500
8
$57,000
1
$40,000
0
$0
FILES CLOSED FOR INCOMPLETENESS
0
$0
0
$0
7
$54,286
0
$0
0
$0
Aggregated Statistics For Year 1999 (Based on 1 full tract)
A) FHA, FSA/RHS & VA Home Purchase Loans
B) Conventional Home Purchase Loans
C) Refinancings
D) Home Improvement Loans
E) Loans on Dwellings For 5+ Families
F) Non-occupant Loans on < 5 Family Dwellings (A B C & D)
#33 on the list of "Top 101 cities with the largest percentage of people in local jails and other confinement facilities (including police lockups) (population 1,000+)"
#39 on the list of "Top 101 cities with the largest percentage of people in nursing homes (population 1,000+)"
#93 (17042) on the list of "Top 101 zip codes with the most beauty salons in 2005"
#10 on the list of "Top 101 counties with the highest Particulate Matter (PM2.5) Annual air pollution readings in 2012 (µg/m3)"
#29 on the list of "Top 101 counties with the largest increase in the number of births per 1000 residents 2000-2006 to 2007-2013 (pop 50,000+)"
#29 on the list of "Top 101 counties with the lowest total withdrawal of fresh water for public supply (pop. 50,000+)"
#51 on the list of "Top 101 counties with the lowest surface withdrawal of fresh water for public supply (pop. 50,000+)"
#61 on the list of "Top 101 counties with the lowest percentage of residents relocating to other counties in 2011 (pop. 50,000+)"


 Recent articles from our blog. Our writers, many of them Ph.D. graduates or candidates, create easy-to-read articles on a wide variety of topics.

 (21.6 miles