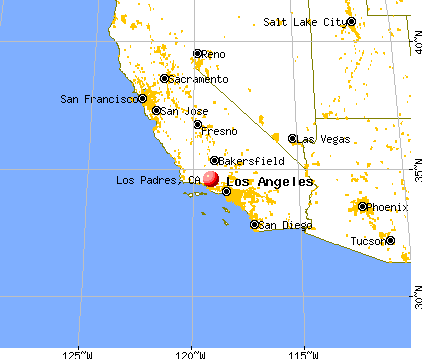
Los Padres, California
Submit your own pictures of this place and show them to the world
- OSM Map
- General Map
- Google Map
- MSN Map

| Males: 403 | |
| Females: 382 |
| Median resident age: | 45.0 years |
| California median age: | 33.3 years |
Zip code: 93023
| Los Padres: | $97,924 |
| CA: | $91,551 |
Estimated per capita income in 2022: $54,830 (it was $28,013 in 2000)
Los Padres CCD income, earnings, and wages data
Estimated median house or condo value in 2022: $662,249 (it was $198,600 in 2000)
| Los Padres: | $662,249 |
| CA: | $715,900 |
Mean prices in 2022: all housing units: $901,184; detached houses: $999,306; townhouses or other attached units: $610,170; in 2-unit structures: $496,599; in 3-to-4-unit structures: $548,973; in 5-or-more-unit structures: $472,197; mobile homes: $230,708; occupied boats, rvs, vans, etc.: $13,785
Detailed information about poverty and poor residents in Los Padres, CA
Compare current foreclosures near Los Padres, CA:
| Photo | Address | Area | Beds / Baths | Price | Details |
|---|---|---|---|---|---|

|
#1
Zermatt Ct
Frazier Park, CA 93222
|
1,270 sq. feet
|
2 baths 3 beds |
show details | |

|
#2
Drown Ave
Ojai, CA 93023
|
960 sq. feet
|
1 baths 2 beds |
show details | |

|
#3
Foothill Rd
Ojai, CA 93023
|
3,474 sq. feet
|
3 baths 3 beds |
show details | |

|
#4
Pioneer Way
Frazier Park, CA 93222
|
960 sq. feet
|
1 baths 2 beds |
show details | |

|
#5
El Conejo Dr
Ojai, CA 93023
|
2,647 sq. feet
|
3 baths 4 beds |
show details | |

|
#6
Zermatt Dr
Frazier Park, CA 93222
|
952 sq. feet
|
2 baths 2 beds |
show details | |

|
#7
S Padre Juan Ave
Ojai, CA 93023
|
1,057 sq. feet
|
1 baths 1 beds |
show details | |

|
#8
S Lomita Ave
Ojai, CA 93023
|
2,174 sq. feet
|
2 baths 4 beds |
show details | |

|
#9
Ashwood Ct
Frazier Park, CA 93222
|
1,248 sq. feet
|
2 baths 2 beds |
show details | |

|
#10
Zion Way
Frazier Park, CA 93222
|
2,962 sq. feet
|
2 baths 4 beds |
show details |
| Photo | Address | Area | Beds / Baths | Price | Details |
|---|---|---|---|---|---|

|
#11
Matterhorn Dr
Frazier Park, CA 93222
|
1,831 sq. feet
|
2 baths 3 beds |
show details | |

|
#12
Dawn Ct
Frazier Park, CA 93222
|
1,728 sq. feet
|
3 baths 2 beds |
show details | |

|
#13
Zermatt Dr
Frazier Park, CA 93222
|
2,093 sq. feet
|
3 baths 3 beds |
show details | |

|
#14
Shady Ln
Ojai, CA 93023
|
1,180 sq. feet
|
1 baths 3 beds |
show details | |

|
#15
Drown Ave
Ojai, CA 93023
|
1,481 sq. feet
|
2 baths 4 beds |
show details | |

|
#16
Santa Ana Blvd
Oak View, CA 93022
|
1,298 sq. feet
|
2 baths 3 beds |
show details | |

|
#17
Nova Ln
Ojai, CA 93023
|
960 sq. feet
|
- baths 2 beds |
show details | |

|
#18
Burnham Rd
Oak View, CA 93022
|
1,618 sq. feet
|
2 baths 3 beds |
show details | |

|
#19
Sierra Rd
Ojai, CA 93023
|
3,197 sq. feet
|
3 baths 5 beds |
show details | |

|
#20
N Lomita Ave
Ojai, CA 93023
|
1,622 sq. feet
|
2 baths 3 beds |
show details |
| Photo | Address | Area | Beds / Baths | Price | Details |
|---|---|---|---|---|---|

|
#21
Walbridge Way
Ojai, CA 93023
|
2,138 sq. feet
|
2 baths 4 beds |
show details | |

|
#22
Amber Dr
Santa Paula, CA 93060
|
2,333 sq. feet
|
2 baths 4 beds |
show details | |

|
#23
Pioneer Way
Frazier Park, CA 93222
|
- sq. feet
|
- baths - beds |
show details | |

|
#24
Linden Dr
Frazier Park, CA 93222
|
- sq. feet
|
- baths - beds |
show details | |

|
#25
Zermatt Dr
Frazier Park, CA 93222
|
- sq. feet
|
- baths - beds |
show details | |

|
#26
Linden Dr
Frazier Park, CA 93222
|
- sq. feet
|
- baths - beds |
show details | |

|
#27
Rockaway Rd
Oak View, CA 93022
|
- sq. feet
|
- baths - beds |
show details | |

|
#28
Chestnut Dr
Frazier Park, CA 93222
|
- sq. feet
|
- baths - beds |
show details | |

|
#29
Chestnut Dr
Frazier Park, CA 93222
|
- sq. feet
|
- baths - beds |
show details | |

|
#30
Freeman Ct
Frazier Park, CA 93222
|
- sq. feet
|
- baths - beds |
show details |
| Photo | Address | Area | Beds / Baths | Price | Details |
|---|---|---|---|---|---|

|
#31
Zion Way
Frazier Park, CA 93222
|
- sq. feet
|
- baths - beds |
show details | |

|
#32
Don Antonio Way
Ojai, CA 93023
|
- sq. feet
|
- baths - beds |
show details | |

|
Check over 1 million property listings on Foreclosure.com!
|
browse all offers | |||

- 63584.4%White alone
- 8311.0%Hispanic
- 212.8%Two or more races
- 50.7%Asian alone
- 40.5%American Indian alone
- 30.4%Other race alone
- 10.1%Black alone

 Recent articles from our blog. Our writers, many of them Ph.D. graduates or candidates, create easy-to-read articles on a wide variety of topics.
Current Local Time: PST time zone
Land area: 918.4 square miles.
Population density: 0.9 people per square mile (very low).
| Los Padres CCD: | 0.8% ($1,530) |
| California: | 0.8% ($1,564) |
Nearest city with pop. 50,000+: Ventura, CA  (22.4 miles , pop. 106,197).
Nearest city with pop. 200,000+: Bakersfield, CA (52.9 miles , pop. 247,057).
Nearest city with pop. 1,000,000+: Los Angeles, CA (56.8 miles , pop. 3,694,820).
Nearest cities:
), ), Latitude: 34.60 N, Longitude: 119.15 W
Area code commonly used in this area: 805


| Here: | 4.7% |
| California: | 5.1% |

- Public administration (10.4%)
- Educational services (10.1%)
- Agriculture, forestry, fishing & hunting (8.5%)
- Professional, scientific, technical services (6.7%)
- Utilities (5.2%)
- Publishing, motion picture & sound recording industries (4.9%)
- Motor vehicle & parts dealers (4.7%)

- Agriculture, forestry, fishing & hunting (12.8%)
- Professional, scientific, technical services (9.3%)
- Utilities (8.8%)
- Public administration (8.4%)
- Publishing, motion picture & sound recording industries (6.6%)
- Motor vehicle & parts dealers (6.2%)
- Educational services (6.2%)

- Educational services (15.6%)
- Public administration (13.1%)
- Health care (10.0%)
- Finance & insurance (5.0%)
- Data processing, libraries, other information services (4.4%)
- Real estate & rental & leasing (4.4%)
- Drugs, sundries, chemical & allied products merchant wholesalers (3.8%)

- Other production occupations, including supervisors (7.0%)
- Law enforcement workers, including supervisors (4.7%)
- Other office and administrative support workers, including supervisors (4.4%)
- Art and design workers (4.1%)
- Other sales and related occupations, including supervisors (3.9%)
- Other management occupations, except farmers and farm managers (3.6%)
- Metal workers and plastic workers (3.6%)

- Other production occupations, including supervisors (11.9%)
- Law enforcement workers, including supervisors (8.0%)
- Metal workers and plastic workers (6.2%)
- Farmers and farm managers (5.8%)
- Art and design workers (5.8%)
- Agricultural workers, including supervisors (4.4%)
- Electricians (4.4%)

- Other office and administrative support workers, including supervisors (10.6%)
- Secretaries and administrative assistants (8.8%)
- Sales representatives, services, wholesale and manufacturing (6.2%)
- Preschool, kindergarten, elementary, and middle school teachers (5.6%)
- Building and grounds cleaning and maintenance occupations (5.0%)
- Financial clerks, except bookkeeping, accounting and auditing clerks (5.0%)
- Librarians, curators, and archivists (4.4%)
Average climate in Los Padres, California
Based on data reported by over 4,000 weather stations


(lower is better)

Air Quality Index (AQI) level in 2023 was 52.5. This is better than average.
| City: | 52.5 |
| U.S.: | 72.6 |

Carbon Monoxide (CO) [ppm] level in 2003 was 0.432. This is significantly worse than average. Closest monitor was 11.8 miles away from the city center.
| City: | 0.432 |
| U.S.: | 0.251 |

Nitrogen Dioxide (NO2) [ppb] level in 2023 was 2.34. This is significantly better than average. Closest monitor was 11.3 miles away from the city center.
| City: | 2.34 |
| U.S.: | 5.11 |

Ozone [ppb] level in 2023 was 28.4. This is about average. Closest monitor was 11.1 miles away from the city center.
| City: | 28.4 |
| U.S.: | 33.3 |

Particulate Matter (PM10) [µg/m3] level in 2023 was 17.8. This is about average. Closest monitor was 11.3 miles away from the city center.
| City: | 17.8 |
| U.S.: | 19.2 |

Particulate Matter (PM2.5) [µg/m3] level in 2023 was 3.96. This is significantly better than average. Closest monitor was 11.3 miles away from the city center.
| City: | 3.96 |
| U.S.: | 8.11 |
Earthquake activity:
Los Padres-area historical earthquake activity is significantly above California state average. It is 7075% greater than the overall U.S. average.On 7/21/1952 at 11:52:14, a magnitude 7.7 (7.7 UK, Class: Major, Intensity: VIII - XII) earthquake occurred 29.1 miles away from the city center, causing $50,000,000 total damage
On 11/4/1927 at 13:51:53, a magnitude 7.5 (7.5 UK) earthquake occurred 108.9 miles away from Los Padres center
On 6/28/1992 at 11:57:34, a magnitude 7.6 (6.2 MB, 7.6 MS, 7.3 MW, Depth: 0.7 mi) earthquake occurred 152.4 miles away from the city center, causing 3 deaths (1 shaking deaths, 2 other deaths) and 400 injuries, causing $100,000,000 total damage and $40,000,000 insured losses
On 10/16/1999 at 09:46:44, a magnitude 7.4 (6.3 MB, 7.4 MS, 7.2 MW, 7.3 ML) earthquake occurred 155.0 miles away from Los Padres center
On 1/17/1994 at 12:30:55, a magnitude 6.8 (6.4 MB, 6.8 MS, 6.7 MW, Depth: 11.4 mi, Class: Strong, Intensity: VII - IX) earthquake occurred 45.0 miles away from Los Padres center, causing 60 deaths (60 shaking deaths) and 7000 injuries
On 4/18/1906 at 13:12:21, a magnitude 7.9 (7.9 UK) earthquake occurred 318.2 miles away from Los Padres center, causing $524,000,000 total damage
Magnitude types: body-wave magnitude (MB), local magnitude (ML), surface-wave magnitude (MS), moment magnitude (MW)
Natural disasters:
The number of natural disasters in Ventura County (36) is a lot greater than the US average (15).Major Disasters (Presidential) Declared: 24
Emergencies Declared: 2
Causes of natural disasters: Fires: 17, Floods: 16, Storms: 10, Landslides: 5, Mudslides: 4, Winter Storms: 4, Freezes: 2, Heavy Rains: 2, Earthquake: 1, Hurricane: 1, Snow: 1, Tornado: 1, Wind: 1, Other: 1 (Note: some incidents may be assigned to more than one category).
Amtrak stations near Los Padres:
- 18 miles: SANTA PAULA (245 S. PALM AVE.) - Bus Station . Services: fully wheelchair accessible, public payphones, full-service food facilities, public transit connection.
- 20 miles: FILLMORE (718 VENTURA ST.) - Bus Station . Services: fully wheelchair accessible, public payphones, full-service food facilities, free short-term parking, call for taxi service, public transit connection.
Colleges/universities with over 2000 students nearest to Los Padres:
- Ventura College (about 23 miles; Ventura, CA; Full-time enrollment: 8,460)
- Moorpark College (about 28 miles; Moorpark, CA; FT enrollment: 9,338)
- Oxnard College (about 30 miles; Oxnard, CA; FT enrollment: 3,879)
- California Lutheran University (about 31 miles; Thousand Oaks, CA; FT enrollment: 4,103)
- California State University-Channel Islands (about 31 miles; Camarillo, CA; FT enrollment: 4,163)
- Santa Barbara City College (about 34 miles; Santa Barbara, CA; FT enrollment: 12,568)
- College of the Canyons (about 36 miles; Santa Clarita, CA; FT enrollment: 11,307)
Points of interest:
Notable locations in Los Padres: Oak Flat Campground (A), Willet (B), Harman Campground (C), Thatcher Campground (D), Horsetheif (E), Ladybug Campsite (F), Monolith Cement Company (G), Nettle Spring Recreation site (H), Ortega Rustic Campsite (I), Kesters Camp (J), Hathaway Ranch (K), Jackson Camp (L), Hollister Campground (M), Laguna Ranch (N), Last Chance Camp (O), Hardluck Campground (P), Halfway Spring Campsite (Q), Ellis Apiary Campsite (R), Dorman Ranch (S), Dominguez Campground (T). Display/hide their locations on the map
Lakes and reservoirs: Lower Rose Lake (A), Upper Rose Lake (B), Matilija Lake (C), Murietta Dam (D). Display/hide their locations on the map
Streams, rivers, and creeks: Oak Creek (A), North Fork Santa Ana Creek (B), East Fork Coyote Creek (C), Derrydale Creek (D), Mutau Creek (E), Michael Creek (F), Cherry Creek (G), Matilija Creek (H), Maple Creek (I). Display/hide their locations on the map
Parks in Los Padres include: Hungry Valley Oak Woodland Natural Preserve (1), Sespe Condor Sanctuary (2). Display/hide their locations on the map
| This place: | 2.2 people |
| California: | 2.9 people |
| This place: | 61.6% |
| Whole state: | 68.7% |
| This place: | 6.5% |
| Whole state: | 7.2% |
Likely homosexual households (counted as self-reported same-sex unmarried-partner households)
- Lesbian couples: 1.3% of all households
- Gay men: 0.8% of all households
| This place: | 7.5% |
| Whole state: | 14.2% |
| This place: | 4.9% |
| Whole state: | 6.3% |
3 people in other noninstitutional group quarters in 2000
For population 15 years and over in Los Padres:

- Never married: 14.6%
- Now married: 70.7%
- Separated: 1.3%
- Widowed: 1.9%
- Divorced: 12.8%
For population 25 years and over in Los Padres:
- High school or higher: 89.5%
- Bachelor's degree or higher: 29.2%
- Graduate or professional degree: 10.9%
- Unemployed: 8.7%
- Mean travel time to work (commute): 35.5 minutes


| Here: | 9.8 |
| California average: | 16.1 |
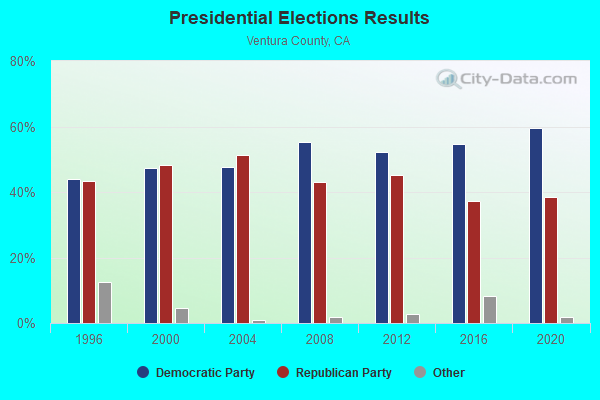
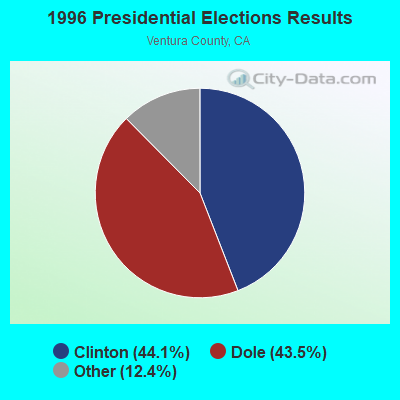
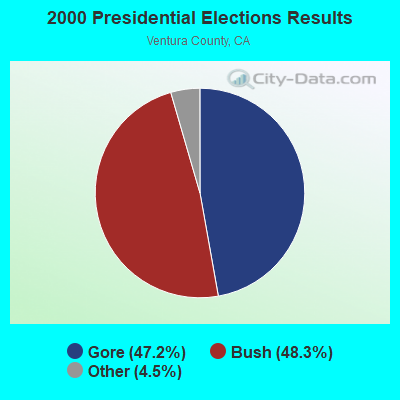
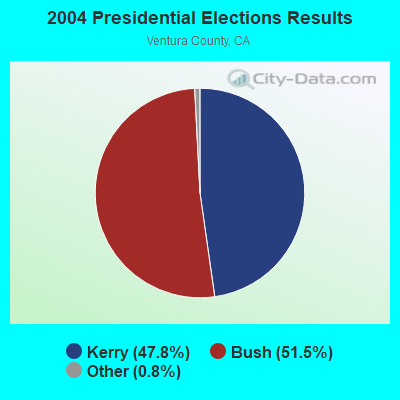
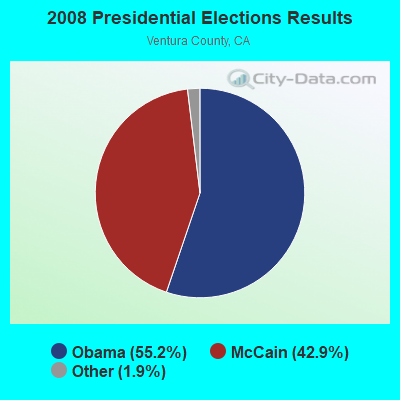
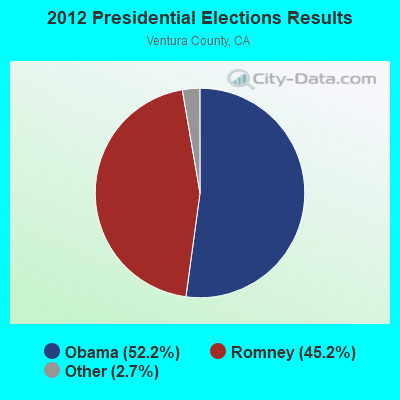
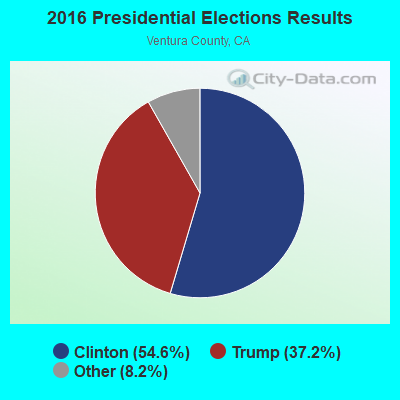
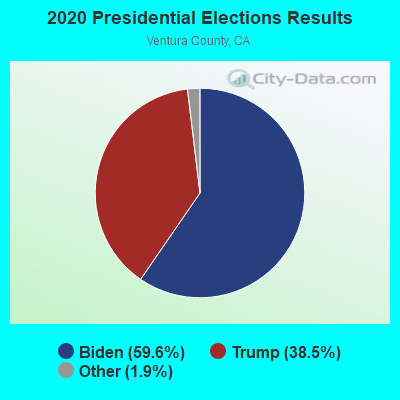
Graphs represent county-level data. Detailed 2008 Election Results
Religion statistics for Los Padres, CA (based on Ventura County data)
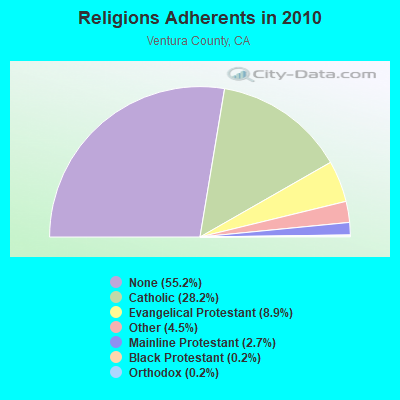
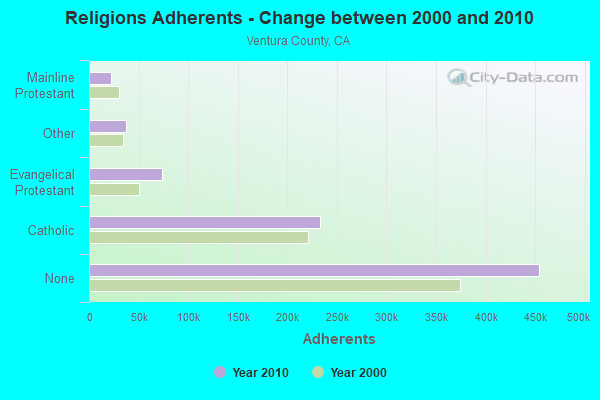
| Religion | Adherents | Congregations |
|---|---|---|
| Catholic | 232,571 | 20 |
| Evangelical Protestant | 73,341 | 268 |
| Other | 37,398 | 118 |
| Mainline Protestant | 22,006 | 65 |
| Black Protestant | 1,986 | 4 |
| Orthodox | 1,680 | 7 |
| None | 454,336 | - |
Food Environment Statistics:
| This county: | 1.97 / 10,000 pop. |
| State: | 2.14 / 10,000 pop. |
| Ventura County: | 0.05 / 10,000 pop. |
| State: | 0.04 / 10,000 pop. |
| Ventura County: | 0.57 / 10,000 pop. |
| California: | 0.62 / 10,000 pop. |
| Ventura County: | 1.69 / 10,000 pop. |
| State: | 1.49 / 10,000 pop. |
| Ventura County: | 7.28 / 10,000 pop. |
| California: | 7.42 / 10,000 pop. |
| This county: | 7.4% |
| California: | 7.3% |
| Here: | 23.1% |
| State: | 21.3% |
| This county: | 19.0% |
| State: | 17.9% |
4.96% of this county's 2021 resident taxpayers lived in other counties in 2020 ($110,211 average adjusted gross income)
| Here: | 4.96% |
| California average: | 5.19% |
0.03% of residents moved from foreign countries ($345 average AGI)
Ventura County: 0.03% California average: 0.03%
Top counties from which taxpayers relocated into this county between 2020 and 2021:
| from Los Angeles County, CA | |
| from Santa Barbara County, CA | |
| from Orange County, CA |
5.51% of this county's 2020 resident taxpayers moved to other counties in 2021 ($95,405 average adjusted gross income)
| Here: | 5.51% |
| California average: | 6.14% |
0.02% of residents moved to foreign countries ($247 average AGI)
Ventura County: 0.02% California average: 0.02%
Top counties to which taxpayers relocated from this county between 2020 and 2021:
| to Los Angeles County, CA | |
| to San Diego County, CA | |
| to Santa Barbara County, CA |
Strongest AM radio stations in Los Padres:
- KACD (850 AM; 25 kW; THOUSAND OAKS, CA; Owner: CITICASTERS LICENSES, L.P.)
- KSPN (710 AM; 50 kW; LOS ANGELES, CA; Owner: KABC-AM RADIO, INC.)
- KIRN (670 AM; 35 kW; SIMI VALLEY, CA; Owner: LOTUS OXNARD CORP.)
- KLAC (570 AM; 50 kW; LOS ANGELES, CA; Owner: AMFM RADIO LICENSES, L.L.C.)
- KGDP (660 AM; 50 kW; ORCUTT, CA; Owner: RADIO REPRESENTATIVES, INC.)
- KFWB (980 AM; 50 kW; LOS ANGELES, CA; Owner: INFINITY BROADCASTING OPERATIONS, INC.)
- KOXR (910 AM; 5 kW; OXNARD, CA; Owner: LAZER BROADCASTING CORPORATION)
- KFI (640 AM; 50 kW; LOS ANGELES, CA; Owner: CAPSTAR TX LIMITED PARTNERSHIP)
- KNX (1070 AM; 50 kW; LOS ANGELES, CA; Owner: INFINITY BROADCASTING OPERATIONS, INC.)
- KERI (1180 AM; 50 kW; WASCO-GREENACRES, CA; Owner: KWSO, INC.)
- KSUR (1260 AM; 25 kW; BEVERLY HILLS, CA)
- KMAP (1050 AM; 10 kW; FRAZIER PARK, CA; Owner: KMAP, INC.)
- KBLA (1580 AM; 50 kW; SANTA MONICA, CA)
Strongest FM radio stations in Los Padres:
- K293AG (106.5 FM; TAFT, CA; Owner: CENTRO CRISTIANO DE FE, INC.)
- KLFH (89.5 FM; OJAI, CA; Owner: SHEPHERD COMMUNICATIONS, INC.)
- KMRO (90.3 FM; CAMARILLO, CA; Owner: THE ASSOCIATION FOR COMMUNITY EDUCATION, INC.)
- KCPB (91.1 FM; THOUSAND OAKS, CA; Owner: UNIVERSITY OF SOUTHERN CALIFORNIA)
- K254AH (98.7 FM; ISLA VISTA, CA; Owner: PACIFICA FOUNDATION, INC.)
- KCAQ (104.7 FM; OXNARD, CA; Owner: GOLD COAST BROADCASTING LLC)
- KOCP (95.9 FM; CAMARILLO, CA; Owner: GOLD COAST BROADCASTING LLC)
- K272DI (102.3 FM; FILLMORE, CA; Owner: SANTA MONICA COMMUNITY COLLEGE DIST.)
- KCZN (96.7 FM; SANTA PAULA, CA; Owner: LAZER BROADCASTING CORPORATION)
- KFYV (105.5 FM; OJAI, CA; Owner: GOLD COAST BROADCASTING LLC)
- K271AC (102.1 FM; OJAI, CA; Owner: SANTA MONICA COMMUNITY COLLEGE DIST.)
- KSSC (107.1 FM; VENTURA, CA; Owner: ENTRAVISION HOLDINGS, LLC)
- KHAY (100.7 FM; VENTURA, CA; Owner: CUMULUS LICENSING CORP.)
- KDAR (98.3 FM; OXNARD, CA; Owner: ATEP RADIO, INC.)
- K210CH (89.9 FM; OAK VIEW, CA; Owner: LIFE ON THE WAY COMMUNICATIONS, INC.)
- KRAZ (105.9 FM; SANTA YNEZ, CA; Owner: KNIGHT BROADCASTING, INC.)
- KRUZ (103.3 FM; SANTA BARBARA, CA; Owner: CUMULUS LICENSING CORP.)
- KSPE-FM (94.5 FM; ELLWOOD, CA; Owner: CITICASTERS LICENSES, L.P.)
- KMGQ (97.5 FM; SANTA BARBARA, CA; Owner: CUMULUS LICENSING CORP.)
- KCSB-FM (91.9 FM; SANTA BARBARA, CA; Owner: UNIVERSITY OF CALIFORNIA)
TV broadcast stations around Los Padres:
- KTRO-LP (Channel 50; LANCASTER, CA; Owner: ROBERT D. ADELMAN)
- KJLA (Channel 57; VENTURA, CA; Owner: KJLA, LLC)
- KADY-TV (Channel 63; OXNARD, CA; Owner: BILTMORE BROADCASTING, L.L.C.)

- 53.7%Bottled, tank, or LP gas
- 25.0%Wood
- 11.6%Utility gas
- 8.6%Electricity
- 1.1%Fuel oil, kerosene, etc.

- 41.4%Wood
- 40.0%Bottled, tank, or LP gas
- 18.6%Electricity
Los Padres compared to California state average:
- Unemployed percentage below state average.
- Black race population percentage significantly below state average.
- Hispanic race population percentage significantly below state average.
- Median age significantly above state average.
- Foreign-born population percentage significantly below state average.
- Renting percentage below state average.
- Length of stay since moving in significantly above state average.
- Number of rooms per house significantly below state average.
- House age significantly below state average.