Wayland, Massachusetts (MA) income map, earnings map, and wages data
The median household income in Wayland, MA in 2022 was $197,350, which was 52.1% greater than the median annual income of $94,488 across the entire state of Massachusetts. Compared to the median income of $101,036 in 2000 this represents an increase of 48.8%. The per capita income in 2022 was $109,450, which means an increase of 51.8% compared to 2000 when it was $52,717.
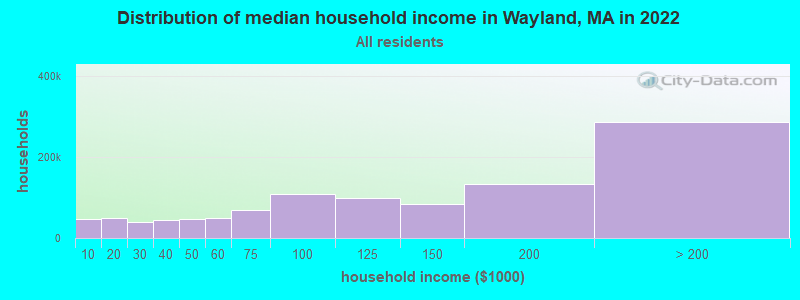
Income statistics for all residents
Median household income in Wayland, MA in 2022:| Wayland: | $197,351 |
| State: | $94,488 |
Change in median household income between 2000 and 2022:| Wayland, Massachusetts: | +95.3% |
| State: | +87.1% |
Number of households with income < $10k:| Wayland: | 4.5% (47,429) |
| Massachusetts: | 5.2% (146,170) |
Number of households with income $10k - 20k:| Wayland: | 4.7% (50,170) |
| State: | 6.4% (180,001) |
Number of households with income $20k - 30k:| Wayland: | 3.8% (40,163) |
| State: | 5.6% (156,667) |
Number of households with income $30k - 40k:| Wayland: | 4.2% (44,522) |
| Massachusetts: | 5.6% (157,168) |
Number of households with income $40k - 50k:| Wayland: | 4.5% (47,433) |
| State: | 5.4% (151,455) |
Number of households with income $50k - 60k:| Wayland: | 4.6% (49,268) |
| State: | 5.1% (142,726) |
Number of households with income $60k - 75k:| Wayland: | 6.5% (68,937) |
| Massachusetts: | 7.6% (212,203) |
Number of households with income $75k - 100k:| Wayland: | 10.2% (107,910) |
| State: | 11.3% (317,064) |
Number of households with income $100k - 125k:| Wayland: | 9.4% (100,099) |
| State: | 9.7% (270,603) |
Number of households with income $125k - 150k:| Wayland: | 7.9% (83,377) |
| State: | 8.0% (223,140) |
Number of households with income $150k - 200k:| Wayland: | 12.6% (133,934) |
| State: | 11.0% (308,695) |
Number of households with income > $200k:| Wayland: | 27.1% (286,966) |
| State: | 19.0% (531,884) |
Aggregate household income in Wayland in 2022: $33,313,246,537
Median family income in Wayland in 2022:| Wayland: | $231,241 |
| State: | $120,263 |
Median non-family income in Wayland in 2022:| Wayland: | $98,777 |
| State: | $55,979 |
Change in median non-family income between 2000 and 2022:| Wayland, Massachusetts: | +94.2% |
| State: | +88.0% |
Median per capita income in Wayland in 2022:| Wayland: | $109,450 |
| State: | $54,025 |
Change in median per capita income between 2000 and 2022:| Wayland, Massachusetts: | +107.6% |
| Massachusetts: | +108.2% |
Income statistics for White residents
Median household income in Wayland, MA in 2022:| Wayland: | $200,185 |
| State: | $101,391 |
Change in median household income between 2000 and 2022:| Wayland, Massachusetts: | +98.2% |
| Massachusetts: | +93.3% |
Number of households with income < $10k:| Wayland: | 3.9% (29,225) |
| State: | 4.4% (91,120) |
Number of households with income $10k - 20k:| Wayland: | 4.7% (35,626) |
| State: | 5.9% (122,055) |
Number of households with income $20k - 30k:| Wayland: | 3.8% (28,750) |
| State: | 5.1% (105,311) |
Number of households with income $30k - 40k:| Wayland: | 4.2% (32,051) |
| State: | 5.3% (110,239) |
Number of households with income $40k - 50k:| Wayland: | 4.0% (30,442) |
| State: | 5.0% (104,636) |
Number of households with income $50k - 60k:| Wayland: | 4.3% (32,705) |
| Massachusetts: | 4.8% (99,486) |
Number of households with income $60k - 75k:| Wayland: | 6.6% (49,843) |
| Massachusetts: | 7.5% (155,124) |
Number of households with income $75k - 100k:| Wayland: | 10.1% (76,713) |
| State: | 11.4% (236,252) |
Number of households with income $100k - 125k:| Wayland: | 8.8% (66,611) |
| State: | 9.9% (204,731) |
Number of households with income $125k - 150k:| Wayland: | 8.1% (61,522) |
| State: | 8.5% (175,324) |
Number of households with income $150k - 200k:| Wayland: | 13.2% (100,291) |
| Massachusetts: | 11.7% (242,980) |
Number of households with income > $200k:| Wayland: | 28.2% (213,370) |
| Massachusetts: | 20.5% (425,966) |
Aggregate household income in Wayland in 2022: $23,334,007,464
Median family income in Wayland in 2022:| Wayland: | $241,655 |
| State: | $133,153 |
Number of families with income < $10k:| Wayland: | 0.6% (33) |
| State: | 2.0% (25,038) |
Number of families with income $10k - 20k:| Wayland: | 0.5% (30) |
| State: | 2.1% (26,403) |
Number of families with income $20k - 30k:| Wayland: | 0.4% (24) |
| State: | 2.6% (32,525) |
Number of families with income $30k - 40k:| Wayland: | 0.8% (43) |
| State: | 3.9% (48,079) |
Number of families with income $40k - 50k:| Wayland: | 1.1% (60) |
| State: | 3.8% (46,908) |
Number of families with income $50k - 60k:| Wayland: | 0.8% (46) |
| State: | 3.8% (46,476) |
Number of families with income $60k - 75k:| Wayland: | 1.6% (91) |
| Massachusetts: | 6.4% (79,040) |
Number of families with income $75k - 100k:| Wayland: | 3.7% (206) |
| State: | 11.1% (137,395) |
Number of families with income $100k - 125k:| Wayland: | 5.1% (282) |
| State: | 11.1% (136,771) |
Number of families with income $125k - 150k:| Wayland: | 7.7% (430) |
| Massachusetts: | 10.0% (123,709) |
Number of families with income $150k - 200k:| Wayland: | 12.2% (681) |
| State: | 14.7% (181,602) |
Number of families with income > $200k:| Wayland: | 65.5% (3,650) |
| Massachusetts: | 28.5% (351,887) |
Median non-family income in Wayland in 2022:| Wayland: | $90,154 |
| Massachusetts: | $59,323 |
Change in median non-family income between 2000 and 2022:| Wayland, Massachusetts: | +90.7% |
| Massachusetts: | +94.3% |
Median per capita income in Wayland in 2022:| Wayland: | $115,326 |
| Massachusetts: | $60,804 |
Change in median per capita income between 2000 and 2022:| Wayland, Massachusetts: | +117.3% |
| State: | +118.7% |
Income statistics for Black or African American residents
Median household income in Wayland, MA in 2022:| Wayland: | $384,005 |
| State: | $63,189 |
Change in median household income between 2000 and 2022:| Wayland, Massachusetts: | +92.0% |
| State: | +87.4% |
Number of households with income < $10k:| Wayland: | 5.7% (7,257) |
| State: | 9.1% (15,797) |
Number of households with income $10k - 20k:| Wayland: | 7.1% (9,106) |
| Massachusetts: | 9.4% (16,267) |
Number of households with income $20k - 30k:| Wayland: | 4.3% (5,534) |
| Massachusetts: | 7.8% (13,520) |
Number of households with income $30k - 40k:| Wayland: | 6.4% (8,242) |
| Massachusetts: | 8.3% (14,412) |
Number of households with income $40k - 50k:| Wayland: | 9.6% (12,254) |
| State: | 7.9% (13,790) |
Number of households with income $50k - 60k:| Wayland: | 5.7% (7,286) |
| State: | 5.8% (10,041) |
Number of households with income $60k - 75k:| Wayland: | 8.9% (11,419) |
| State: | 8.5% (14,822) |
Number of households with income $75k - 100k:| Wayland: | 13.0% (16,626) |
| State: | 11.0% (19,122) |
Number of households with income $100k - 125k:| Wayland: | 8.1% (10,380) |
| Massachusetts: | 8.4% (14,575) |
Number of households with income $125k - 150k:| Wayland: | 6.7% (8,599) |
| Massachusetts: | 6.0% (10,429) |
Number of households with income $150k - 200k:| Wayland: | 11.2% (14,308) |
| State: | 7.2% (12,539) |
Number of households with income > $200k:| Wayland: | 13.3% (16,968) |
| State: | 10.5% (18,185) |
Aggregate household income in Wayland in 2022: $10,219,605
Median family income in Wayland in 2022:| Wayland: | $462,824 |
| Massachusetts: | $79,815 |
Number of families with income $30k - 40k:| Wayland: | 1.8% (3) |
| State: | 6.4% (7,002) |
Number of families with income > $200k:| Wayland: | 98.2% (173) |
| Massachusetts: | 12.9% (14,108) |
Median per capita income in Wayland in 2022:| Wayland: | $93,414 |
| Massachusetts: | $33,524 |
Change in median per capita income between 2000 and 2022:| Wayland, Massachusetts: | +98.1% |
| Massachusetts: | +109.4% |
Income statistics for Asian residents
Median household income in Wayland, MA in 2022:| Wayland: | $208,818 |
| Massachusetts: | $117,855 |
Change in median household income between 2000 and 2022:| Wayland, Massachusetts: | +108.1% |
| State: | +129.9% |
Number of households with income < $10k:| Wayland: | 6.0% (7,413) |
| State: | 6.8% (11,982) |
Number of households with income $10k - 20k:| Wayland: | 3.1% (3,826) |
| Massachusetts: | 4.8% (8,376) |
Number of households with income $20k - 30k:| Wayland: | 1.9% (2,398) |
| State: | 3.7% (6,558) |
Number of households with income $30k - 40k:| Wayland: | 2.4% (2,950) |
| State: | 3.3% (5,748) |
Number of households with income $40k - 50k:| Wayland: | 4.4% (5,390) |
| Massachusetts: | 4.1% (7,192) |
Number of households with income $50k - 60k:| Wayland: | 4.3% (5,320) |
| State: | 5.0% (8,734) |
Number of households with income $60k - 75k:| Wayland: | 4.5% (5,538) |
| Massachusetts: | 5.8% (10,203) |
Number of households with income $75k - 100k:| Wayland: | 7.9% (9,786) |
| State: | 8.6% (15,154) |
Number of households with income $100k - 125k:| Wayland: | 13.0% (16,046) |
| State: | 10.8% (18,942) |
Number of households with income $125k - 150k:| Wayland: | 8.3% (10,241) |
| State: | 8.0% (14,037) |
Number of households with income $150k - 200k:| Wayland: | 11.1% (13,704) |
| State: | 12.5% (21,856) |
Number of households with income > $200k:| Wayland: | 32.9% (40,568) |
| Massachusetts: | 26.6% (46,694) |
Aggregate household income in Wayland in 2022: $179,479,171
Median family income in Wayland in 2022:| Wayland: | $226,635 |
| State: | $140,113 |
Number of families with income $20k - 30k:| Wayland: | 0.6% (7) |
| State: | 2.3% (2,708) |
Number of families with income $30k - 40k:| Wayland: | 0.3% (3) |
| Massachusetts: | 2.8% (3,234) |
Number of families with income $40k - 50k:| Wayland: | 2.9% (33) |
| State: | 3.9% (4,621) |
Number of families with income $60k - 75k:| Wayland: | 3.0% (34) |
| Massachusetts: | 6.1% (7,105) |
Number of families with income $75k - 100k:| Wayland: | 1.9% (21) |
| Massachusetts: | 8.5% (10,022) |
Number of families with income $100k - 125k:| Wayland: | 7.2% (82) |
| Massachusetts: | 10.0% (11,697) |
Number of families with income $125k - 150k:| Wayland: | 4.8% (55) |
| State: | 8.6% (10,071) |
Number of families with income $150k - 200k:| Wayland: | 6.3% (71) |
| State: | 13.2% (15,478) |
Number of families with income > $200k:| Wayland: | 73.1% (831) |
| Massachusetts: | 34.0% (39,856) |
Median non-family income in Wayland in 2022:| Wayland: | $118,171 |
| State: | $71,440 |
Change in median non-family income between 2000 and 2022:| Wayland, Massachusetts: | +119.9% |
| State: | +128.0% |
Median per capita income in Wayland in 2022:| Wayland: | $108,685 |
| Massachusetts: | $58,900 |
Income statistics for Hispanic or Latino residents
Median household income in Wayland, MA in 2022:| Wayland: | $270,549 |
| State: | $61,523 |
Change in median household income between 2000 and 2022:| Wayland, Massachusetts: | +138.1% |
| Massachusetts: | +125.4% |
Number of households with income < $10k:| Wayland: | 6.6% (8,138) |
| Massachusetts: | 8.8% (25,307) |
Number of households with income $10k - 20k:| Wayland: | 7.1% (8,701) |
| Massachusetts: | 10.0% (28,653) |
Number of households with income $20k - 30k:| Wayland: | 6.0% (7,443) |
| State: | 8.8% (25,189) |
Number of households with income $30k - 40k:| Wayland: | 3.4% (4,174) |
| State: | 7.2% (20,822) |
Number of households with income $40k - 50k:| Wayland: | 6.4% (7,871) |
| State: | 7.2% (20,817) |
Number of households with income $50k - 60k:| Wayland: | 6.1% (7,573) |
| State: | 6.5% (18,748) |
Number of households with income $60k - 75k:| Wayland: | 6.3% (7,770) |
| State: | 8.8% (25,390) |
Number of households with income $75k - 100k:| Wayland: | 11.4% (14,092) |
| Massachusetts: | 12.0% (34,488) |
Number of households with income $100k - 125k:| Wayland: | 10.6% (13,053) |
| Massachusetts: | 8.6% (24,599) |
Number of households with income $125k - 150k:| Wayland: | 7.5% (9,242) |
| State: | 6.2% (17,743) |
Number of households with income $150k - 200k:| Wayland: | 11.4% (14,051) |
| State: | 7.3% (21,017) |
Number of households with income > $200k:| Wayland: | 17.2% (21,197) |
| Massachusetts: | 8.6% (24,606) |
Aggregate household income in Wayland in 2022: $34,055,234
Median family income in Wayland in 2022:| Wayland: | $405,460 |
| Massachusetts: | $66,072 |
Number of families with income < $10k:| Wayland: | 1.7% (7) |
| State: | 6.2% (12,456) |
Number of families with income $10k - 20k:| Wayland: | 2.1% (8) |
| State: | 6.0% (12,071) |
Number of families with income $20k - 30k:| Wayland: | 1.8% (7) |
| State: | 10.1% (20,376) |
Number of families with income $30k - 40k:| Wayland: | 1.2% (5) |
| Massachusetts: | 8.2% (16,470) |
Number of families with income $40k - 50k:| Wayland: | 2.6% (10) |
| State: | 7.4% (14,829) |
Number of families with income $50k - 60k:| Wayland: | 3.1% (12) |
| State: | 7.3% (14,643) |
Number of families with income $60k - 75k:| Wayland: | 4.5% (18) |
| State: | 10.6% (21,252) |
Number of families with income $75k - 100k:| Wayland: | 7.6% (31) |
| State: | 12.0% (24,088) |
Number of families with income $100k - 125k:| Wayland: | 8.6% (34) |
| Massachusetts: | 8.9% (17,954) |
Number of families with income $125k - 150k:| Wayland: | 9.1% (37) |
| State: | 6.9% (13,837) |
Number of families with income $150k - 200k:| Wayland: | 11.8% (47) |
| State: | 7.3% (14,683) |
Number of families with income > $200k:| Wayland: | 45.8% (184) |
| Massachusetts: | 9.3% (18,741) |
Median non-family income in Wayland in 2022:| Wayland: | $221,023 |
| State: | $37,563 |
Change in median non-family income between 2000 and 2022:| Wayland, Massachusetts: | +98.1% |
| State: | +115.0% |
Median per capita income in Wayland in 2022:| Wayland: | $70,127 |
| State: | $28,993 |
Change in median per capita income between 2000 and 2022:| Wayland, Massachusetts: | +142.9% |
| State: | +142.4% |
Income statistics for American Indian and Alaska Native residents
Median household income in Wayland, MA in 2022:| Wayland: | $194,282 |
| State: | $87,730 |
Number of households with income < $10k:| Wayland: | 6.6% (828) |
| State: | 6.6% (451) |
Number of households with income $10k - 20k:| Wayland: | 7.0% (874) |
| State: | 7.0% (476) |
Number of households with income $20k - 30k:| Wayland: | 2.8% (353) |
| State: | 2.8% (192) |
Number of households with income $30k - 40k:| Wayland: | 3.2% (400) |
| State: | 3.2% (218) |
Number of households with income $40k - 50k:| Wayland: | 2.9% (365) |
| State: | 2.9% (199) |
Number of households with income $50k - 60k:| Wayland: | 9.9% (1,243) |
| State: | 9.9% (677) |
Number of households with income $60k - 75k:| Wayland: | 11.5% (1,434) |
| State: | 11.5% (781) |
Number of households with income $75k - 100k:| Wayland: | 9.2% (1,155) |
| State: | 9.2% (629) |
Number of households with income $100k - 125k:| Wayland: | 6.0% (745) |
| State: | 6.0% (406) |
Number of households with income $125k - 150k:| Wayland: | 13.5% (1,691) |
| Massachusetts: | 13.5% (921) |
Number of households with income $150k - 200k:| Wayland: | 12.6% (1,577) |
| State: | 12.6% (859) |
Number of households with income > $200k:| Wayland: | 14.7% (1,841) |
| State: | 14.7% (1,003) |
Aggregate household income in Wayland in 2022: $6,418,997
Median family income in Wayland in 2022:| Wayland: | $76,760 |
| Massachusetts: | $105,715 |
Number of families with income $60k - 75k:| Wayland: | 100.0% (23) |
| Massachusetts: | 14.7% (471) |
Median non-family income in Wayland in 2022:| Wayland: | $321,438 |
| State: | $75,379 |
Median per capita income in Wayland in 2022:| Wayland: | $130,861 |
| State: | $39,434 |
Income statistics for Multirace residents
Median household income in Wayland, MA in 2022:| Wayland: | $492,649 |
| State: | $71,552 |
Change in median household income between 2000 and 2022:| Wayland, Massachusetts: | +146.3% |
| State: | +109.0% |
Number of households with income < $10k:| Wayland: | 5.4% (11,709) |
| State: | 6.6% (15,127) |
Number of households with income $10k - 20k:| Wayland: | 6.0% (13,083) |
| Massachusetts: | 9.2% (21,158) |
Number of households with income $20k - 30k:| Wayland: | 2.8% (6,167) |
| State: | 7.8% (18,016) |
Number of households with income $30k - 40k:| Wayland: | 6.0% (13,147) |
| Massachusetts: | 7.9% (18,260) |
Number of households with income $40k - 50k:| Wayland: | 4.1% (8,963) |
| State: | 5.6% (13,027) |
Number of households with income $50k - 60k:| Wayland: | 5.9% (12,827) |
| Massachusetts: | 5.6% (12,909) |
Number of households with income $60k - 75k:| Wayland: | 6.7% (14,456) |
| State: | 9.0% (20,800) |
Number of households with income $75k - 100k:| Wayland: | 12.9% (28,124) |
| State: | 12.1% (27,875) |
Number of households with income $100k - 125k:| Wayland: | 10.8% (23,365) |
| State: | 8.1% (18,754) |
Number of households with income $125k - 150k:| Wayland: | 6.4% (13,836) |
| State: | 6.8% (15,621) |
Number of households with income $150k - 200k:| Wayland: | 12.8% (27,878) |
| State: | 9.4% (21,618) |
Number of households with income > $200k:| Wayland: | 20.1% (43,786) |
| State: | 12.0% (27,592) |
Aggregate household income in Wayland in 2022: $163,440,454
Median family income in Wayland in 2022:| Wayland: | $454,241 |
| State: | $78,380 |
Number of families with income $10k - 20k:| Wayland: | 1.1% (11) |
| State: | 4.9% (7,678) |
Number of families with income $150k - 200k:| Wayland: | 21.6% (216) |
| State: | 10.3% (15,978) |
Number of families with income > $200k:| Wayland: | 77.3% (771) |
| State: | 14.0% (21,838) |
Median per capita income in Wayland in 2022:| Wayland: | $226,022 |
| State: | $34,029 |
Change in median per capita income between 2000 and 2022:| Wayland, Massachusetts: | +116.4% |
| State: | +132.1% |
Income statistics for other residents
Number of households with income < $10k:| Wayland: | 8.7% (218) |
| Massachusetts: | 8.4% (11,559) |
Number of households with income $10k - 20k:| Wayland: | 5.5% (137) |
| State: | 8.4% (11,499) |
Number of households with income $20k - 30k:| Wayland: | 11.0% (276) |
| Massachusetts: | 9.5% (13,070) |
Number of households with income $30k - 40k:| Wayland: | 3.6% (91) |
| State: | 6.0% (8,291) |
Number of households with income $40k - 50k:| Wayland: | 9.2% (230) |
| Massachusetts: | 9.2% (12,611) |
Number of households with income $50k - 60k:| Wayland: | 9.1% (227) |
| State: | 7.9% (10,879) |
Number of households with income $60k - 75k:| Wayland: | 7.7% (193) |
| State: | 7.5% (10,239) |
Number of households with income $75k - 100k:| Wayland: | 10.5% (262) |
| State: | 13.1% (18,032) |
Number of households with income $100k - 125k:| Wayland: | 9.9% (249) |
| Massachusetts: | 9.6% (13,141) |
Number of households with income $125k - 150k:| Wayland: | 5.6% (141) |
| State: | 5.0% (6,808) |
Number of households with income $150k - 200k:| Wayland: | 5.7% (143) |
| State: | 6.4% (8,843) |
Number of households with income > $200k:| Wayland: | 13.6% (340) |
| State: | 9.0% (12,396) |
Median non-family income in Wayland in 2022:| Wayland: | $4,543 |
| Massachusetts: | $36,127 |
Change in median non-family income between 2000 and 2022:| Wayland, Massachusetts: | +81.8% |
| Massachusetts: | +123.4% |
Median per capita income in Wayland in 2022:| Wayland: | $33,710 |
| State: | $30,797 |